Contents lists available atScienceDirect
Magnetic Resonance Imaging
journal homepage:www.elsevier.com/locate/mri
Original contribution
In vivo
31P-MRS of muscle bioenergetics in marine invertebrates: Future ocean limits scallops' performance
Christian Bock
a,⁎, Felizitas C. Wermter
a,b, Burgel Schalkhausser
a, Martin E. Blicher
c, Hans-O. Pörtner
a,b, Gisela Lannig
a, Mikael K. Sejr
daIntegrative Ecophysiology, Alfred Wegener Institute Helmholtz Centre for Polar and Marine Research, Am Handelshafen 12, 27570 Bremerhaven, Germany
bUniversity of Bremen, Bibliothekstraße 1, 28359 Bremen, Germany
cGreenland Climate Research Centre, Greenland Institute of Natural Resources, Kivioq 2, 3900 Nuuk, Greenland
dArctic Research Center, Aarhus University, Ny Munkegade byg 1540, 8000 Aarhus C, Denmark
A R T I C L E I N F O
Keywords:
Chemical shift imaging (CSI) pH
Phosphagen Energy metabolism Aerobic power budget Bivalves
A B S T R A C T
Object: Dynamicin vivo31P-NMR spectroscopy in combination with Magnetic Resonance Imaging (MRI) was used to study muscle bioenergetics of boreal and Arctic scallops (Pecten maximusandChlamys islandica) to test the hypothesis that future Ocean Warming and Acidification (OWA) will impair the performance of marine invertebrates.
Materials & methods:Experiments were conducted following the recommendations for studies of muscle bioe- nergetics in vertebrates. Animals were long-term incubated under different environmental conditions: controls at 0 °C forC. islandicaand 15 °C forP. maximusunder ambientPCO2of 0.039 kPa, a warm exposure with +5 °C (5 °C and 20 °C, respectively) under ambientPCO2(OW group), and a combined exposure to warmed acidified conditions (5 °C and 20 °C, 0.112 kPaPCO2, OWA group). Scallops were placed in a 4.7 T MR animal scanner and the energetic status of the adductor muscle was determined under resting conditions usingin vivo31P-NMR spectroscopy. The surplus oxidativeflux (Qmax) was quantified by recording the recovery of arginine phosphate (PLA) directly after moderate swimming exercise of the scallops.
Results:Measurements led to reproducible results within each experimental group. Under projected future conditions resting PLA levels (PLArest) were reduced, indicating reduced energy reserves in warming exposed scallopsper se. In comparison to vertebrate muscle tissue surplus Qmaxof scallop muscle was about one order of magnitude lower. This can be explained by lower mitochondrial contents and capacities in invertebrate than vertebrate muscle tissue. Warm exposed scallops showed a slower recovery rate of PLA levels (kPLA) and a reduced surplus Qmax. ElevatedPCO2did not affected PLA recovery further.
Conclusion:Dynamic in vivo31P-NMR spectroscopy revealed constrained residual aerobic power budgets in boreal and Arctic scallops under projected ocean warming and acidification indicating that scallops are sus- ceptible to future climate change. The observed reduction in muscular PLArestof scallops coping with a warmer and acidified ocean may be linked to an enhanced energy demand and reduced oxygen partial pressures (PO2) in their bodyfluids. Delayed recovery from moderate swimming at elevated temperature is a result of reduced PLArestconcentrations associated with a warm-induced reduction of a residual aerobic power budget.
1. Introduction
Anthropogenic CO2emissions are causing global warming and de- creasing oceanic pH values, known as ocean warming and acidification (OWA) [1], with potentially severe consequences for marine life [2].
Depending on the climate model used, the global mean temperature is projected to rise by 2–3 °C while CO2concentrations will increase by up to 0.1 kPa PCO2, accompanied by a drop in oceanic pH by up to
0.32 units until 2100 [3].
Ocean warming has a direct impact on all marine ectothermal or- ganisms, whose body temperature changes with environmental tem- perature. Due to thermodynamic relations, known as the Q10rule of van't Hoff, physiological/biochemical processes increase with in- creasing temperatures bearing consequences for organismal energy budget and aerobic performance [4,5]. Marine ectotherms are adapted to their environmental temperature regime implying that they are
https://doi.org/10.1016/j.mri.2019.06.003
Received 19 February 2019; Received in revised form 15 May 2019; Accepted 2 June 2019
⁎Corresponding author.
E-mail address:Christian.Bock@awi.de(C. Bock).
0730-725X/ © 2019 Elsevier Inc. All rights reserved.
T
capable of fueling maintenance costs and allocating surplus energy towards growth, exercise and reproduction. Outside of the optimal thermal range temperature-induced impairment of the energy budget leads to decreased performance capacities and it is hypothesized that ocean acidification will exacerbate such warming-induced energetic disturbances [6].
Scallops are exceptional among bivalves since most species are ac- tive swimmers. Their swimming ability plays an important role in protection against predators [7] and in colonizing new habitats [8]. In combination with specific shell morphology swimming is realized/
performed by the interplay of two muscle types: the smaller tonic or catch muscle and the main phasic adductor muscle. The phasic muscle consists of white muscle fibers from a fast-twitching type enabling swimming by jet propulsionviaclapping [9]. Clapping is mainly fueled by the depletion of phosphagen stores which are hydrolyzed to re- plenish the ATP consumed during swimming. In contrast, the tonic muscle is an aerobic slow-twitching muscle type with relatively high mitochondrial content and is predominantly used for prolonged valve closures [9,10]. In contrast to blue mussels or oysters, scallops are usually not as tightly closed and thus can still rely on aerobic energy production during this time. Muscle use and bioenergetics in bivalves differ greatly from that in vertebrates and there is still limited knowl- edge of functional patterns and associated metabolism in molluscan muscles. One main difference is the use of arginine phosphate (PLA)vs.
phosphocreatine (PCr) as a phosphagen source to buffer ATP levels during exercise [9,10]. In mollusks, during recovery from moderate muscle work, PLA in the phasic adductor muscle is re-synthesized by transphosphorylation from ATP produced by mitochondrial oxidative phosphorylation [9–11]. After exhaustive exercise re-phosphorylation of arginine is additionally supported by transphosphorylation from ATP, which is produced by anaerobic glycolysis forming the arginine derivate octopine [9,10,12].
In vivo 31P-NMR spectroscopy enables the online measurement of the cellular energy status and metabolism, tracing the use and re- generation of high-energy phosphates ATP and phosphagen, such as PCr or PLA, and their end product, inorganic phosphate (Pi).
Intracellular pH (pHi) can be determined from the position of the Pi signal within the NMR spectrum [13]. This approach has successfully been applied to scallops [14,15].
In 1997 Paganini and co-authors [16] introduced dynamicin vivo
31P-NMR spectroscopy to determine the muscular maximum oxidative flux (Qmax[ATPμmol/g/min]) from the recovery rate of PCr, which was followed and analyzed from consecutivein vivo31P-NMR spectra after moderate exercise in rats. In fully aerobic muscle PCr is re-syn- thesized from ATP which is replenished by mitochondrial oxidative phosphorylation and the recovery rate of phosphagen thus mainly re- flects the maximal phosphorylation capacity of operative muscle mi- tochondria. This approach was cross-validated by oxidative capacity measurements in mitochondria isolated from muscle biopsies [17].
Thus, in vertebrate muscle PCr displays a mono-exponential recovery rate under moderate exercise providing constant intracellular pH and unchanged magnesium concentrations [18]. Accordingly, following moderate exercise in bivalves, the mono-exponential recovery rate of PLA concentration reflects the maximum surplus oxidative flux of a molluscan muscle. Another technique that was frequently used in the past for measuring phosphagen turnover is saturation transfer31P-NMR spectroscopy. This technique was already used in anin vitrostudy to determine kinetic properties of arginine kinase and was published on isolated phasic muscle of a scallop [19]. Saturation transfer31P-NMR spectroscopy assesses oxidative muscle metabolism under resting con- dition and therefore reflect steady-state turnover and accordingly mi- tochondrial activity at rest and is therefore not the method of choice for exercise studies [20].
Guderley and Pörtner proposed a concept of a metabolic power budget for (active) marine ectotherms including scallops [4]. It suggests that all organism functions have specific aerobic costs fueled by a total
aerobic power budget, which is constant and defines the organism's capacity to carry out all or some of them at a time as the available energy has to be divided between the different functions. The aerobic power budget thus determines the organism's steady state performance capacity for growth, locomotion, recovery of exercise or digestion and relies on the overall mitochondrial oxidative capacity. Towards the limits of an organism's environmental thermal range, the aerobic per- formance becomes constrained, as elaborated by the concept of oxygen and capacity limited thermal tolerance (OCLTT, [21]). If no tempera- ture-dependent metabolic adjustments take place, the warming-induced rise in maintenance costs of ectotherms results in energetic trade-offs as the costs have to be fueled at the expense of other fitness-related parameters. Experimental study of this relationship ideally requires animals to undergo different steady state levels of performance (e.g.
steady state swimming at different speeds in pelagicfish). However, many animals do not show such a steady state locomotion but use ac- tivity bouts only during attack or escape responses, that can be fueled by a mix of aerobic and anaerobic metabolism. Studying tradeoffs in aerobic energy budget involving different modes and levels of exercise are thus rather complicated. In scallops the restoration of PLA during recovery is an aerobic process [9], therefore we used two scallop spe- cies, the king scallop,Pecten maximus, and the Iceland scallop,Chlamys islandica, as animal models for such studies. Many bivalves including scallops show only partial or no compensation in standard metabolic rate to changing environmental temperatures [22–25]. We aim to link our earlier investigations of OWA impact on energy metabolism and swimming performance of scallops (see [25]) with a more in-depth study of the underlying muscle bioenergetics. Based on an established methodology for studying pHi and muscle bioenergetics byin vivo31P- NMR spectroscopy [15], we tested the applicability of dynamic 31P- NMR spectroscopy. Scallops were long-term incubated at control, ele- vated temperature (+5 °C above the environmental summer mean) and increased PCO2 levels (~0.112 kPa) as projected for the end of this century. We determined the energetic status of the adductor muscle usingin vivo31P-NMR spectroscopy under resting conditions and after moderate exercise. The surplus maximum oxidative flux (Qmax) was estimated by measuring the recovery rate of PLA directly after the swimming trials. We interpret thisflux to represent the surplus rate of aerobic energy production that is allocated to phosphagen repletion after other baseline costs may be met. According to the theory of the aerobic power budget [4] we hypothesize that the rising maintenance costs under ocean warming (OW) and OWA will cause constraints on the residual aerobic power budget of scallop muscle, with feedbacks on the animals' aerobic performance capacities.
2. Materials and methods
2.1. Animal incubation
For detailed information on the animals' set up of the long-term incubation facilities and incubation parameters see Schalkhausser et al.
[25]. In brief, wild living king scallops,Pecten maximus(Linnaeus 1758) were purchased in September 2011 from the Marine Station Roscoff (“Station Biologique de Roscoff”, at Morlaix Bay, France). At the time of collection, the ambient temperatures were around 11–14 °C. Wild Ice- land scallops,Chlamys islandica(O. F. Müller, 1776) were collected in June 2011 at an ambient temperature of 0 °C using a triangulated dredge at 50–60 m in the outer Kobbefjorden, southwest Greenland.
The annual temperature variation in Kobbefjorden in 30 m depth varies from −1.5 °C to 3 °C [26]. At the Alfred Wegener Institute (Bre- merhaven, Germany) scallops were placed in recirculating aerated aquarium systems at salinity levels of 32–33 psu and 0 °C and 15 °C, respectively. Specimens taken from the aquarium system served as control group and were kept under present-day normocapnic conditions (PCO2level of ~0.039 kPa, 390μatm) at 0 °C and 15 °C, respectively. To mimic future warming randomized groups of scallops were incubated
for 50 days in temperature-control rooms in recirculation systems at 5 °C and 20 °C, respectively. The systems were continuously bubbled with a specific gas mixture to reach seawater PCO2values of either present-day of ~0.039 kPa (390μatm, OW group) or values projected for 2100 of ~0.112 kPa (1120μatm, OWA group). The water was ex- changed at least twice a week. Water parameters in both, control and incubation systems were measured twice a week (seeTable 1). Shell dimensions (height, length, width in [cm]) were measured using a ca- liper and did not differ prior to and after the incubation, irrespective of experimental group. To account for possible side effects due to size differences animals from similar size (shell length) were chosen, around 12 cm forP. maximusand 8 cm forC. islandica.
Animals were drip-fed live phytoplankton (SA Premium Reef Blend, coralsands) three times per week for at least 6 h. Dependent on accli- mation temperature the concentrations varied between 0.6 and 1.1 × 10⁶ cells h−1g−1bivalve biomass to account for different en- ergetic demands and to prevent the possible impact of food limitation on high-energy phosphates. Indeed, incubation conditions did not lead to different condition indices in the scallops (9.0 ± 0.9 (0 °C), 9.3 ± 1.9 (5 °C) and 7.4 ± 0.7 (5 °C + CO2) for C. islandica) and (13.6 ± 2.3 (10 °C), 13.0 ± 1.0 (20 °C), 11.7 ± 1.5 (20 °C + CO2) for P. maximum) [25].
Prior to measurements animals were starved for at least 12–24 h (depending on species and respective temperature) to avoid inter- ference of postprandial metabolism and feces excretion.
2.2. Experimental setup and MR measurements 2.2.1. Exercise protocol/design
The experimental set-up used for in vivo 31P-NMR spectroscopy studies followed the principal design as described in detail for MR studies on marine organisms [27]. Briefly, the scallop was placed and fixed on a piece of Velcro in a tempered Perspex chamber, similar to [15], that was continuously perfused with seawater from a water re- servoir maintained under the specific conditions of the different ex- perimental groups (control, OW and OWA). Chamber temperature was monitored continuously using a fiber-optic sensor (Luxtron 504, Polytec, Germany) that was fixed into the Perspex chamber and was recorded on a computerviaa PowerLab system (AD-Instruments, Aus- tralia). Prior to stimulating swimming, the specimens' optimal position and localization inside the MR scanner was determined using pilot scans in all three directions. In addition,in vivo31P-NMR spectra were recorded under resting conditions for potential individual or group specific differences in the energy status. Stimulation was performed outside of the MR scanner without disconnecting the chamber from the recirculating system to minimize the handling time till the actual start of the recordings during the recovery phase. An experimental protocol for moderate exercise of scallops was designed assuming approximately the half of claps performed during exhausted exercise until fatigue.P.
maximuswas stimulated to clap ~30 times compared to 50–70 claps
determined for exhausted swimming [15], whereas in C. islandica moderate stimulation resulted in 5 to 15 claps compared to 20–40 claps until fatigue [28]. Following recent studies on scallops, all animals were stimulated to swim by (repeated) injection of tap water into the mantle cavity until the animal performed the desired number of claps asso- ciated with moderate exercise [25,29]. A maximum of around 5 mL tab water was used for the entire stimulation period for all animals, which is negligible in light of the total reservoir volume of approximately 30 L of seawater. The pump rate for seawater recirculation was at least 0.5 L/min, making the exchange rate high enough to prevent an accu- mulation of tap water inside the animal chamber. Therefore, potential side effects from salinity changes in the experimental chamber or inside the mantle cavity can be excluded. Directly after stimulation the chamber was placed back into the MR scanner and measurements of the PLA recovery rate started in < 2 min after the last clap.
2.2.2. MR imaging and spectroscopy
All studies were performed in a 4.7 T horizontal MR scanner with actively shielded gradient coils (Bruker Biospec 47/40 Avance III System, Bruker, Germany) and a bore of 40 cm. MR images and NMR spectroscopy were conducted using a 5 cm triple-tunable (1H-31P-13C) surface coil. The surface coil was placed directly under the chamber nearest to the adductor muscle of the scallops, maximizing signal strength and localization. After adequate tuning of the surface coil, zero frequency settings andfield homogeneity were optimized. Pilot scans were collected right before and after stimulation using a multi-slice gradient echo sequences in all three directions to ensure the optimal position of the surface coil relative to the adductor muscle (matrix 256*256, FOV 15*15 cm, slice thickness 2.64 mm, TR: 100 ms, TE:
3 ms, scan time 12 s). Frequency setting and shimming were auto- matically re-adjusted right after exercise. For the determination of muscle size and the calculation of adductor muscle volume, rapid ac- quisition with relaxation enhancement (RARE) images optimized for morphological MRI of marine organisms [15,30,31], were performed in coronal and sagittal direction (matrix 256*256, FOV 12*12 cm, slice thickness 1.5 mm, TR: 10000 ms, TE: 13.7 ms, rare factor of 12, scan time 3.5 min). In vivo non-localized 31P-NMR spectra were acquired using parameters similar to Bailey et al. [15] (number of scans:
ns = 256 and a repetition delay of 1 s resulting in an accumulation time of 4 min 26 s for each spectrum). In addition, to test for partial side effects of surrounding tissues,in vivolocalized31P-NMR spectra were obtained in control animals ofP. maximusonly using an image-selected in vivospectroscopy (ISIS) sequence [32]. The pulse scheme consisted of eight selective inversion pulses to define a voxel. Each inversion pulse lasted for 18.5 ms. 0.15 ms block-pulses were used for detection. A re- petition time of 1 s and ns = 128–256 resulted in an acquisition time between 17 and 34 min. The voxel size was 36*30*30 mm.In vivo31P- chemical shift imaging (CSI) was also performed onP. maximusto get an overview of PLA distribution under resting conditions [33]. Thefield of view was 12*12 cm with 16 by 16 phase encoding steps. A repetition time of 1 s was used resulting in a total scan time of 7 h. Data were processed with a zero filling from 1024 to 2.048 points in the time domain and an exponential line broadening of 10. The PLA map ex- pressed in percentage was produced applying a linearfilter using the CSI tool within the operating software of the MR scanner (ParaVision 5.1, Bruker, Germany). The noise level was set to 20% in the PLA map.
2.2.3. Spectral analysis and metabolic calculations
A block ofin vivo31P-NMR spectra was accumulated under control conditions. NMR spectra were considered as resting conditions when the signal areas of the PLA and Pi peaks did not reveal any changes. A second block of31P-NMR spectra was acquired directly after exercise until recovery of the scallops. Complete recovery was assumed when the PLA concentration had returned to at least 95% of the resting value.
For the control group inP. maximus, one non-localized and four loca- lized experiments were acquired. The direct comparison of PLA Table 1
Physicochemical conditions of seawater during the incubation under control, ocean warming (OW) and ocean warming and acidification (OWA)C. islandica (CI) and ofP. maximus(PM).
Treatment PM Control OW OWA
Temperature (°C) 15.0 ± 0.08 19.6 ± 0.3 19.8 ± 0.2
PCO2(kPa) n.d. 0.045 ± 0.004 0.117 ± 0.024
pH (NBS scale) 8.03 ± 0.03 8.15 ± 0.03 7.86 ± 0.08
Treatment CI Control OW OWA
Temperature (°C) 0.1 ± 0.4 5.0 ± 0.1 5.0 ± 0.4 PCO2(kPa) 0.034 ± 0.006 0.036 ± 0.009 0.114 ± 0.027 pH (NBS scale) 8.22 ± 0.08 8.21 ± 0.05 7.82 ± 0.16
concentrations calculated from non-localized and localized 31P-NMR spectra led to same results and did not show significant differences between both techniques. Therefore, to benefit from the better time resolution, non-localized31P-NMR spectroscopy was used for the ana- lyses of OW and OWA groups ofP. maximusand for all groups ofC.
islandica.
All spectra were processed automatically using a user routine [34]
and signals were assigned relative to the PLA signal which was set to 0 ppm. pHi was calculated from the pH-dependent shift of Pi relative to the PLA peak, which served as an internal standard. pHi values were calculated for the specific temperature using temperature compensated equations adapted from Kost [35] and pK values adjusted to ionic strength obtained from Pörtner et al. [36].
PLArest and Pi concentrations were used as a measure of muscle energetic status of scallops [14] under control conditions. Signal in- tegrals were calculated relative to the area under the α-ATP/ADP signal. Concentrations were quantified to an assumed free ATP con- centration at rest of 3.75μmol/g wet muscle tissue according to the concentration determined inArgopecten purpuratus[37].
For a direct comparison of the PLA kinetics between groups, the ordinate values were normalized to PLAnorm= PLA/(PLA + Pi). The rate constant of PLA re-synthesis (kPLA[1/min]) was determined by fitting a single mono-exponential curve to PLAnormafter Hallman et al.
[37]:
= − ∗ − − ∗ +
PLAnorm( )t (PLArest PLAex) (1 e kPLA t) PLAex
where t is time [min], PLArest and PLAex[μmol/g ww tissue] are the PLA concentration under resting conditions and at the end of exercise, respectively. The values for kPLA[1/min] were taken directly from the curvefit. The maximum surplus oxidativeflux (Qmax[ATPμmol/g ww tissue/min]) was determined as the product of kPLAand PLArest[17].
2.3. Statistics
Data sets were analyzed using GraphPad Prism (Version 4.0a, GraphPad Software Inc.). Mono-exponential curves were fitted using the curvefitter within Prism. A one-way analysis of variance (ANOVA) in combination with Dunnett's multiple comparison test was used to test for significant differences between control and experimental groups. In addition, a post test for a linear trend across groups was performed.
ANOVA in combination with a Newman-Keuls test was used to identify differences in morphological and muscle bioenergetic parameters be- tween groups (p-value < 0.05). Data are given as means ± SD.
3. Results
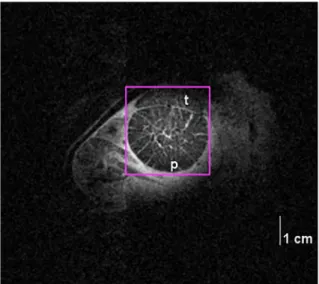
Fig. 1 presents an anatomical coronal MR image of P. maximus under resting conditions. The heart and the main organs are located on the left side of the image near the valve of the shell. The circular ad- ductor muscle is located in the upper center of the MR image. The contrast of the MR image distinguishes the two muscle types. The main phasic muscle type is located in the center, whereas the much denser looking crescent shaped tonic muscle is located in the upper right part of the adductor muscle. The bright lines crossing the muscle in the MR image result from hemolymph (blood) perfusion, despite the existence of a developed vascular system in the adductor muscle. The purple box around the adductor muscle is indicating thefield of view used for the localized NMR spectroscopy trials. The calculated volume of the ad- ductor muscle from RARE images in the three groups (control, OW and OWA) varied between 20 and 26 cm3ofP. maximusand between 6 and 10 cm3of the smaller scallopC. islandicawithout significant differences between the species-specific groups (data not shown).
Fig. 2shows an example of a chemical shift image of the PLA dis- tribution under control conditions overlaid on the corresponding ana- tomical MR image ofP. maximus. The PLA distributionfits reasonably well with the anatomical properties of the adductor muscle, indicating a
good localization of31P-NMR spectra in the phasic part of the adductor muscle. The highest PLA concentration was found in the center of the phasic muscle independent of the position of the surface coil relative to the phasic muscle.
Resting PLA concentrations from both species are presented in Fig. 3. PLArestwas higher inP. maximusin comparison toC. islandica under control conditions. Between experimental groups PLArest was highest in the control group of both species and was significantly lower during warming (OW). InP. maximus resting PLA concentration was further decreased under the combined treatment (OWA). No significant changes in initial resting pHi values or ATP concentration were ob- served between the different groups in both species (data not shown).
All animals from both groups could be stimulated to swim by in- jection of tap water. At the start of the recovery phase individuals ofP.
maximuswere usually slightly opened confirmed by pilot scans that were obtained for positioning before runningin vivo31P-NMR spectra, Fig. 1.Anatomical MRI ofP. maximusshowing the adductor muscle and its division in the phasic and tonic muscle types (p, t). Note the differences in hemolymph supply of the two muscle types. The purple box is marking the volume used for localized31P-NMR spectroscopy. (For interpretation of the references to color in thisfigure legend, the reader is referred to the web ver- sion of this article.)
Fig. 2.Coronal view of a CSI overlaid on a corresponding anatomical MR image fromP. maximus. The phasic muscle is located in the center of the image. Note, the excellent mapping of PLA concentration with the phasic muscle, indicating consistent localization.
whereas some but not all individuals of the Arctic scallopC. islandica displayed a tight closure of the shells right after swimming perfor- mance.
Changes in metabolite signals during recovery after moderate ex- ercise are shown in a typical stack plot ofin vivo31P-NMR spectra forP.
maximus(Fig. 4). Moderate swimming markedly increased the Pi and decreased the PLA signal. During the following recovery phase, PLA signal intensity increased immediately, accompanied by a decreasing Pi signal until steady state values were reached. In contrast, adenylate signals remained unchanged during the entire experimental protocol.
No changes in the chemical shift of Pi signal could be observed within the resolution of the in vivo 31P-NMR data indicating insignificant changes in pHi during recovery. Interestingly, individuals ofC. islan- dica, that were tightly closed after swimming did not show any im- mediate PLA recovery. An increase of PLA rates wasfirst observed when shells opened again (see Supplement 1).
Recovery rates of normalized PLA signals after moderate swimming under control and OW conditions are presented inFig. 5for both spe- cies. The recovery rates were best described by mono-exponential curves. Comparison between control and warming conditions clearly revealed a delayed recovery of PLA in both warm-exposed specimens.
Additional exposure to ocean acidification had no further effect and
OWA-exposed scallops displayed a similar delay in recovery rates as observed for the OW-exposed scallops (data not shown). Significant changes in pHi could not be observed during recovery in any of the experimental groups and species.Table 2summarizes all determined variables from moderate swimming trails of all groups of both species including the results of thefit-analyses. The halftime of recovery (t1/2) was about 10 min for C. islandicaand about 18 min for P. maximus under control conditions. Interestingly, the halftime of recovery (t1/2) was about 2 to 3 times longer under OW and OWA (26–27 min inC.
islandica; and 37–55 min inP. maximus, respectively), leading to a si- milar delay in both species under these conditions. Accordingly, this led to smaller rate constants (kPLA) and a reduced maximum surplus oxi- dativeflux Qmax. However, due to the higher PLArestconcentration the maximum surplus oxidativeflux was higher inP. maximuscompared to C. islandica.
4. Discussion
Our study confirms the applicability of dynamic in vivo31P-NMR spectroscopy to study muscle bioenergetics in a marine invertebrate by investigating two scallop species,Pecten maximusandChlamys islandica.
Since cytosolic acidification can inhibit mitochondrial respiration to different extents as shown for diverse vertebrate muscle types [18], heavy exercise can produce a long-lasting cytosolic acidification due to the accumulation of octopine during recovery in scallops [9]. However, we could easily stimulate both scallop species to swimming and ob- served no changes in muscle pHi values afterwards, indicating no acidosis that might constrain oxidativeflux. A posterior acidification of pHi could be observed following fatigue exercise in our previous study, whereas a similar response as described here, was generated after a comparable (moderate) number of claps [15]. Therefore, a contribution of octopine formation and its degradation during the following recovery phase can be assumed as minimal and we conclude that the regenera- tion of PLA during recovery was attributed solely to the phosphoryla- tion of arginine with ATP, that was produced by oxidative phosphor- ylation in accordance to [9].
4.1. Confirmation with biochemical data
Present resting PLA concentrations match literature data reported for scallops including P. maximus [15,37]. Since the concentrations were determined in relation to assumed ATP concentrations extracted from the literature [37], our data also validate the estimated absolute ATP concentrations (see Materials and methods section, [38]). The quality,e.g.line width and signal to noise ratio of the non-localized31P- NMR spectra as well as the pHi values, are also comparable to literature values [15,39]. Both31P-NMR modalities, localized and non-localized spectroscopy, reliably provided estimates of kPLAand Qmaxas measures of excess aerobic ATP generation in the adductor muscle of scallops.
4.2. Anatomical MRI and localization
The size of the adductor muscle determined from the MRI sets were similar between individuals of one species, but was species-dependent.
The Iceland scallop,C. islandicahad smaller muscle volumes than the king scallop,P. maximuswhichfits to the smaller size ofC. islandica.
From the anatomical MR images, the two types of the adductor muscle, tonic and phasic muscle, were clearly distinguishable. These specific morphological differences were also seen in MRIs of other bivalves,e.g.
oysters [29]. Hemolymph-containing cavities that are displayed in the MR images indicate substantial differences in hemolymph supply be- tween the two muscle types. In agreement with literature [39], the tonic muscle is supplied by a network of tiny cavities surrounding the musclefiber packs, whereas the phasic muscle is only poorly vascu- larized by a few large lacunae. These morphological differences may indicate a better and more homogeneous hemolymph/oxygen supply to Fig. 3.Resting values of mean phospho-l-arginine (PLArest) concentrations de-
termined in the adductor muscle of two scallop species under different en- vironmental conditions, control, ocean warming (OW) and ocean warming &
acidification (OWA). (A)C. islandica(control (n = 7), OW (n= 7) and OWA (n = 3)); (B) P. maximus (control (n= 3), OW (n= 5) and OWA (n= 4)).
[PLArest] was highest in the control group for both scallop species. InP. max- imus [PLArest] declined with a significant linear trend resulting in lowered concentrations in both experimental groups compared to control scallops.
*Significantly different to data from the respective control group.
the more aerobic tonic muscle versus the more anaerobic operating phasic muscle supporting a more efficient and continuous energy supply [37].
The position and sensitive volume of the surface coil defines the volume of interest in dynamic31P NMR spectroscopy [40] and may result in partial volume effects. Our comparison of non-localized with localized31P-NMR spectroscopy inP. maximusrevealed no or only a marginal contribution of the31P-NMR signals from surrounding tissues.
This agrees with literaturefindings on PCr recovery rates determined in human calf muscle [40], where localized 31P-NMR spectroscopy was compared with the use of surface coils. As reflected in the MRIs and the corresponding PLA map (Fig. 2) our careful consideration of the posi- tion and the diameter of the surface coil relative to the muscle volume ensured the recording of the relevant high energy phosphate signals from the adductor muscle. Furthermore, the determined concentrations of PLA rest are in the range of PLA rest values (22.46 ± 6.51μmol/g wet muscle tissue) determined in the phasic muscle of the Bay scallop Argopecten irradians[20]. Despite of the relatively slow recovery rate of phosphagen in scallops compared to mammals the benefit of the much higher temporal resolution in non-localized than in localized dynamic
31P-NMR spectroscopy is still of advantage and allows a more reliable determination of maximum oxidativeflux from the mono-exponential fit.
4.3. Validation of the approach and comparison to mammalian studies Creatine phosphate restores adenylate levels [41], and the re- lationship between the capacity of creatine kinase to rebuild ATP and PCr recovery rates was confirmed by Paganini et al. [16]. We applied this approach to the muscle bioenergetics of scallops, that poses argi- nine kinase instead of creatine kinase. Indeed, and without exception, the time slope of PLA recovery displayed the expected form of a mono- exponential slope, irrespective of the experimental group and the two
species. Compared with mammalian studies the halftime of recovery (t1/2) after moderate exercise was much slower resulting in a more than a magnitude lower kPLAof 0.01–0.04 [1/min]vs. e.g.0.5–1 [1/min]
determined in mouse gastrocnemius muscle [16]. The differences are not surprising and can be explained by the different measurement temperatures (0/5 °C and 15/20 °Cvs.37 °C) and by the different rates of functioning and metabolism of the investigated tissue types. In contrast to terrestrial mammals the muscle of scallops operates in sea- water and i) needs to overcome a much higher viscosity and ii) relies on a 30 times lower environmental oxygen content. Furthermore, scallops have an open circulatory system without respiratory pigments such as hemoglobin and their adductor muscle is only poorly perfused when compared to vertebrate muscles. Since maximal exercise performance depends on perfusion and thus oxygen provision [e.g.[41]] restricted oxygen supply to scallop muscle will consequently limit the organism's muscle performance as well as its ability to recover from exercise. In addition, mitochondrial enzyme capacities are much lower in muscle tissue of scallops than in vertebrates (fish) when performing at similar temperatures [42]. Taken together, this corroborates ourfindings of an order of magnitude lower maximum surplus oxidativeflux in muscle tissue of a marine invertebrate.
4.4. Relation to climate-driven environmental changes
A recent comparison between various scallop species revealed a clear relationship between locomotor style and biochemical attributes of the adductor muscle showing PLA concentrations in relation to lifestyle activity, with highest PLA values at rest in very mobile scallops and lowest in a sessile species [38]. In the present study the dynamic
31P-NMR spectroscopy approach was tested on two scallop species, the boreal scallopP. maximusfrom the Atlantic and the arctic scallopC.
islandicafrom Greenland. Both species exhibit a similar moderate active swimming style in nature and levels of spontaneous activity during the Fig. 4.Stack plot ofin vivo31P-NMR spectra after moderate exercise ofP. maximusunder control conditions at 15 °C, showing the main high energy phosphates such as PLA and the three signals from ATP and the end product inorganic phosphate. After an initial increase of the inorganic phosphate (Pi) signal right after swimming a subsequent decrease of the signal accompanied by the recovery of the PLA signal is visible. See insert for a better visualization of the Pi signal. Changes in ATP signals did not occur (best visible forβ-ATP at 16 ppm).
incubation periods were similar in all groups. Furthermore, the swim- ming performance of scallops is acclimated to their specific natural temperature regime as shown previously [15]. Therefore, the observed differences between species rely most likely on size differences of the muscle volume and resting PLA concentration rather than life style or differences of their natural habitat, such as temperature. The observed reduction in resting PLA levels ofP. maximus andC. islandicaunder ocean warming (OW) and under the combination of ocean warming and acidification (OWA) was likely environmentally driven indicating that
scallops experienced changes in energy status under OW and OWA.
In mammals phosphagen (PCr) levels are highest when ATP levels are high and free ADP levels low [43]. Low resting PCr concentrations led to an extended recovery period after exercise [44]. Furthermore, O2
availability affects PCr recovery from submaximal exercise, in a way that under low oxygen availability recovery time was extended [45].
That this also holds true for PLA in scallops is supported by our ob- servation inC. islandicathat PLA recovery started not before the scal- lops opened the shell to improve oxygen availability and increase ventilation (see Supplementaryfigure).
In scallops PLA levels decrease with the number of claps and ani- mals stop swimming when PLA levels reach a low limiting concentra- tion in all investigated species [15]. An already lowered initial PLArest
level thus suggests impaired performance. Indeed, time to fatigue was longer inP. maximusswimming under normocapnic conditions at 10 °C than at 20 °C [25]. In addition to an earlier exhaustion, the time to recover from exhaustive swimming was extended in the warmth [25], which matches the decelerated recovery rate of PLA levels (kPLA) and reduced maximal surplus oxidativeflux rates (Qmax) in the muscle of warm exposed scallops. Our previousfindings of elevated energy de- mand and reduced hemolymph (blood) PO2 of P. maximus under warming [see [25]] corroborate our line of thought that the PLA re- sponse is similar to the PCr response emphasizing the prominent role of oxygen availability for phosphagen recovery [45,46].
In line with the concept of the aerobic power budget [[4], see Introduction] the observed reduction in maximum surplus oxidative flux (Qmax) after long-term OW and OWA incubation is mainly a con- sequence of lowered hemolymphPO2which reduces the aerobic power budget, indicating that P. maximusandC. islandicareached thermal constraints already with potential consequences for growth [26]. Si- milar resting intracellular pH values in control, OW and OWA exposed scallops indicate compensation of the OA-induced extracellular acidosis at the intracellular level [25]. The associated rise in the costs of ion and acid-base regulation may cause the progressively reduced PLArestlevels under OWA conditions, seen in P. maximus only and which were however not significantly different to PLArestlevels under OW.
5. Conclusion
In conclusion, dynamic31P-NMR spectroscopy performed on scal- lops after moderate exercise provides further insights into the me- chanisms underlying the limitations and effects of ocean warming and acidification on the bioenergetics of marine invertebrates. This ap- proach is easily transferable to other research topics in comparative physiology which involve tissue energetics of mollusks such as in gas- tropods or cephalopods. Our results support the applicability of the aerobic power budget concept by Guderley & Pörtner [4]. In a future ocean, particularly given the ocean warming, invertebrates like scallops with an active life style and little capacity for thermal metabolic Fig. 5.Time course comparison of PLA recovery rates under control and OW
conditions for (A)C. islandicaand for (B)P. maximus. PLA is normalized as the ratio (PLA/(PLA + Pi)) for better comparison. The lines present the bestfit from a mono exponential function. The dashed line presents the 95% confidence range from thefits. R2for the goodness offit (C.i: 0.32 (0 °C); 0.25 (5 °C) and for P.m: 0.93 (15 °C); 0.75 (20 °C)). A clearly delayed recovery rate was observed under warming in comparison to control conditions in both species.
Table 2
Summary of the results of the moderate swimming trials ofC. islandicaandP. maximus. PLAexvalues were extrapolated from the respective linefits.
Treatment Chlamys islandica Pecten maximus
0 °C 5 °C 15 °C 20 °C
Control OW OWA Control OW OWA
n 7 7 3 3 4 4
Claps 8 ± 3 9 ± 5 12 ± 7 33 ± 10 33 ± 12 30 ± 12
Pi/PLAex 0.21 ± 0.11 0.59 ± 0.32 0.79 ± 0.87 0.31 ± 0.30 0.78 ± 0.31 0.80 ± 0.49
PLAex 17.40 8.62 10.03 12.26 11.92 7.29
pHirest 7.51 ± 0.20 7.38 ± 0.06 7.27 (n= 2) 7.39 ± 0.09 7.46 ± 0.11 7.42 ± 0.06
pHiex 7.46 ± 0.03 7.39 ± 0.04 7.55 ± 0.56 7.44 ± 0.04 7.41 ± 0.03 7.37 ± 0.05
kPLA[1/min] 0.0698 ± 0.0285 0.0268 ± 0.0102 0.0254 ± 0.0074 0.0393 ± 0.0050 0.0127 ± 0.0027 0.0187 ± 0.0024 Qmax[mM ATP/min] 0.0114 ± 0.0027 0.0013 ± 0.0005 0.0020 ± 0.0008 0.0164 ± 0.0039 0.0078 ± 0.0004 0.0064 ± 0.0010
t1/2[min] 9.938 25.87 27.27 17.65 54.46 37.1
adjustments might be at risk. The climate-driven reduction in the re- sidual aerobic power budget and the associated impairment of muscle bioenergetics might force scallops to a less active lifestyle making them more susceptible to predation. This might even be more pronounced if food availability is restricted.
Supplementary data to this article can be found online athttps://
doi.org/10.1016/j.mri.2019.06.003.
Acknowledgements
We like to thank Anette Tillmann for help with animal maintenance and Rolf Wittig for his help with processing the31P-NMR data. This project was supported by the AWI PACES2 program and is a contribu- tion to the BMBF-funded project “Biological Impacts of Ocean Acidification”(BIOACID, FKZ 03F0608B).
References
[1] Pörtner HO. Ecosystem effects of ocean acidification in times of ocean warming: a physiologists view. Mar Ecol Prog Ser 2008;373:203–17.
[2] Seebacher F, White CR, Franklin CE. Physiological plasticity increases resilience of ectothermic animals to climate change. Nat Clim Change 2015;5:61–6.
[3] Contribution of working groups I, II and III to thefifth assessment report of the intergovernmental panel on climate change. In: Pachauri RK, Meyer LA, editors.
IPCC climate change 2014: synthesis report. Geneva, Switzerland: IPCC; 2014. p.
151.
[4] Guderley HE, Pörtner HO. Metabolic power budgeting and adaptive strategies in zoology: examples from scallops andfish. Can J Zool 2010;88:753–63.
[5] Sokolova IM, Frederich M, Bagwe R, Lannig G, Sukhotin AA. Energy homeostasis as an integrative tool for assessing limits of environmental stress tolerance in aquatic invertebrates. Mar Environ Res 2012;79:1–15.
[6] Pörtner HO, Farrell AP. Ecology. Physiology and climate change. Science 2008;322:690–2.
[7] Brand AR. Chapter 12 scallop ecology: distributions and behavior. Developments in Aquaculture and Fisheries Science 2006;35:651–744.
[8] Scallop cultivation in the UK: a guide to site selection.http://www.cefas.defra.gov.
uk/publications/files/scallop_cultivation.pdf; 2014, Accessed date: 21 August 2014.
[9] Livingstone DR, de Zwaan A, Thompson RJ. Aerobic metabolism, octopine pro- duction and phosphorarginine as sources of energy in the phasic and catch adductor muscles of the giant scallopPlactopecten magellanicusduring swimming and the subsequent recovery period. Comp Biochem Physiol B 1981;70:35–44.
[10] Grieshaber MK. Breakdown and formation of high-energy phosphates and octopine in the adductor muscle of the scallop,Chlamys opercularis(L.), during escape swimming and recovery. J Comp Physiol B 1978;126:269–76.
[11] Guderley HE, Rojas FM, Nusetti OA. Metabolic specialization of mitochondria from scallop phasic muscles. Mar Biol 1995;122:409–16.
[12] Moore E, Wilson DW. Nitrogenous extractives of scallop muscle: I. The isolation and a study of the structure of octopine. J Biol Chem 1937;119:573–84.
[13] Moon RB, Richards JH. Determination of intracellular pH by31P magnetic re- sonance. J Biol Chem 1973;248:7276–8.
[14] Jackson AE, de Freitas ASW, Hooper L, Mallet A, Walter JA. Phosphorus metabolism monitored by31P-NMR in juvenile sea scallop (Placopecten magellanicus) over- wintering in pearl nets at a Nova Scotian aquaculture site. Can J Fish Aquat Sci 1994;51:2105–14.
[15] Bailey DM, Peck LS, Bock C, Pörtner HO. High-energy phosphate metabolism during exercise and recovery in temperate and Antarctic scallops: anin vivo31P-NMR study. Physiol Biochem Zool 2003;76:622–33.
[16] Paganini AT, Foley JM, Meyer RA. Linear dependence of muscle phosphocreatine kinetics on oxidative capacity. Am J Physiol 1997;272:C501–10.
[17] Lanza IR, Bhagra S, Nair KS, Port JD. Measurement of human skeletal muscle oxi- dative capacity by31P-MR spectroscopy: a cross-validation within vitromeasure- ments. J Magn Reson Imaging 2011;34:1143–50.
[18] Layec G, Malucelli E, Le Fur Y, Manners D, Yashiro K, Testa C, et al. Effects of exercise-induced intracellular acidosis on the phosphocreatine recovery kinetics: a
31P MRS study in three muscle groups in humans. NMR Biomed 2013;26:1403–11.
[19] Graham RA, Ellington WR, Chih CP. A saturation transfer phosphorus nuclear magnetic resonance study of arginine phosphokinase in the muscle of marine mollusc. Biochim Biophys Acta 1986;887:157–63.
[20] Schmid AI, Schrauwen-Hinderling VB, Andreas M, Wolzt M, Moser E, Roden M.
Comparison of measuring energy metabolism by different31P-magnetic-resonance techniques in resting, ischemic, and exercising muscle. Magn Reson Med 2012;67:898–905.
[21] Pörtner HO. Climate change and temperature-dependent biogeography: oxygen limitation of thermal tolerance in animals. Naturwissenschaften 2001;88:137–46.
[22] Pilditch CA, Grant J. Effect of temperaturefluctuations and food supply on the growth and metabolism of juvenile sea scallops (Placopecten magellanicus). Mar Biol 1999;134:235–48.
[23] Peck LS, Pörtner HO, Hardewig I. Metabolic demand, oxygen supply, and critical temperatures in the Antarctic bivalveLaternula elliptica. Physiol Biochem Zool 2002;75:123–33.
[24] Lannig G, Flores JF, Sokolova IM. Temperature-dependent stress response in oy- sters,Crassostrea virginica: pollution reduces temperature tolerance in oysters.
Aquat Toxicol 2006;79:278–87.
[25] Schalkhausser B, Bock C, Pörtner HO, Lannig G. Escape performance of temperate king scallop,Pecten maximusunder ocean warming and acidification. Mar Biol 2014;161:2819–29.
[26] Blicher ME, Rysgaard S, Sejr MK. Seasonal growth variation inChlamys islandica (Bivalvia) from sub-Arctic Greenland is linked to food availability and temperature.
Mar Ecol Prog Ser 2010;407:71–86.
[27] Bock C, Satoris FJ, Pörtner HO.In vivoMR spectroscopy and MR imaging on non- anaesthetized marinefish: techniques andfirst results. J Magn Reson Imaging 2002;20:165–72.
[28] Schalkhausser B. Physiological effects of ocean warming and acidification on pec- tinid bivalves PhD Thesis Bremen: University of Bremen; 2015.
[29] Schalkhausser B, Bock C, Stemmer K, Brey T, Pörtner HO, Lannig G. Impact of ocean acidification on escape performance of the king scallop,Pecten maximus, from Norway. Mar Biol 2013;160:1995–2006.
[30] Lannig G, Cherkasov AS, Pörtner H O, Bock C, Sokolova IM. Cadmium-dependent oxygen limitation affects temperature tolerance in eastern oysters (Crassostrea vir- ginica Gmelin). Am J Physiol Regul Integr Comp Physiol 20008; 294:R1338-R1346.
[31] Ziegler A, Knuth M, Mueller S, Bock C, Pohmann R, Schröder L, et al. Application of magnetic resonance imaging in zoology. Zoomorphology 2011;130:227–54.
[32] Ordidge RJ, Connelly A, Lohman JAB. Image-selectedin vivospectroscopy (ISIS). A new technique for spatially selective nmr spectroscopy. J Magn Reson
1969;66:283–94.
[33] Guilfoyle DN, Mansfield P. Chemical-shift imaging. Magn Reson Med 1985;2:479–89.
[34] Bock C, Sartoris FJ, Wittig RM, Pörtner HO. Temperature dependent pH regulation in stenothermal Antarctic and eurythermal temperate eelpout (Zoarcidae): anin vivo NMR study. Polar Biol 2001;24:869–74.
[35] Kost GJ. pH standardization for phosphorus-31 magnetic resonance heart spectro- scopy at different temperatures. Magn Reson Med 1990;14:496–506.
[36] Pörtner HO, Bock C, Reibschläger A. Modulation of the cost of pHi regulation during metabolic depression: a31P-NMR study in invertebrate (Sipunculus nudus) isolated muscle. J Exp Biol 2000;203:2417–28.
[37] Pérez HM, Brokordt KB, Martínez G, Guderley HE. Locomotion versus spawning:
escape responses during and after spawning in the scallopArgopecten purpuratus.
Mar Biol 2009;156:1585–93.
[38] Tremblay I, Guderley HE. Scallops show that muscle metabolic capacities reflect locomotor style and morphology. Physiol Biochem Zool 2014;87:231–44.
[39] Hallman TM, Rojas-Vargas AC, Jones DR, Richards JG. Differential recovery from exercise and hypoxia exposure measured using31P- and1H-NMR in white muscle of the common carpCyprinus carpio. J Exp Biol 2008;211:3237–48.
[40] Meyerspeer M, Robinson S, Nabuurs CI, Scheenen T, Schoisengeier A, Unger E, et al.
Comparing localized and nonlocalized dynamic31P magnetic resonance spectro- scopy in exercising muscle at 7T. Magn Reson Med 2012;68:1713–23.
[41] Meyer RA. Linear dependence of muscle phosphocreatine kinetics on total creatine content. Am J Physiol 1989;257:C1149–57.
[42] Guderley HE. Locomotor performance and muscle metabolic capacities: impact of temperature and energetic status. Comp Biochem Physiol B Biochem Mol Biol 2004;139:371–82.
[43] Smith RN, Agharkar AS, Gonzales EB. A review of creatine supplementation in age- related diseases: more than a supplement for athletes. F1000Research 2014;3:222.
[44] Francescato MP, Cettolo V, di Prampero PE. Influence of phosphagen concentration on phosphocreatine breakdown kinetics. Data from human gastrocnemius muscle. J Appl Physiol (1985) 2008;105:158–64.
[45] Haseler LJ, Hogan MC, Richardson RS. Skeletal muscle phosphocreatine recovery in exercise-trained humans is dependent on O2availability. J Appl Physiol 1999;86:2013–8.
[46] Lannig G, Storch D, Pörtner HO. Aerobic mitochondrial capacities in Antarctic and temperate eelpout (Zoarcidae) subjected to warm versus cold acclimation. Polar Biol 2005;28:575–84.