Characterization of Sirt2 using conditional RNAi in mice
Inaugural-Dissertation zur
Erlangung des Doktorgrades
der Mathematisch-Naturwissenschaftlichen Fakultät der Universität zu Köln
vorgelegt von Martina Reiss aus Friedrichshafen
Köln 2011
Berichterstatter: Prof. Dr. Jens C. Brüning Prof. Dr. Peter Kloppenburg
Tag der mündlichen Prüfung: 11.01.2011
“Enjoying with your science is that it never stops being exciting.”
- Oliver Smithies, 2007 Nobel Laureates in Medicine
Table of contents
Table of contents...4
Figure index...7
Table index...8
Abbreviations ...9
1 Introduction ...12
1.1 RNA interference ... 12
1.2 shRNA/siRNA based RNAi in mammalian cells ... 14
1.3 RNAi in transgenic animals ... 15
1.3.1 Tissue specific RNAi in transgenes using the Cre/loxP system ...16
1.3.2 Inducible RNAi in transgenes using the tet-system...17
1.4 Tissue specific and inducible RNAi in mice... 18
1.5 The mammalian sirtuins... 18
1.6 Regulatory functions of the sirtuins... 21
1.6.1 Sirt1...21
1.6.2 Sirt2...22
1.6.3 Sirt3, 4 and 5 ...23
1.6.4 Sirt6 and Sirt7 ...24
1.7 Objectives ... 25
2 Material and Methods ...26
2.1 Chemicals ... 26
2.2 Molecular biology... 28
2.2.1 Cloning of promoter fragments or genes ...28
2.2.2 Cloning plasmid constructs 1, 2 and 6 ...28
2.2.3 Cloning plasmid constructs 3, 4, 5 and 7 ...31
2.2.4 Isolation of Genomic DNA ...34
2.2.5 Polymerase Chain Reaction (PCR) ...34
2.2.6 Southern Blot ...36
2.2.7 RNA Extraction and Quantitative Realtime-PCR (qPCR) ...37
2.2.8 DNA sequencing...38
Table of contents
2.2.9 Quantification of DNA and RNA ...39
2.2.10 Protein extraction ...39
2.2.11 Western Blot ...39
2.2.12 Enzyme-linked Immunosorbent Assay (ELISA) ...40
2.3 Histological analysis... 40
2.4 Cell culture ... 40
2.4.1 Embryonic stem cell lines...41
2.4.2 Embryonic stem cell culture ...42
2.4.3 Transfection of ES cells with the exchange vector ...42
2.4.4 Doxycycline (dox) treatment of ES cells ...43
2.4.5 Analysis of doxycyline content in mouse serum ...43
2.4.6 ß-Galactosidase assay ...43
2.5 Mouse experiments ... 44
2.5.1 Animal care ...44
2.5.2 Mice ...45
2.5.3 Body weight, blood collection and blood glucose levels...45
2.5.4 Glucose and insulin tolerance test...46
2.5.5 Food intake and indirect calorimetry ...46
2.5.6 Behavioral analysis ...46
2.5.7 MPTP treatment ...47
3 Results...48
3.1 Generation of Cre-mediated spatially and temporally regulated shRNA expression system... 48
3.1.1 The effect of a single loxP site on promoter activity in vitro ...48
3.1.2 Spatially and temporally activated RNAi of LacZ in mice by the hybrid Pol III system ...53
3.1.3 Spatially and temporally activated RNAi of Sirt2 in mice by the hybrid Pol III system ...56
3.2 Phenotypical analysis of inducible Sirt2-knockdown mice ... 58
3.2.1 Knockdown efficiency demonstrated by two individual shRNAs against Sirt2...58
3.2.2 The effect of Sirt2 knockdown on energy homeostasis control...62
3.2.3 Effect of Sirt2 knockdown focused on glucose metabolism...64
3.2.4 The effect of Sirt2 knockdown during embryogenesis ...70
3.2.5 The effect of Sirt2 knockdown in neurodegenerative disease ...72
4 Discussion ...75
4.1 Spatially and temporally controlled RNAi ... 75
4.2. Phenotypical analysis of Sirt2 knockdown in mice ... 77
4.2.2 The role of Sirt2 knockdown during embryogenesis ...78
4.2.2 The effect of Sirt2 knockdown on glucose and energy homeostasis ...79
4.2.3 Effect of Sirt2 knockdown in a mouse model of Parkinson Disease ...81
5 Summary ...84
6 Zusammenfassung...85
7 References ...87
8 Acknowledgements ...100
9 Erklärung...101
10 Curriculum vitae...102
Figure index
Figure index
Figure 1: The small-interfering RNA (siRNA) pathway ... 14
Figure 2: Deacetylation and ADP-ribosylation activity by mammalian sirtuins ... 20
Figure 3: Overview of Infusion cloning method... 32
Figure 4: Schematic overview of promoter configurations after Cre-mediated recombination 49 Figure 5: Analysis of seven configurations at the rosa26 locus in mouse ES cells... 52
Figure 6: Schematic overview illustrating the activation of H1/U6 hybrid mediated gene silencing (A) and its analysis in vivo (B, C)... 55
Figure 7: Knockdown level of Sirt2 in vitro and in vivo using the inducible hybrid H1/U6 system ... 58
Figure 8: Two specific shRNAs against Sirt2 results each to an efficient Sirt2 knockdown in vivo... 59
Figure 9: Sirt2 knockdown in mice exposed to a NCD or HFD ... 61
Figure 10: Knockdown of Sirt2 does not affect metabolic control on normal diet ... 63
Figure 11: Knockdown of Sirt2 does not affect metabolic control on high fat diet ... 64
Figure 12: Unchanged glucose metabolism in Sirt2 knockdown mice on normal diet ... 66
Figure 13: Unchanged glucose metabolism and energy balance in Sirt2 knockdown mice on high fat diet ... 67
Figure 14: Effect of Sirt2 KD on adipocyte size and PPARγ mRNA expression in EWAT... 69
Figure 15: Sirt1 mRNA expression in Sirt2 knockdown animals fed on HFD ... 70
Figure 16: Possible role of Sirt2 in regulatory networks controlling embryonic processes ... 71
Figure 17: Rotarod analysis and knockdown efficiency of Sirt2 knockdown and wt control
mice treated either with MPTP or saline... 74
Table index
Table 1: Main characteristics of mammalian situins ... 21
Table 2: Chemicals ... 27
Table 3: Fusion PCR-synthetic1.1, -synthetic2.1 and –synthetic6.1 ... 30
Table 4: Primers used for fusion PCR-synthetic1.1, -synthetic2.1 and -synthetic6.1 ... 31
Table 5: Primers used for cloning of construct 3, 4, 5 and 7 ... 34
Table 6: Primers used for genotyping... 35
Table 7: Probes for Southern Blot generated by digestion of vector DNA ... 36
Table 8: Probes for Southern Blot generated by PCR ... 37
Table 9: Real-Time analysis probes... 38
Table 10: Custom Real-Time analysis probes ... 38
Table 11: Custom Real-Time analysis probes for small RNA ... 38
Table 12: Antibodies used for western blot analysis ... 40
Table 13: Embryonic stem cell lines at TaconicArtemis GmbH ... 41
Table 14: Animal food ... 45
Abbreviations
Abbreviations
°C degrees Celsius
µ micro
3’ three prime end of DNA sequences 5’ five prime end of DNA sequences
A adenosine
AceCS2 acetyl coenzyme A synthetase 2 ADP adenosine diphosphate
ADPR ADP ribose AKT proteinkinase B
as antisense
ATP adenosine triphosphate
C cytosine
Caggs chicken β-actin-promoter with CMV enhancer cDNA complementary DNA
CMV cytomegalovirus CNS central nervous system
CPS1 carbomyl phosphate synthetase 1 CR caloric restriction
Cre site specific recombinase from phage P1 (causes recombination) Ct cycle treshold
Da Dalton
ddH
2O double destilled water DMSO dimethylsulfoxide DNA desoxyribonucleic acid DNase desoxyribonuclease
dNTP desoxyribonucleotide-triphosphate
Dox doxycycline
DSE distal sequence element dsRNA double stranded RNA DTT Dithiothreitol
E.coli Escherichia coli e.g. exempli gratia
ECL enhanced chemiluminescence EDTA ethylendiamine tetraacetate
ELISA enzyme-linked immunosorbent assay EtBr ethidium bromide
EtOH ethanol
EWAT epigonadal white adipose tissue floxed loxP flanked
Flp flippase
Fluc firefly luciferase
FOXO1 forkhead-O transcription factor 1
FRT flip-recombinase targets
g gram
G guanine
G418 geneticin
GAPDH glycerinaldehyd-3-phosphate dehydrogenase GDH glutamate dehydrogenase
GTT glucose tolerance test
h hour
H&E hematoxylin/eosin HCl hydrochloric acid HDAC histone deacetylase
HEPES N-2-hydroxyethylpiperazine-N’-2-ethansulfonic acid HFD high-fat diet
Hp1bp3 heterochromatin protein1 binding protein3 Hygro hygromycin
Hz Hertz
i.p. intraperitoneal IR insulin receptor
itetR codon optimized version of tetR ITT insulin tolerance test
k kilo
kb kilobase pairs KCl potassium chloride kDa kilodalton
l liter
lacZ gene encoding the enzyme beta-galactosidase
loxP recognition sequence for Cre (locus of x-ing over phage P1)
m milli
M molar
mES cells mouse embryonic stem cells MgCl
2magnesium chloride
min minute
miRNA micro RNA
mRNA messenger RNA NaCl sodium chloride
NAD nicotinamide adenine dinucleotide
NADH nicotinamide adenine dinucleotide reduced NAM nicotinamide
NaOH sodium hydroxide NCD normal chow diet
Neo neomycin
NMR nuclear magnetic resonance
Nt nucleotide
OD optical density ORF open reading frame
PAGE polyacrylamid gel electrophoresis
pAhGH human growth hormone poly adenylation
Abbreviations
PB phosphate buffer
PBS phosphate buffered saline PCR polymerase chain reaction PGC-1α PPARγ coactivator-1 PGK phosphoglycerate kinase PIE promoter inhibitory element Pol III RNA polymerase III
PPARγ peroxisome proliferator-activated receptor gamma PSE proximal sequence element
Puro puromycin
qRT-PCR quantitative realtime PCR rDNA ribosomal DNA
RISC recombinase mediated cassette exchange Rluc renilla luciferase
RMCE recombinase mediated cassette exchange RNA ribonucleic acid
RNAi RNA interference RNAi RNA interference RNAi RNA interference RNase ribonuclease RT room temperature
rtTA reverse tetracycline transactivator
s sense
SDS sodiumdodecylsulfate
sec second
SEM standard error of the mean
SGK1 serum- and glucocorticoid regulated kinase 1 shRNA short hairpin RNA
siRNA short interfering RNA
SNP single nucleotide polymorphism T3 triiodothyronine
TAE Tris-acetic acid-EDTA buffer TBS Tris buffered saline
tetO tetracycline operator tetR tetracycline repressor
Tris 2-amino-2-(hydroxymethyl-)1,3-propandiole tTA tetracycline transactivator
U units
UTR un-translated region
V Volt
v/v volume per volume VO
2volume of oxygen VP viral protein w/v weight per volume
Zsgreen Zoanthus sp. green fluorescent protein
1 Introduction
1.1 RNA interference
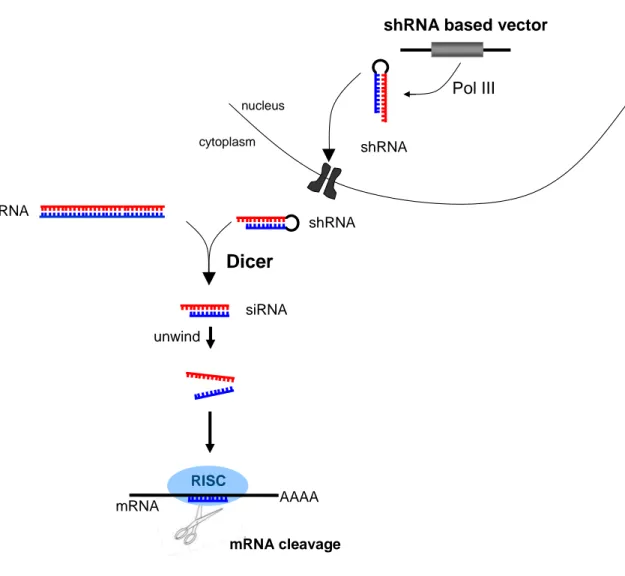
RNA interference (RNAi) is a cellular mechanism to regulate gene expression by sequence-specific posttranscriptional gene silencing. First described in 1998 by Fire and Mello in the invertebrate nematode Caenorhabditis elegans (1), RNAi became more attention and it has since been studied in a wide range of eukaryotic organisms such as fungi, flies, plants and mammals (2). Originally, RNAi had probably evolved to an important defence mechanism in many organisms against viruses, inverted repeat transgenes, or transposable elements that include a double strand RNA (dsRNA) step in their replication cycle (3). When present within a cell, dsRNAs are recognized by the ribonuclease called Dicer and are further converted into smaller dsRNA molecules of 21 base pairs with a 2-nucleotide 3´-overhangs (4). These molecules are called short interfering RNAs (siRNAs) that direct RNAi (5-8). SiRNAs are then shuttled into an RNAi-specific protein complex to form the RNA-induced silencing complex (RISC) (Figure 1). This ribonucleoprotein complex might undergo activation in the presence of ATP so that the antisense component of the unwound siRNA becomes exposed and paired with the cognate mRNA (9, 10). Subsequently, the RISC complex recognize and cleaves homologous mRNA endonucleolytically, thereby decreasing the production of the corresponding protein (11, 12). Thus, any mRNA bearing a homologous sequence with an appropriate siRNA is degraded and its expression is knocked down to 10-40 % of its normal levels (13). The assembly of RISC is asymmetrical with a clear strand bias (14), meaning that only one strand of the duplex is preferentially loaded (15) while the other strand will be destroyed. The strand whose 5´end has lower internal stability is preferentially incorporated into RISC. Thus, antisense (guide) strand of chemically synthesized siRNAs should have lower internal stability of its 5´end and is an important parameter for siRNA design. This is further supported by Reynolds and colleagues, who found few sequence specific characteristics (16).
Most of the rules for siRNA design were implemented in various software programs, whereas
many of them incorporate the original Tuschl algorithm. Studies have revealed that siRNA
specificity is not as stringent since pairing between the hexamer seed region of a siRNA guide
strand (nucleotides 2-7) and complementary sequences in the 3´UTR of mature transcripts has
Introduction
been implicated in off-target gene regulation and false positive phenotypes (17-19). In a minority of siRNA based experiments, unspecific effects due to immune stimulation or saturation of the RNAi machinery have been described (20, 21). Appropriate control experiments, such as transfection of different siRNAs directed against the target mRNA may anticipate off-target effects.
As longer dsRNAs provoke an interferon response in mammalian cells, leading to non-
specific mRNA degradation and global inhibition of protein translation rather than the desired
specific knockdown, the technology was initially restricted to organisms showing no interferon
response, such as Caenorhabditis elegans and Drosophila melanogaster (5, 22). However,
dsRNAs shorter than 30 bp were shown to circumvent interferon response in mammalian cells
(5). Since efficient knockdown in transfected mammalian cells were first described with in
vitro synthesized siRNAs (5, 6), RNAi techniques have become widely used an experimental
tool to define the functional roles of individual genes, particularly in disease.
RISC
shRNA based vector
Pol III
shRNA
Dicer
mRNA AAAA
mRNA cleavage nucleus
cytoplasm
dsRNA
shRNA
siRNA unwind
Figure 1: The small-interfering RNA (siRNA) pathway
DsRNAs or vector based shRNAs are processed into siRNAs by the ribonuclease called Dicer (4). SiRNAs are incorporated in the RNA-induced silencing complex (RISC) and ATP-dependent unwinding of siRNAs activates RISC (10). Active RISC is thus guided to degrade the specific target mRNAs (11, 12).
(abbreviations: dsRNA=double stranded RNA; shRNA=short hairpin RNA; siRNA=short interfering RNA;
RISC=RNA induced silencing complex; mRNA=messenger RNA)
1.2 shRNA/siRNA based RNAi in mammalian cells
In mammalian cells, RNAi can be induced artificially by introducing chemically
synthesized siRNAs (5). The design of effective siRNAs can be supported by several
algorithms available (16, 23-25). Although siRNAs are easy to produce and their effects are
transient in actively replicating cells, the duration of silencing is dependent of rate on cell
division that can be 3-7 days in proliferating cells, but can persist for 3 weeks and more in
Introduction
terminally differentiated cells, such as neurons (26). Subsequently, several large-scale RNAi screens have been conducted in mammalian tissue culture cells using synthetic siRNAs (27).
These screens have identified genes involved in apoptosis, signalling, regulation of protein stability and the ultraviolet radiation damage response. On the other hand, RNAi based screening in mammalian cells have been limited to easily transfectable, rapidly dividing adherent cell types (28).
An alternative provides the expression of short hairpin RNAs (shRNAs) (29-31) resulting in intracellular production of siRNA molecules by recruiting the endogenous processing machinery (32, 33). While transient transfection is advantageous for fast analysis of shRNA mediated effects, stable transfection ensures long-term, reproducible as well as defined shRNA effects. ShRNA expression vectors have been engineered using both viral (including retroviral (34), adenoviral (35, 36) and lentiviral (37) vectors), and plasmid systems (32, 38, 39). Plasmids containing RNA polymerase III (pol III) dependent promoters, like those of the U6 and H1 genes are perfectly suited to produce double-stranded short hairpin RNAs (shRNAs) that are processed into siRNAs inside the cell (28) (Figure 1). The localization of the regulatory sequences immediately upstream of the Pol III transcription start site ensures expression of exact shRNA sequences without additional or unwanted nucleotides, a critical requirement for precise siRNA function (40). Promoters of this type are preferred as they naturally direct the synthesis small RNA transcripts with defined termination sequences consisting of 4–5 thymidines (the termination signal for RNA polymerase III) and have no requirement for downstream promoter elements (41-43). Further, pol III dependent promoters are constitutively expressed in all cell types and display a high level of activity (43). To increase their utility for cell culture studies, vectors that mediate inducible pol III dependent expression of siRNAs were developed (44-46).
1.3 RNAi in transgenic animals
Transgenic RNAi finds tremendous applicability in the creation of in vivo animal
models mimicking gene knockout animals (47). The major advantage of shRNA transgenes is
that they do not have to be bred into homozygosity to see the knockout effect as they behave
like dominant-negative alleles (40). In addition, transgenic RNAi is less time consuming in
generation. The effect of RNAi in different cell types of mice have been demonstrated through injection of shRNA expression vectors into the tail vain (48, 49). Moreover, gene knockdown in multiple tissues of mice or rats can be achieved by random transgenesis including random ES cell transfection, pronucleus injection or lentiviral transduction (50-55). Since random transgenesis in these experiments demonstrated various shRNA expression patterns in each individual mouse line, predicted RNAi from a defined genomic locus has been shown efficiently and applicable (56).
However, vector mediated RNAi has limited germline transmission to only those shRNAs targeting genes whose knockdown is compatible with viability and fertility
.Therefore, conditional RNAi approaches are an appropriate tool for the elucidation of gene function at varied levels of gene expression and generation of mice with mild phenotypes when gene knock-out is fatal. Today, shRNA expression can be either activated by temporal control (e.g.
the tet-inducible systems) or in a tissue specific manner (e.g. the Cre/loxP system).
1.3.1 Tissue specific RNAi in transgenes using the Cre/loxP system
A number of important biological questions can be addressed simply by a knockdown
of a gene of interest at a given tissue in the adult mouse. The Cre/loxP recombination system
allows for this type of control and implicates a Cre recombinase derived from bacteriophage P1
and two 34 bp loxP (locus of crossover (x) in P1) sites (include two 13 bp palindrome
sequences separated by a spacer fragment of 8 bp), recognized by Cre (57). Cre-mediated
catalysis results in a reciprocal recombination between the two similarly oriented loxP sites,
followed by an excision of the DNA segment between the loxP sites leaving a single loxP site
behind. In contrast, recombination between inverted loxP sites causes inversion of the
sequence placed between them. The U6 promoter is preferably used for the Cre/loxP based
RNAi systems and consists of three tightly spaced elements. Distal and proximal sequence
elements (DSE and PSE) are 5´ of the TATA box that is located 26 bases downstream from
transcriptions initiation. Several groups have developed strategies to activate RNAi upon Cre-
excision (58-64). Tissue specific control of shRNA expression can be achieved by insertion of
a loxP flanked stop cassette close to the TATA box of the pol III dependent promoter, thereby
blocking transcription. Excision of the stop cassette through Cre mediated recombination
Introduction
results in gene silencing in a given tissue (61, 63, 65). In another approach, the loxP flanked stop cassette was placed between the DSE and PSE regulatory elements of the U6 promoter.
Since a single loxP site in the same position does not interfere with transcription, the system allows controllable RNAi through Cre mediated recombination of the stop cassette. A further strategy employed a loxP flanked stop cassette that is embedded in the loop of the shRNA (60- 62). Upon Cre recombination, the single loxP site is part of shRNA transcript. A loss of RNAi potency has not been observed (61).
The Cre/loxP system has also been applied for temporal control of shRNA expression.
Cre recombinase activity was regulated by using a tamoxifen controllable Cre-ER fusion protein (66-68). However, Cre mediated excision of a DNA fragment is a one-time and irreversible event thereby reducing its usefulness for many applications.
1.3.2 Inducible RNAi in transgenes using the tet-system
A well-defined regulatory system of Escherichia coli (E.coli) is the tet operon that can be used to direct temporal control of shRNA expression and inducible gene silencing (45, 69).
The tet inducible based system uses the transposon 10 (Tn10) specified tetracycline-resistance
(tet) operon of E. coli (70). Activity of the tet operon is regulated by the tet repressor (tetR)
which binds to a DNA sequence termed an operator (tetO) in the absence of tetracycline,
resulting in transcriptional repression. Tet inducible RNAi vectors have been created by
inserting a tetO sequence in the pol III promoter between the TATA box and the transcription
start without altering the position of the promoter elements relative to each other or with
respect to the transcription start site (45, 69, 71). In the absence of the inducer doxycycline, the
tetR binds on the tetO thereby sterically hinders binding of polymerase III to the modified H1
promoter whereas shRNA expression is “off”. Upon addition of dox which binds to the tetR,
the tetR undergoes a conformational change that results in reduced binding to the tetO with a
subsequent activation in shRNA production (72). Several approaches have been performed to
apply this strategy for the temporary control of antisense or shRNA expression in cultured cell
lines (44, 45, 71, 73) as well as in mice and rat (69, 74, 75). One main drawback of this system
is the leaky expression in vivo in the un-induced state, which can be diminished by using of a
codon optimized version of the tetR (itetR) (45, 69, 76).
First approaches implying the tet inducible shRNA expression system were performed on mouse xenograft tumormodels. Immunocompromised mice harboring the tet inducible RNAi system and implanted tumor cells, developed tumor growth as normal in the absence of dox and repressed promoter. As demonstrated on several studies, dox treatment initiated silencing of pro-cancerous genes that yielded in tumor regression. Thus, tet inducible RNAi served as a valuable tool for loss-of-function screens of genes, required for the proliferation and survival of cancer cells (77).
1.4 Tissue specific and inducible RNAi in mice
The temporal and spatial control of gene inactivation avoids embryonic lethality and permits to dissect gene function at high precision. However, these unique approaches do not fully exploit the major experimental advantage of RNAi: in principle, its effects can be simultaneously: tissue specific and inducible. In the following three concepts, different principles have been demonstrated for a transgenic RNAi technology that can be used for spatially, temporally and reversible regulated gene expression of any target gene. Yu and McMahon developed a strategy for Cre-mediated activation of shRNA transcription in mouse ES cells (68). In addition, these cells contained a Cre-ER fusion transgene whose recombinase activity was controlled by the inductor 4OH-tamoxifen. The system has been shown to be applicable in vitro as well as in chimeric embryos (68). In the approach of Dickens and his colleagues (78), transgenic mice with a tet-regulatable shRNA expression cassette were generated and crossed with a transgenic tet transactivator mouse line. These double-transgenic mice produced shRNAs in a tissue specific manner that can be regulated by doxycycline (78).
A new strategy developed and focused within this work relied on the use of site-specific recombination by the Cre/loxP technology according to inducible shRNA transcription by the tetO/tetR system.
1.5 The mammalian sirtuins
The founding member of the sirtuin family of histone deacetylases (HDACs) was the
silent information regulator 2 (Sir2) of the budding yeast Saccharomyces cerevisiae (79). In
Introduction
yeast, Sir2 has been shown to mediate the effects of calorie restriction on the extension of life
span, thus longevity is promoted by high levels of Sir2 activity (80, 81). In mammals, seven
sirtuins (Sirt1-7) have been identified, each of them sharing a conserved 275-amino-acid
catalytic core domain. Like their yeast homologs, the mammalian sirtuins (Sirt1-7) are class III
HDACs and require nicotinamide adenine dinucleotide (NAD
+) as a cofactor (82) to
deacetylate substrates ranging from histones to transcriptional regulators (83). The
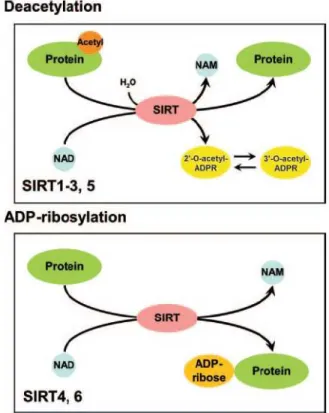
deacetylating enzymatic activity of sirtuins uses NAD
+as a catalyst to transfer the acetyl group
from proteins and peptides to the ADP-ribose (ADPR) moiety of NAD
+, yielding the acetyl
ester metabolites 2’-O- and 3´-O-acetyl-ADP-ribose (AADPR), nicotinamide (NAM) and the
deacetylated protein (Figure 2). The nicotinamide ribosyl bond is cleaved and one net water
molecule is added to nicotinamide ribose, a reaction unique to sirtuins (84). The deacetylation
activity of the sirtuins is controlled by the cellular [NAD
+]/[NADH] ratio and thus differs from
other HDACs. NAD
+thereby activates whereas nicotinamide and reduced nicotinamide
adenine dinucleotide (NADH) inhibits the deacetylation process (85-89). Thus, depending on
cellular [NAD
+]/[NADH] ratios and NAM levels, sirtuins may facilitate the conversion of
nutritional status into modulation of gene and protein function, leading ultimatively to changes
in cellular function (90). Two Sirtuins, Sirt4 and Sirt6 possess NAD
+-dependent ADP-ribosyl
transferase activity (Figure 2), the biological significance of which is less well understood (91-
93). In addition, Sirt2 and Sirt6 have been shown to perform both the ADP-ribosyl transferase
and deacetylation activity (93, 94).
Figure 2: Deacetylation and ADP-ribosylation activity by mammalian sirtuins
Sirtuins are NAD+-dependent deacetylases and mono-ADP-ribosyl transferases. Sirt1-3 and Sirt5 catalyze a deacetylation reaction by transferring the acetyl lysine residues of the target protein to the ADP-ribose (ADPR) moiety of NAD+ which generates the byproducts 2’-O- and 3´-O-acetyl-ADP-ribose (AADPR), nicotinamide (NAM) and the deacetylated protein (95-97). Sirt4 and Sirt6 possess ADP-ribosyl transferase activity (91, 92, 94).
The Figure is taken from (98).
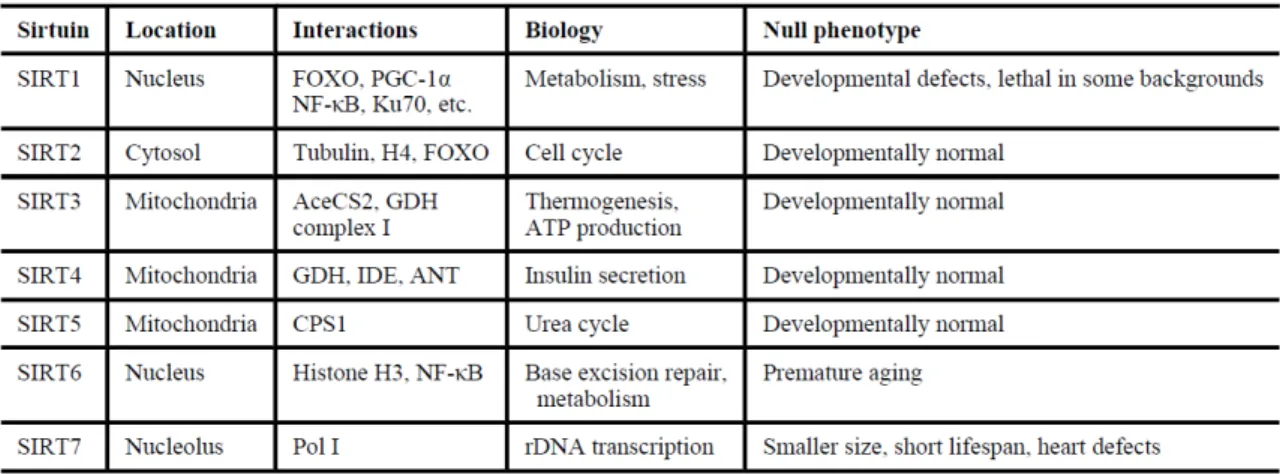
Mammalian sirtuins are found in numerous compartments within the cell (Table 1). Sirt1, Sirt6 and Sirt7 are found predominantly in the nucleus (82, 83, 99); Sirt3, Sirt4 and Sirt5 (79, 99, 100) are located in mitochondria and Sirt2 resides predominantly in the cytoplasm (79, 101).
However, Sirt1 and Sirt2 were found to shuttle between the nucleus and the cytoplasm and to
interact with both nuclear and cytosolic proteins (102, 103).
Introduction
Table 1: Main characteristics of mammalian sirtuins
Abbreviations: AceCS2, acetyl-CoA-synthetase2; ANT, adenide nucleotide translocator; CPS1, carbamoyl phosphate synthetase 1; FOXO, forkhead box, subgroup O; GDH, glutamate dehydrogenase; IDE, insulin degrading enzyme; NF-ĸB, nuclear factor kappa B; PGC-1α, peroxisome proliferator-activated receptor gamma coactivator 1 alpha; Pol I, DNA polymerase I; rDNA, recombinant DNA. The table is taken from (104).
1.6 Regulatory functions of the sirtuins 1.6.1 Sirt1
The best characterized family member of the sirtuin family in terms of its endogenous function and activity is Sirt1. Sirt1 has been linked to the control of metabolic processes in adipose tissue, liver and muscle through the regulation of the nuclear receptor peroxisome- proliferator activated receptor-γ (PPAR γ) and its transcriptional co-activator PPARγ co- activator-1α (PGC-1α) (105-108). A specific knockdown of Sirt1 in liver leads to decreased expression of gluconeogenic genes and glucose output (109, 110). These mice demonstrate mild hypoglycemia, increased systemic glucose as well as elevated insulin sensitivity due to the because of decreased glucose production. In pancreatic β-cells, Sirt1 is known to positively regulate glucose stimulated insulin secretion (111, 112), whereas it is able to modulate the expression (113) and secretion (114) of adiponectin, a hormone that enhances insulin sensivity from adipocytes. Further non-histone substrates are the tumor suppressor p53, the FOXO family of forkhead box transcription factors and NF-ĸB transcription factors, which are involved in the regulation of cell survival, proliferation and stress response (106, 115-117).
Sirt1 has also been linked to the survival of neurons. The survival of cultured neuronal cells
can be promoted by Sirt1, probably through deacetylation-mediated downregulation of the pro- apoptotic factors p53 (115, 118) and FOXO (116, 119). Overexpression of Sirt1 and the addition of the Sirt1 agonist resveratrol reduced NF-ĸB signalling in β-amyloid-induced death of microglia (120). Finally, Sirt1 null mice were shown to result in metabolically inefficient animals that failed to adapt to caloric restriction (CR) conditions, suggesting that Sirt1 is required for response to CR (121).
1.6.2 Sirt2
Compared to the Sirt1, the function of Sirt2 is less well understood. Mammalian Sirt2 resides predominantly in the cytoplasm and is involved in cytoskeleton organization by targeting the cytoskeletal protein α-tubulin (101). Sirt2 has been implicated in cell cycle regulation (102, 122-125). Its expression correlates with cell cycle progression and peaks in mitosis. Functionally, Sirt2 is considered a mitotic exit regulator. Overexpression of Sirt2 delayed mitotic exit in response of stress (123, 126, 127) whereas Sirt2 inhibition prolongs chronic mitotic arrest, preventing cell death during re-entry into the cell cycle (127).
Contrastingly, under normal and non-stress inducing cell culture conditions, Sirt2 did not affect cell cycle progression (128). In addition, the Sirt2 catalytic mutant increased the number of multinucleated cells (102, 124), indicating that precise levels of Sirt2 are required for mitotic fidelity. Sirt2 has also been suggested to act as a tumor suppressor gene in human gliomas (129), since downregulation of Sirt2 gene expression or deletion of the chromosomal region harboring the Sirt2 gene is frequently observed in this type of tumor.
Sirt2 protein expression is induced by caloric restriction most predominantly in white
adipose tissue and kidney. Furthermore, in 3T3-L1 murine adipocytes, Sirt2 mRNA levels
were elevated by oxidative stress (130). In cultured pre-adipocytes and in adipocytes in vivo,
Sirt2 was demonstrated to be the most abundant sirtuin (131). Moreover, overexpression of
Sirt2 inhibited adipogenesis, whereas reducing Sirt2 expression had the opposite effect. This
effect was attributed to Sirt2 mediated regulation of FoxO1 deacetylation (131, 132). Sirt2 can
be phosphorylated by various cyclin dependent kinase complexes (124, 128) and
dephosphorylated by CDC14B phosphatase (126), which might down-regulate Sirt2 function.
Introduction
Amongst all sirtuins, Sirt2 expression was found strongest in the brain (128, 133).
Further, Sirt2 was described as an oligodendroglial cytoplasmic protein localized in the myelin sheath, decreasing cell differentiation through α-tubulin deacetylation (133-135). It was concluded that its function might be to prevent premature differentiation or early aging of these cells. NAD
+-mediated deacetylation activity of Sirt2 influences axonal degeneration (136) and microtubule acetylation (133), thus influencing neuronal function
.In neurons, Sirt2 is rather uniformly expressed in all neurits and their growth cones (128). Whereas Sirt1 has been mainly attributed neuroprotective effect e.g. in DNA damage (137) and in model systems of Alzheimer’s disease (120, 138-140), Sirt2 appears to promote neurodegeneration. For instance, Sirt2 inhibition resulted in rescue of alpha-synuclein toxicity in Parkinson’s disease models (141, 142). Conversely, Sirt2 enhances axon degeneration in a mouse model of Wallerian degeneration (136).
1.6.3 Sirt3, 4 and 5
Sirt3, 4 and 5 are localized within the mitochondrial matrix (91, 100, 143-147). Sirt3 possess a mitochondrial signal peptide that is cleaved off after import into mitochondria, necessary for full enzymatic activity (100). Expression of Sirt3 is strong in brown adipose tissue and induced by cold exposure (148). It also appears to regulate mitochondrial function, as its overexpression increases respiration, while at the same time decreasing reactive oxygen species (ROS) production (148). The mitochondrial protein acetylcoenzyme A synthase 2 (AceCS2) was the first substrate identified for Sirt3 (149, 150). AceCS2 is a mitochondrial matrix enzyme that converts acetate to acetyl-CoA in the presence of ATP (151). Deacetylation of AceCS2 by SIRT3 activates its enzymatic activity (149, 150). Sirt3 also regulates ATP synthesis directly by changing the acetylation level of mitochondria electron transport Complex I (152).
Unlike Sirt3, Sirt4 lacks detectable NAD
+-dependent deacetylase activity in vitro, but demonstrates ADP-ribosyl transferase activity (91, 143, 153). Sirt4 is a ubiquitously expressed gene, with highest levels in the kidney, heart, brain, liver, and pancreatic beta cells (91, 143).
Furthermore, Sirt4 has been reported to down regulate glutamate dehydrogenase (GDH) by
ADP ribosylation and negatively regulate both, glucose and amino acid stimulated insulin
secretion(91) whereas Sirt4 knockout mice display higher GDH activity and levels of blood insulin (91).
Recently it was demonstrated that Sirt5 regulates ammonia entry into the urea cycle (146). Sirt5 functions as a weak NAD
+-dependent deacetylase and Sirt5 knockout mice developed normally without obvious metabolic defects (146). Sirt5 is known to interact and deacetylate carbomyl phosphate synthetase 1 (CPS1), which is the rate-limiting first step of the urea cycle. Its activity is required for clearing ammonia generated by amino acid metabolism.
Mice lacking Sirt5 displayed elevated ammonia levels after a prolonged fast, suggesting that this sirtuin is necessary for dealing with byproducts of amino acid metabolism (146).
1.6.4 Sirt6 and Sirt7
Sirt6 and Sirt7 are found in the nucleus and in the nucleolus, respectively (83, 99).
Beside its NAD
+-dependent deacetylase activity and modulating telomeric chromatin (94), Sirt6 has also been shown to demonstrate a robust auto-ADP-ribosyl transferase activity, that plays a role in DNA repair and human aging (92, 154). Mice with a Sirt6 knockout displayed severe developmental defects, such as hypoglycemia, and suffered from premature aging (154).
Additionally, in a recent study Sirt6 was found to regulate tumor necrosis factor (TNF) production (155).
In the nucleolus, Sirt7 associates with rDNA and interacts with RNA polymerase I (Pol I) (156). It may regulate cell growth and metabolism in response to changing metabolic conditions by driving ribosome biogenesis in dividing cells (156).
Taken together, mammalian sirtuins have diverse cellular locations, target multiple
substrates including histones and non-histone substrates and affect a broad range of cellular
functions. In some organisms, sirtuin have been shown to be regulated by and to mediate the
effects of the dietary regimen CR. Moreover, current data indicate that these proteins are
interesting therapeutic targets for metabolic and neurodegenerative diseases. Among all
sirtuins, Sirt1 is the best characterized member to date, while the in vivo function of the other
family members is incompletely understood. Moreover, in vitro experiments have provided
results implicating Sirt2 in adipose tissue metabolism and neuronal survival, thus experiments
Introduction
aiming to delineate the role of Sirt2 in energy homeostasis and neurodegenerative disease in vivo appear will be highly informative.
1.7 Objectives
The first part of this study aimed at the development of a system that allows temporally and spatially controlled gene silencing in mice to study directed gene function analysis in a selected tissue. To test, if this system is applicable for in vivo studies, the knockdown efficiency was determined, using a shRNA against the mouse endogenous target Sirt2 in mice.
The second aim was to explore the role of Sirt2 in vivo. To this end, transgenic mice were generated with a ubiquitous Sirt2 knockdown using an existing inducible RNAi system.
These mice were physiologically characterized under conditions of a normal diet and high fat
diet in terms of metabolic pathways, including adipogenesis, glucose and insulin homeostasis,
embryogenesis and a model of neurodegenerative disease.
2 Material and Methods
2.1 Chemicals
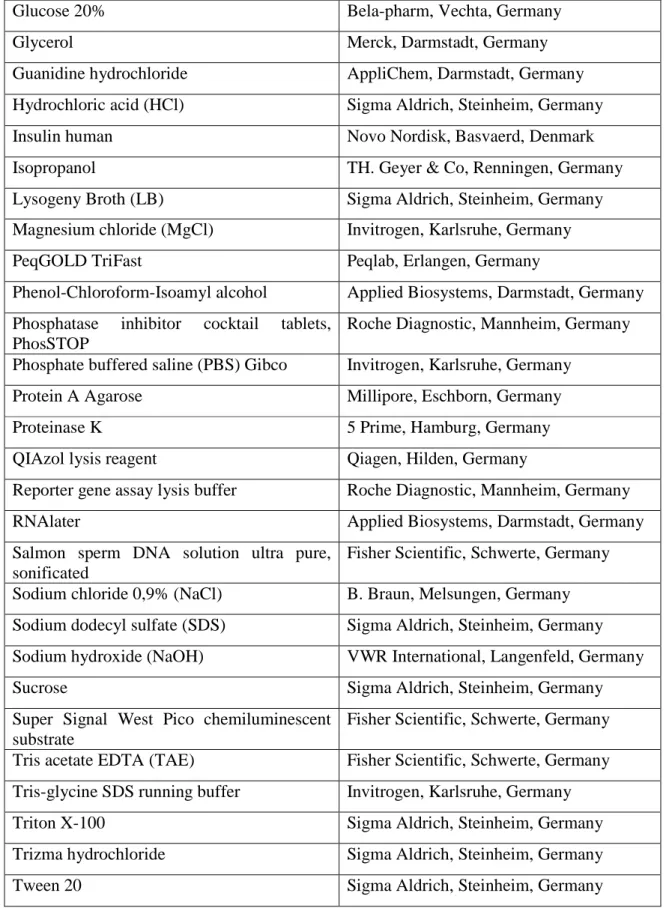
Size markers for agarose gel electrophoresis (1kb Plus DNA Ladder, O`GeneRuler, ready to use) and for SDS-PAGE (peqGOLD Prestained Protein-Marker
IV) were obtained from MBI Fermentas, St. Leon-Rot, Germany and from Peqlab Biotechnologie, Erlangen, Germany, accordingly. Chemicals used in this work are listed below in table 2.
Chemical Supplier, origin
α-[
32P]-dCTP PerkinElmer Life Science, Köln, Germany
β-mercaptoethanol Fisher Scientific, Schwerte, Germany
10x PCR buffer Invitrogen, Karlsruhe, Germany
20x saline-sodium citrate (SSC) Invitrogen, Karsruhe, Germany 4-2-hydroxyethyl-1-piperazineethanesulfonic
acid (HEPES)
Sigma Aldrich, Steinheim, Germany
Agarose ultra pure Invitrogen, Karlsruhe, Germany
Albumine from bovine serum Sigma Aldrich, Steinheim, Germany
Ampicilin VWR International, Langenfeld, Germany
Bromophenol blue Merck, Darmstadt, Germany
Chloroform Merck, Darmstadt, Germany
Complete protease inhibitor cocktail tablets Roche Diagnostic, Mannheim, Germany Desoxyribonukleotide triphosphate set
(dNTP)
5 Prime, Hamburg, Germany
Dithiothreitol (DDT) Sigma Aldrich, Steinheim, Germany
Doxycycline hyclate Sigma Aldrich, Steinheim, Germany
Ethanol absolute Merck, Darmstadt, Germany
Ethidium bromide tablets VWR International, Langenfeld, Germany Ethylenediaminetetraacetic (EDTA) Sigma Aldrich, Steinheim, Germany
G153 Developer Agfa Healthcare, Mortsel, Belgium
G354 Fix Agfa Healthcare, Mortsel, Belgium
Geneticin (G418) Sigma Aldrich, Steinheim, Germany
Material and Methods
Glucose 20% Bela-pharm, Vechta, Germany
Glycerol Merck, Darmstadt, Germany
Guanidine hydrochloride AppliChem, Darmstadt, Germany Hydrochloric acid (HCl) Sigma Aldrich, Steinheim, Germany
Insulin human Novo Nordisk, Basvaerd, Denmark
Isopropanol TH. Geyer & Co, Renningen, Germany
Lysogeny Broth (LB) Sigma Aldrich, Steinheim, Germany Magnesium chloride (MgCl) Invitrogen, Karlsruhe, Germany
PeqGOLD TriFast Peqlab, Erlangen, Germany
Phenol-Chloroform-Isoamyl alcohol Applied Biosystems, Darmstadt, Germany Phosphatase inhibitor cocktail tablets,
PhosSTOP
Roche Diagnostic, Mannheim, Germany Phosphate buffered saline (PBS) Gibco Invitrogen, Karlsruhe, Germany
Protein A Agarose Millipore, Eschborn, Germany
Proteinase K 5 Prime, Hamburg, Germany
QIAzol lysis reagent Qiagen, Hilden, Germany
Reporter gene assay lysis buffer Roche Diagnostic, Mannheim, Germany
RNAlater Applied Biosystems, Darmstadt, Germany
Salmon sperm DNA solution ultra pure, sonificated
Fisher Scientific, Schwerte, Germany Sodium chloride 0,9% (NaCl) B. Braun, Melsungen, Germany Sodium dodecyl sulfate (SDS) Sigma Aldrich, Steinheim, Germany Sodium hydroxide (NaOH) VWR International, Langenfeld, Germany
Sucrose Sigma Aldrich, Steinheim, Germany
Super Signal West Pico chemiluminescent substrate
Fisher Scientific, Schwerte, Germany Tris acetate EDTA (TAE) Fisher Scientific, Schwerte, Germany Tris-glycine SDS running buffer Invitrogen, Karlsruhe, Germany
Triton X-100 Sigma Aldrich, Steinheim, Germany
Trizma hydrochloride Sigma Aldrich, Steinheim, Germany
Tween 20 Sigma Aldrich, Steinheim, Germany
Table 2: Chemicals
2.2 Molecular biology
Standard methods of molecular biology were performed according to Sambrook and Russell (157), if not stated otherwise.
2.2.1 Cloning of promoter fragments or genes
In general, amplified or digested DNA fragments were separated by size using agarose gel electrophoresis (1 to 3 % (w/v), (depending on fragment size); agarose; 1 x TAE; 0.5 mg/ml ethidium bromide; 1 x TAE electrophoresis buffer). To isolate DNA fragments from gel or to purify PCR amplificants the QIAquick Gel Extractions-Kit (Qiagen, Hilden, Germany) was used according to manufacturer’s instructions.
The ligation of purified DNA into a vector was mediated by 12 U T4-DNA-Ligase high concentration (Invitrogen, Karlsruhe, Germany) at room temperature for 30 minutes, or alternatively at 16°C over night with an insert:vector molar ratio of 3:1 and followed by the transformation into chemically competent Escherichia coli (E. coli), growing on ampicillin containing LB agar plates. Competent E. coli DH5α cells were prepared according to a standard protocol (158) and used for heat shock transformation of plasmid DNA (30 min on ice; 40 sec at 42°C; 1h at 37°C in 300 µl S.O.C medium (Invitrogen, Karlsruhe, Germany).
To analyze for the presence of correct target plasmid DNA, recombinant bacterial colonies were screened with the CloneChecker System (Invitrogen, Karlsruhe, Germany) according to manufacturer’s instructions. For the isolation of the plasmid DNA from transformed E. coli colonies a bacteria suspension of 50 ml LB-medium (Midirep-Kit) or 3 ml LB-medium (Miniprep Kit) was incubated at 37°C overnight. The preparation of plasmid DNA from transformed E. coli colonies was performed using PureLink HiPure Plasmid DNA Midiprep, or PureLink HiPure Plasmid Miniprep Kit (Invitrogen, Karlsruhe, Germany) according to manufacturer’s instructions.
2.2.2 Cloning plasmid constructs 1, 2 and 6
Main promoter elements of plasmid constructs 1, 2 and 6 were generated by gene
synthesis from Sloning Biotechnology, Puchheim, Germany. Following fragments (Table 3)
Material and Methods
were generated by fusion PCR with primers that are listed in table 4. The fusion products, such as Fusion PCR synthetic1.1, Fusion PCR synthetic2.1 and Fusion PCR synthetic6.1 were digested each with FseI/StuI and cloned into the FseI- and StuI- sites of the final_synth1.1- vector (product from TaconicArtemis GmbH) containing an F3 site, 5´Dneo, pAhGH, zs green gene, loxP site, tet operator, shLacZ, Caggs promoter and a LacZ gene, flanked by an FRT site.
The plasmids were now termed new_synth1.1, new_synth2.1 and new_synth6.1, respectively.
These plasmid were transformed subsequently into the Cre expressing E. coli strain 294-Cre (159) for Cre mediated deletion of PIE, resulting in constructs named new_synth1.1dPIE, new_Synth2.1dPIE and new_Synth6.1dPIE, respectively.
Construct Description Sequence Fusion PCR
synthetic1.1
PCR1 was generated from the plasmid MRbasic with primers MR22s/oMR17as (341 bp); PCR2 was generated from
final_synth1 with primers oMR21s/oMR19as (759 bp). For the fusion of PCR1 and PCR2, primers oMR22s and oMR19as (1121 bp) were used. (All PCRs were performed with High Fidelity Platinum Taq Polymerase)
GCGTTGGGTCCACTCAGTAGATGCCTGTTGAATTAAGCTTATTTA AATAGGCCGGCCAGATCTGTCGACAATTGGATCCTCACAGTAGGT GGCATCGTTCCTTTCTGACTGCCCGCCCCCCGCATGCCGTCCCGC GATATTGAGCTCCGAACCTCTCGCCCTGCCGCCGCCGGTGCTCCG TCGCCGCCGCGCCGCCATGGAATTCGAACGCTGACGTCATCAACC CGCTCCAAGGAATCGCGGGCCCAGTGTCACTAGGCGGGAACACC CAGCGCGCGTGCGCCCTGGCAGGAAGATGGCTGTGAGGGACAGG GGAGTGGCGCCCTGCAATATTTGCATGTCGCTATGTGTTCTGGGA AATCACCATAAACGTGAAATAACTTCGTATAATGTATGCTATACG AAGTTATTTTTTGCGTTAATTAAGTGCGATTAAGGGTGCAGCGGC CTCCGCGCCGGGTTTTGGCGCCTCCCGCGGGCGCCCCCCTCCTCA CGGCGAGCGCTGCCACGTCAGACGAAGGGCGCAGGAGCGTTCCT GATCCTTCCGCCCGGACGCTCAGGACAGCGGCCCGCTGCTCATAA GACTCGGCCTTAGAACCCCAGTATCAGCAGAAGGACATTTTAGG ACGGGACTTGGGTGACTCTAGGGCACTGGTTTTCTTTCCAGAGAG CGGAACAGGCGAGGAAAAGTAGTCCCTTCTCGGCGATTCTGCGG AGGGATCTCCGTGGGGCGGTGAACGCCGATGATTATATAAGGAC GCGCCGGGTGTGGCACAGCTAGTTCCGTCGCAGCCGGGATTTGG GTCGCGGTTCTTGTTTGTGGATCGCTGTGATCGTCACTTGGTGAGT TGCGGGCTGCTGGGCTGGCCGGGGCTTTCGTGGCCGCCGGGCCGC TCGGTGGGACGGAAGCGTGTGGAGAGACCGCCAAGGGCTGTAGT CTGGGTCCGCGAGCAAGGTTGCCCTGAACTGGGGGTTGGGGGGA GCGCACAAAATGGCGGCTGTTCCCGAGTCTTGAATGGAAGACGC TTGTAAGGCGGGCTGTGAGGTCGTTGAAACAAGGTGGGGGGCAT GGTGGGCGGCAAGAACCCAAGGTCTTGAGGCCTTCGCTAATGCG GGAAAGC
Fusion PCR synthetic2.1
PCR1 was generated from the plasmid MRbasic with primers MR22s/oMR17as (341 bp); PCR2 was generated from
final_synth2 with primers oMR21s/oMR19as (759 bp). For the fusion of PCR1 and PCR2, primers oMR22s and oMR19as (1121 bp) were used. (All PCRs were performed with High Fidelity Platinum Taq Polymerase)
GCGTTGGGTCCACTCAGTAGATGCCTGTTGAATTAAGCTTATTTA AATAGGCCGGCCAGATCTGTCGACAATTGGATCCTCACAGTAGGT GGCATCGTTCCTTTCTGACTGCCCGCCCCCCGCATGCCGTCCCGC GATATTGAGCTCCGAACCTCTCGCCCTGCCGCCGCCGGTGCTCCG TCGCCGCCGCGCCGCCATGGAATTCGAACGCTGACGTCATCAACC CGCTCCAAGGAATCGCGGGCCCAGTGTCACTAGGCGGGAACACC CAGCGCGCGTGCGCCCTGGCAGGAAGATGGCTGTGAGGGACAGG GGAGTGGCGCCCTGCAATATTTGCATGTCGCTATGTGTTCTGGGA AATCACCATAAACGTGAAATGTCTTATAACTTCGTATAATGTATG CTATACGAAGTTATTTTTTGCGTTAATTAAGTGCGATTAAGGGTG CAGCGGCCTCCGCGCCGGGTTTTGGCGCCTCCCGCGGGCGCCCCC CTCCTCACGGCGAGCGCTGCCACGTCAGACGAAGGGCGCAGGAG CGTTCCTGATCCTTCCGCCCGGACGCTCAGGACAGCGGCCCGCTG CTCATAAGACTCGGCCTTAGAACCCCAGTATCAGCAGAAGGACA TTTTAGGACGGGACTTGGGTGACTCTAGGGCACTGGTTTTCTTTC CAGAGAGCGGAACAGGCGAGGAAAAGTAGTCCCTTCTCGGCGAT TCTGCGGAGGGATCTCCGTGGGGCGGTGAACGCCGATGATTATAT AAGGACGCGCCGGGTGTGGCACAGCTAGTTCCGTCGCAGCCGGG ATTTGGGTCGCGGTTCTTGTTTGTGGATCGCTGTGATCGTCACTTG GTGAGTTGCGGGCTGCTGGGCTGGCCGGGGCTTTCGTGGCCGCCG GGCCGCTCGGTGGGACGGAAGCGTGTGGAGAGACCGCCAAGGGC TGTAGTCTGGGTCCGCGAGCAAGGTTGCCCTGAACTGGGGGTTGG GGGGAGCGCACAAAATGGCGGCTGTTCCCGAGTCTTGAATGGAA GACGCTTGTAAGGCGGGCTGTGAGGTCGTTGAAACAAGGTGGGG GGCATGGTGGGCGGCAAGAACCCAAGGTCTTGAGGCCTTCGCTA ATGCGGGAAAGC
Fusion PCR synthetic6.1
PCR1 was generated from the plasmid MRbasic with primers MR22s/oMR20as (339 bp); PCR2 was generated from
final_synth6 with primers oMR21s/oMR19as (759 bp). For the fusion of PCR1 and PCR2, primers oMR21s and oMR19as (1090 bp) were used. (All PCRs were performed with High Fidelity Platinum Taq Polymerase)
GCGTTGGGTCCACTCAGTAGATGCCTGTTGAATTAAGCTTATTTA AATAGGCCGGCCAGATCTGTCGACAATTGGATCCTCACAGTAGGT GGCATCGTTCCTTTCTGACTGCCCGCCCCCCGCATGCCGTCCCGC GATATTGAGCTCCGAACCTCTCGCCCTGCCGCCGCCGGTGCTCCG TCGCCGCCGCGCCGCCATGGAATTCGAACGCTGACGTCATCAACC CGCTCCAAGGAATCGCGGGCCCAGTGTCACTAGGCGGGAACACC CAGCGCGCGTGCGCCCTGGCAGGAAGATGGCTGTGAGGGACAGG GGAGTGGCGCCCTGCAATATTTGCATTAGAGAATAACTTCGTATA ATGTATGCTATACGAAGTTATTTTTTGCGTTAATTAAGTGCGATTA AGGGTGCAGCGGCCTCCGCGCCGGGTTTTGGCGCCTCCCGCGGGC GCCCCCCTCCTCACGGCGAGCGCTGCCACGTCAGACGAAGGGCG CAGGAGCGTTCCTGATCCTTCCGCCCGGACGCTCAGGACAGCGGC CCGCTGCTCATAAGACTCGGCCTTAGAACCCCAGTATCAGCAGAA GGACATTTTAGGACGGGACTTGGGTGACTCTAGGGCACTGGTTTT CTTTCCAGAGAGCGGAACAGGCGAGGAAAAGTAGTCCCTTCTCG GCGATTCTGCGGAGGGATCTCCGTGGGGCGGTGAACGCCGATGA TTATATAAGGACGCGCCGGGTGTGGCACAGCTAGTTCCGTCGCAG CCGGGATTTGGGTCGCGGTTCTTGTTTGTGGATCGCTGTGATCGT CACTTGGTGAGTTGCGGGCTGCTGGGCTGGCCGGGGCTTTCGTGG CCGCCGGGCCGCTCGGTGGGACGGAAGCGTGTGGAGAGACCGCC AAGGGCTGTAGTCTGGGTCCGCGAGCAAGGTTGCCCTGAACTGG GGGTTGGGGGGAGCGCACAAAATGGCGGCTGTTCCCGAGTCTTG AATGGAAGACGCTTGTAAGGCGGGCTGTGAGGTCGTTGAAACAA GGTGGGGGGCATGGTGGGCGGCAAGAACCCAAGGTCTTGAGGCC TTCGCTAATGCGGGAAAGC
Table 3: Fusion PCR-synthetic1.1, -synthetic2.1 and –synthetic6.1
Material and Methods
Primer Sequence (5´-3´) T
annealing°C Orientation
oMR17 as GGTGATTTCCCAGAACACATAGCG 58 antisense
oMR18 s CGCTATGTGTTCTGGGAAATCACC 58 sense
oMR19 as GCTTTCCCGCATTAGCGAAGG 58 antisense
oMR20 as ATGCAAATATTGCAGGGCGCCACTCC 58 antisense
oMR21 s CGCCCTGCAATATTTGCATTAGAGAATAA
CTTCG
58 sense
oMR22 s GCGTTGGGTCCACTCAGTAGATGC 58 sense
Table 4: Primers used for fusion PCR-synthetic1.1, -synthetic2.1 and -synthetic6.1
All primer sequences are displayed in 5´-3´order. Primer orientation is designated "sense" when coinciding with transcriptional direction. All primers were purchased from Metabion, Germany.
2.2.3 Cloning plasmid constructs 3, 4, 5 and 7
The technical challenge was to insert a loxP site at any position within the promoter
sequence. Therefore, the In-Fusion™Dry-Down PCR Cloning Kit (Clontech Laboratories,
Saint-Germain-en-Laye, France) was used to amplify the required sequence by PCR reaction
without the need of restriction enzymes cleavage. The amplified products contained 15 bp
sequence homologies on both ends that were added through the PCR primers. Finally, the In-
Fusion Enzyme promoted single-strand annealing reactions between the DNA molecules that
share short sequence overlaps (or homologies) at their ends, such as the PCR amplified insert
and vector backbone. A schematic overview of the In-Fusion cloning method is depicted in
Figure 4.
PCR product from plasmid SN1.0
PCR product from plasmid (MRbasic)
In fusion enzyme
Recombinant vector
Figure 3: Overview of Infusion cloning method
The In-fusion enzyme creates single-stranded regions at the end of the vector and PCR product, which are then fused due to the 15 bp homology. Adapted from In-Fusion Dry-Down PCR Cloning Kit User Manual (Clontech Laboratories Inc.)
PCR fragments were amplified from plasmids MRbasic and SN1.0 (both product from TaconicArtemis GmbH), respectively and fused using the In-Fusion™Dry-Down PCR Cloning Kit (Clontech Laboratories, Saint-Germain-en-Laye, France). The primers used for amplification are listed below (Table 5). PIE was deleted by Cre-mediated recombination through transformation of the plasmids into the Cre expressing E. coli strain 294-Cre (159).
Construct Primer Sequence (5´ - 3´) T
annealing°C Description
oMR2 s TTATAAGTCCCTATCAGTGATAGAGATT CCCAGTG
oMR2 as ATTTCACGTTTATGGTGATTTCCCAGAA CACATAGC
60 (4 x cycles) 65 (16 x cycles)
Used for amplification of the vector backbone consisting of following elements: F3, D-5´neo- pA, pAhGH, defined parts from 5´ and 3´ of H1 promoter, FRT and amp resistance gene.
Template plasmid:
MRbasic; Size:5.72kb 3
oMR1 s AATCACCATAAACGTGAAATCGTATAA TGTATGCTATACGAAGTTATGCGTAATA CGACTCACTATAGGGCG
55 (4 x cycles) 65 (16 x cycles)
Used for amplification of the H1 promoter elements implying a loxP flanked stuffer sequence called PIE
Material and Methods
oMR1 as TCTCTATCACTGATAGGGACTTATAAGT ATAGCATACATTATACGAAGTTATCTGT TATCCCTAGCGTAACTGGC
oMR8 s ATAAGTCCCTATCAGTGATAGAGATTCC CAGTGGATGGAGCCG
oMR8 as GGTGATTTCCCAGAACACATAGCGACA TGC
60 (4 x cycles) 65 (16 x cycles)
Used for amplification of the vector backbone consisting of following elements: F3, D-5´neo- pA, pAhGH, defined parts from 5´ and 3´ of H1 promoter, FRT and amp resistance gene.
Template plasmid:
MRbasic; Size:5.71 kb
oMR7 s ATGTGTTCTGGGAAATCACCATAACTTC GTATAATGTATGCTATACGAAGTTATGC GTAATACGACTCACTATAGGGCG 4
oMR7 as CTATCACTGATAGGGACTTATAATAACT TCGTATAGCATACATTATACGAAGTTAT CTGTTATCCCTAGCGTAACTGGCGCGC
60 (4 x cycles) 65 (16 x cycles)
Used for amplification of the H1 promoter elements implying a loxP flanked stuffer sequence called PIE (zsgreen under control of an ubiquitin promoter).
Template plasmid:
SN1.0; Size: 2.44 kb oMR10 s GCTATACGAAGTTATTGCAGTTTTAAAA
TTATGTTTTAAAATGGACTATCATATGC TCACCATAAACGTGAAATGTCTTTGGAT TTGGGAATCTTATAAGTCC
oMR10 as TATTTTGTACTAATATCTTTGTGTTTACA GTCAAATTAATTCTAATTATCTCTCTAA CAGCCTTGTATCGTATATGCAAATATTG CAGGGCGCCACTCCCCTGTC
60 (4 x cycles) 65 (16 x cycles)
Used for amplification of the vector backbone consisting of following elements: F3, D-5´neo- pA, pAhGH, defined parts from 5´ and 3´ of H1 promoter, FRT and amp resistance gene.
Template plasmid:
MRbasic; Size:5.85 kb oMR9 s CAAAGATATTAGTACAAAATAATAACT
TCGTATAATGTATGCTATACGAAGTTAT GCGTAATACGACTCACTATAGGGCGAA TTGGAGCTCCACCGCG
5
oMR9 as CTGCAATAACTTCGTATAGCATACATTA TACGAAGTTATCTGTTATCCCTAGCGTA ACTGGCG
60 (4 x cycles) 65 (16 x cycles)
Used for amplification of the U6 promoter DSE element including a 156 bp promoter sequence 3´from U6- DSE with the loxP flanked stuffer sequence called PIE (zsgreen under control of an ubiquitin promoter) and the PSE element from H1 promoter.
Template plasmid:
SN1.0; Size: 2.42 kb
7
oMR14 s TCATATGTCACCATAAACGTGAAATGTC TTTGGATTTGGG
58 (4 x cycles) 65 (16 x cycles)
Used for amplification of the vector backbone consisting of following elements: F3, D-5´neo- pA, pAhGH, defined
oMR14 as TTTCCCAGAACACATAGCGACATGCAA ATATTGCAGG
oMR13 s GCATGTCGCTATGTGTTCTGGGAAATAG AGAATAACTTCGTATAATGTATGCTATA CGAAGTTATGCGTAATACG
oMR13 as CACGTTTATGGTGACATATGAATAACTT CGTATAGCATACATTATACGAAGTTATC TGTTATCCCTAGCGTAACTGGCGCG
58 (4 x cycles) 65 (16 x cycles)
Used for amplification of the H1 promoter elements implying a loxP flanked stuffer sequence called PIE (zsgreen gene under control of an ubiquitin promoter).
Template plasmid:
SN1.0; Size: 2.45kb
Table 5: Primers used for cloning of construct 3, 4, 5 and 7
All primer sequences are displayed in 5´-3´order. Primer orientation is designated "sense" when coinciding with transcriptional direction. All primers were purchased from Metabion, Germany.
2.2.4 Isolation of Genomic DNA
For genomic DNA isolation, mouse tail biopsies were incubated overnight in lysis buffer (100 mM Tris-HCl (pH 8.5), 5 mM EDTA, 0.2% (w/v) SDS, 0.2 M NaCl, 200 µ g/ml proteinase K) in a thermomixer (Eppendorf, Hamburg, Germany) at 55°C and 1100 rounds per minute (rpm). Samples were centrifuged to discard debris and supernatant was transferred in a new vial. DNA-precipitation was then performed by addition of one equivalent of isopropanol.
After centrifugation and a single washing step with 70% (v/v) ethanol, the DNA pellet was dried at room temperature (RT) for 15 minutes and resuspended in TE buffer (10 mM Tris- HCL (pH 7.5), 1 mM EDTA (pH 8.0)).
Mouse embryonic stem (mES) cells were incubated in lysis buffer (10 mM Tris-HCL (pH 7.5), 10 mM EDTA, and 10 mM NaCl, 5% (w/v) N-Laurylsacrosinate, 0.5 mg/ml proteinase K) at 60°C over night. DNA was precipitated with double amount of 100% ethanol, absolute, washed as described above and resuspended in double distilled water (ddH2O).
2.2.5 Polymerase Chain Reaction (PCR)
The PCR method (160, 161) was used to genotype the mice for the presence of
transgenes with customized primers listed in table 6. Reactions were performed in a
Material and Methods
thermocycler MultiCycler PTC 225 Tetrad (Bio-Rad Laboratories, CA, USA) or in DNA engine Tetrad 2 Peltier Thermal Cycler (Bio-Rad Laboratories, München, Germany). All amplifications were performed in a total reaction volume of 50 µl, containing a minimum of 50 ng template DNA, 5 µM of each primer, 10 mM dNTP Mix, 50 mM MgCl, 10 x PCR buffer and 5 units/µl Taq DNA Polymerase (Invitrogen, Karlsruhe, Germany). Standard PCR programs started with 5 minutes (min) of denaturation at 95°C, followed by 35 cycles consisting of denaturation at 95°C for 30 seconds (sec), annealing at oligonucleotide-specific temperatures for 30 sec and elongation at 72°C for 1 min and a final elongation step at 72°C for 10 min.
For cloning procedures, the High Fidelity Platinum Taq Polymerase (Invitrogen, Karlsruhe, Germany) was used instead.
Primer Sequence (5’ - 3’) T
Annealing°C Orientation
oRNA46 TATGGGCTATGAACTAATGACCC 60 antisense
oRNA48 CCATGGAATTCGAACGCTGACGTC 60 sense
oMRseq31as CGGCGCGTCCTTATATAATCATCG 60 antisense
Cre1011_1 ACGACCAAGTGACAGCAATG 60 sense
Cre1011_2 CTCGACCAGTTTAGTTACCC 60 antisense
Rosawt1114_1 CTCTTCCCTCGTGATCTGCAACTCC 60 sense
Rosawt1114_2 CATGTCTTTAATCTACCTCGATGG 60 antisense
Neo1012_1 TGCTCCTGCCGAGAAAGTATCCATC
ATGGC
60 sense
Neo1012_2 CGCCAAGCTCTTCAGCAATATCACG
GGTAG
60 antisense
LacZ1004_3 ATCCTCTGCATGGTCAGGTC 60 sense
LacZ1004_3 CGTGGCCTGATTCATTCC 60 antisense
Table 6: Primers used for genotyping
All primer sequences are displayed in 5´-3´order. Primer orientation is designated "sense" when coinciding with transcriptional direction. All primers were purchased from Metabion, Germany.
2.2.6 Southern Blot
10 µg of genomic DNA were digested overnight at 37°C, with 40 U of HindIII or BamHI restriction enzyme (New England BioLabs GmbH, Frankfurt, Germany) and separated electrophoretically on a 0.8% (w/v) agarose gel at 90 V. The DNA was subsequently transferred to a Hybond
TM-XL nylon membrane (GE Healthcare, Freiburg, Germany) by an alkaline capillary transfer (162). After a washing step with 2 x SSC, DNA was crosslinked to the membrane by baking at 80°C for 1 hr. The membrane was pre-hybridized at 65°C for 1 h in hybridization solution (1 M NaCl; 50 mM Tris-HCL (pH 7.5), 10% (w/v) dextran sulfate, 0.1%
(w/v) SDS; 250µ g/ml sonicated salmon sperm DNA). The probes were generated by digestion of vector plasmid DNA or by PCR (Table 7, 8) and labeled with α-
32P-dCTP (PerkinElmer Life Sciences, Köln, Germany) using the Amersham Ready-To-Go DNA labeling beads (GE Healthcare, Freiburg, Germany). The radioactively labeled probe was then added to the pre- hybridization solution and hybridization was performed overnight at 65°C in a rotating cylinder. Un-specifically bound probe was removed by washing the membrane initially with 2 x SSC / 0.1 % (w/v) SDS, followed by 0.2 x SSC / 0.1% (w/v) SDS, if necessary. All washes were performed at 65°C under gentle shaking for 10-20 min. After each wash, the membrane was monitored with a scintillation detector and the washing steps were stopped when radioactivity reached 20 to 50 impulses per second (IPS). The membrane was then sealed in a plastic bag and exposed to autoradiography film (Kodak BioMax, MS; Sigma-Aldrich Chemie GmbH, Deisenhofen, Germay) at -80°C. Films were developed in an automatic developer (Agfa HealthCare GmbH, Köln, Germany).
Probe Size (bp) Restriction enzyme Vector Description
Rosa 3´ 386 HindIII JS43
external probe 3´from integration site at the rosa26 locus
Neo 519 HindIII/ EcoRI KD602
Internal probePuro 292 SpeI/XhoI pMultilink
Puro
Internal probe
Table 7: Probes for Southern Blot generated by digestion of vector DNA The vectors are all products from TaconicArtemis GmbH.
Material and Methods
Probe Size (bp)
Primer (5´-3´) T
annealing°C Orientation Plasmid Description
AAGGATACTGGGGCA
TACG
60 sense
Rosa 5´ 533
CTTCTCAGCTACCTTT
ACACACC
60 antisense
JS32
Externalprobe 5´
from integration site at the rosa26 locus
Table 8: Probes for Southern Blot generated by PCR
All primer sequences are displayed in 5´-3´order. Primer orientation is designated "sense" when coinciding with transcriptional direction. All primers were purchased from Metabion, Germany.