Characterization of snowfall using ground–based
passive and active remote sensors
Inaugural–Dissertation zur Erlangung des Doktorgrades
der Mathematisch-Naturwissenschaftlichen Fakult¨ at der Universit¨ at zu K¨ oln
vorgelegt von Stefan Kneifel aus Wolfratshausen
K¨ oln 2011
Prof. Dr. A. Illingworth
Tag der m¨ undlichen Pr¨ ufung: 21.11.2011
How full of the creative genius is the air in which these are generated!
I should hardly admire more if real stars fell and lodged on my coat.
Nature is full of genius, full of the divinity;
so that not a snowflake escapes its fashioning hand.
Nothing is cheap and coarse, neither dewdrops nor snowflakes.
Henry David Thoreau (1817 – 1862)
Abstract
Snowfall is a key quantity in the global hydrological cycle and has an impact on the global energy budget as well. In sub–polar and polar latitudes, snowfall is the predominant type of precipitation and rainfall is often initiated via the ice phase. Currently, the spatial distri- bution of snowfall is poorly captured by numerical weather prediction and climate models.
In order to evaluate the models and to improve our understanding of snowfall microphysics, global observations of snowfall are needed. This can only be obtained by space–borne active and passive remote sensors. In order to be able to penetrate even thick snow clouds, sen- sors operating in the microwave frequency region are favoured. The challenge for snowfall retrieval development lies first in the complexity of snowfall microphysics and its interactions with liquid cloud water. Secondly, comprehensive knowledge is needed about the interaction of electromagnetic radiation with snowfall in order to finally relate the radiative signatures to physical quantities.
A general advantage of ground–based observations is that simultaneous measurements of in–situ and remote sensing instruments can be obtained. Such a six–month dataset was collected within this thesis at an alpine site. The instrumentation included passive microwave radiometers that covered the frequency range from 22 up to 150 GHz as well as two radar sys- tems operating at 24.1 and 35.5 GHz. These data were complemented by optical disdrometer, ceilometer and various standard meteorological measurements.
State-of-the-art single scattering databases for pristine ice crystals and complex snow aggregates were used within this thesis to investigate the sensitivity of ground–based passive and active remote sensors to various snowfall parameters such as vertical snow and liquid water distribution, snow particle habit, snow size distribution and ground surface properties.
The comparison of simulations with measurements within a distinct case study revealed that snow particle scattering can be measured with ground–based passive microwave sensors at frequencies higher than 90 GHz. Sensitivity experiments further revealed that ground–
based sensors have clear advantages over nadir measuring instruments due to a stronger snow scattering signal and lower sensitivity to variable ground surface emissivity. However, passive sensors were also found to be highly sensitive to liquid cloud water that was frequently observed during the entire campaign. The simulations indicate that the uncertainties of sizes distribution and snow particle habit are not distinguishable with a passive–only approach.
In addition to passive microwave observations, data from a low–end radar system that is commonly used for rainfall were investigated for its capabilities to observe snowfall. For this, a snowfall specific data processing algorithm was developed and the re-processed data were compared to collocated measurements of a high-end cloud radar. If the focus can be narrowed down to medium and strong snowfall within the lowest 2–3 km height, the reflectivity and fall velocity measurements of the low–end system agree well with the cloud radar. The cloud radar dataset was used to estimate the uncertainty of retrieved snowfall rate and snow
i
accumulation of the low–end system. Besides the intrinsic uncertainties of single–frequency radar retrievals the estimates of total snow accumulation by the low–end system lay within 7 % compared to the cloud radar estimates.
In a more general approach, the potential of multi–frequency radar systems for derivation of snow size distribution parameters and particle habit were investigated within a theoretical simulation study. Various single–scattering databases were combined to test the validity of dual–frequency approaches when applied to non–spheroid particle habits. It was found that the dual–frequency technique is dependent on particle habit. It could be shown that a rough distinction of snow particle habits can be achieved by a combination of three frequencies. The method was additionally tested with respect to signal attenuation and maximum particle size.
The results obtained by observations and simulations within this thesis strongly suggest
the further development of simultaneous ground–based in-situ and remote sensing observa-
tions of snowfall. Extending the sensitivity studies of this study will help to define the most
suitable set of sensors for future studies. A combination of these measurements with a further
development of single–scattering databases will potentially help to improve our understanding
of snowfall microphysics.
Zusammenfassung
Schneefall spielt eine herausragende Rolle im globalen Wasserkreislauf und hat ebenfalls einen Einfluß auf die globale Energiebilanz. In den polaren Regionen ist Schneefall die do- minierende Niederschlagsart. Ebenso wird Regen gerade in mittleren Breiten gr¨ oßtenteils
¨
uber die Eisphase gebildet. Die tats¨ achliche r¨ aumliche Schneefallverteilung wird von ak- tuellen Wettervorhersage– und Klimamodellen nur sehr unzureichend wiedergegeben. Um diese Modelle zu evaluieren und um unser Verst¨ andnis der Schneemikrophysik zu verbessern, sind globale Beobachtungen unabdingbar. Dies kann nur von Satelliten aus mit aktiven und passiven Fernerkundungssensoren erreicht werden. Hierbei bieten sich gerade Sensoren im Mikrowellenbereich an, da diese selbst dicke Schneewolken durchdringen k¨onnen. Die große Herausforderung f¨ ur die Ableitung von Schneefallparametern aus solchen Messungen besteht in der komplexen Schneemikrophysik und den Wechselwirkungen von Schnee– und Esipartikeln mit fl¨ ussigem Wolkenwasser. Um schließlich aus den gemessenen Werten auf physikalische Gr¨ oßen schließen zu k¨onnen, sind desweiteren umfassende Kenntnisse ¨ uber die Wechselwirkung elektromagnetischer Strahlung mit den Schneepartikeln n¨ otig.
Bodengebundene Stationen erlauben simultane Messungen mit in–situ und Fernerkun- dungsinstrumenten. Ein solcher sechsmonatiger Datensatz wurde w¨ ahrend der hier vorgestell- ten Doktorarbeit an einer Messstation in den Alpen aufgenommen. Die Instrumentierung schloß sowohl passive Mikrowellenradiometer, im Frequenzbereich zwischen 22 bis 150 GHz, als auch zwei Radarsysteme bei 24.1 und 35.5 GHz ein. Erg¨anzt wurden diese Messungen noch durch Beobachtungen von optischen Distrometern, einem Ceilometer sowie verschiedener me- teorologischer Standardgr¨ oßen.
Im Rahmen der Doktorarbeit wurden die momentan aktuellsten Streudatenbanken zur Simulation sowohl einzelner Schneekristalle, als auch komplexer Schneeaggregate eingesetzt.
Damit wurden die Sensitivit¨ aten der bodengebundenen passiven und aktiven Fernerkun- dungsmessungen gegen¨ uber den verschiedenen Schneefallparametern untersucht. Dazu geh¨ o- ren im Besonderen die vertikale Verteilung von fl¨ ussigem Wolkenwasser und Schneegehalt, die Schneepartikelform, die Schneegr¨oßenverteilung und strahlungsrelevante Eigenschaften der Erdoberfl¨ ache. Im Rahmen einer Fallstudie wurden Strahlungstransportsimulationen und Messungen verglichen. Dieser Vergleich ergab, dass Streusignale verursacht durch Schneefall bei Frequenzen oberhalb von 90 GHz mit bodengebundenen Mikrowellensensoren meßbar sind. Zus¨atzliche Sensitivit¨ atsexperimente zeigten klare Vorteile bodengebundener Mes- sungen gegen¨ uber Messungen in Richtung des Erdbodens — beispielsweise von Satelliten aus. Zum einen ist das Schnee–Streusignal deutlich st¨ arker, und zum anderen sind boden- gundene Messungen deutlicher weniger von variablen Bodenemissivit¨aten beeinflußt. Die Ergebnisse dieser Studie zeigen jedoch ebenso deutlich, dass passive Mikrowellenmessun- gen ¨ außerst sensitiv gegen¨ uber vorhandenem atmosph¨arischem Fl¨ ussigwasser sind, welches
¨
uberraschend h¨ aufig in Schneewolken w¨ ahrend des Messzeitraums gemessen wurde. Mit Hilfe
iii
der Simulationsrechnungen konnte weiterhin gezeigt werden, dass sich die Unsicherheiten durch Schneegr¨oßenverteilung und Schneepartikelform im gleichen Maße auf die Messungen auswirken, und somit diese sich mit passiven Methoden allein nicht unterscheiden lassen.
Zus¨atzlich zu den passiven Mikrowellenbeobachtungen wurden die Messungen eines ein- fachen Radarsystems, welches ¨ ublicherweise f¨ ur Regen eingesetzt wird, auf sein Potenzial hinsichtlich Schneefallbeobachtung untersucht. Dazu wurde eine spezielle Schneefalldaten- prozessierung entwickelt und die neu prozessierten Messwerte mit den zeitgleich gemessenen Daten eines leistungsf¨ ahigen Wolkenradars verglichen. Der Vergleich zeigte, dass wenn der Beobachtungsfokus auf die bodennahen Schichten unterhalb von ca. 2–3 km H¨ohe und auf mittlere bis starke Schneefallereignisse eingeschr¨ ankt werden kann, die Radarreflektivit¨ aten und die gemessenen Fallgeschwindigkeiten des einfachen Systems gut mit dem Wolkenradar
¨
ubereinstimmen. Mit Hilfe der Wolkenradardaten konnte ebenfalls abgesch¨ atzt werden, welche Auswirkungen die begrenzte Sensitivit¨ at des einfacheren Systems auf die messbaren Schneefallraten, und damit auf die gesamt akkumulierte Schneefallmenge hat. Abgesehen von systembedingten Unsicherheiten, welche bei Ableitungen der Schneefallrate mittels eines Ein- fachfrequenzradars entstehen, wich die abgeleitete akkumulierte Schneemenge nur um etwa 7 % von der des Wolkenradars ab.
Im letzten Teil der Doktorarbeit wurde das Potenzial von Mehrfrequenzradarsystemen f¨ ur die Ableitung von Schneegr¨oßenverteilung und Schneepartikelform mit Hilfe einer Simulation- sstudie untersucht. Verschiedene Streudatenbanken wurden kombiniert, um die G¨ ultigkeit des sog. Zweifrequenzansatzes zu untersuchen, welcher bislang auf Simulationen mit kugelf¨ ormi- gen oder ellipsoiden Partikelformen basierte. Es zeigte sich, dass dieses Verfahren durchaus abh¨ angig von der Schneepartikelform ist, wenn komplexe Schneepartikel in die Betrachtung miteinbezogen werden. Mit einer Kombination von drei Frequenzen konnten jedoch ver- schiedene Schneepartikelklassen deutlich voneinander unterschieden werden. Die Methode wurde abschließend noch hinsichtlich ihrer Einsetzbarkeit bei D¨ampfung des Radarsignals und verschiedener Schneepartikelgr¨ oßen untersucht.
Die Ergebnisse dieser Arbeit, basierend auf Beobachtungsdaten und Simulationsexperi-
menten, stellen klar heraus, dass simultane, bodengebundene Beobachtungen mittels in–situ
und Fernerkundungsinstrumenten weiter entwickelt werden m¨ ussen. Eine Erweiterung der
Sensitivit¨ atsstudien dieser Arbeit kann dazu beitragen, die optimale Kombination von Sen-
soren zur Schneefallbeobachtung zu definieren. Ein solcher Messdatensatz zusammen mit
weiterentwickelten Streudatenbanken, kann wesentlich dazu beitragen unser Verst¨ andnis der
Schneefallmikrophysik zu verbessern.
Contents
1 Introduction 1
1.1 Motivation . . . . 1
1.2 State of the Art . . . . 4
1.3 Focus of the present thesis . . . . 9
2 The TOSCA Campaign 13 2.1 Passive microwave radiometers . . . . 13
2.2 Radar systems . . . . 16
3 Snowfall Microphysics 21 3.1 Snow size distribution . . . . 21
3.2 Snow particle habit . . . . 23
3.3 Mass – size relation . . . . 27
3.4 Orientation . . . . 29
4 Radiative Transfer at Microwave Frequencies 31 4.1 Basic concepts . . . . 31
4.2 Absorption and thermal emission . . . . 33
4.3 Scattering . . . . 35
4.4 Radiative transfer equation for a plane–parallel atmosphere . . . . 40
4.5 Effective radar reflectivity factor Z e and attenuation . . . . 41
5 The Radiative Transfer Model RT3 and the Definition of Input Fields 43 5.1 Surface emissivity . . . . 44
5.2 Thermal emissions by gases . . . . 44
5.3 Liquid water emission . . . . 45
5.4 Snow scattering . . . . 45
6 Passive Remote Sensing of Snowfall 55 6.1 Case study: 08. February 2009 . . . . 56
6.2 Statistical analysis of T B enhancement . . . . 66
6.3 Outlook towards frequencies larger than 150 GHz . . . . 68
7 Active Remote Sensing of Snowfall between 20 and 95 GHz 71 7.1 Intercomparison: Cloudradar MIRA36 vs. MRR during snowfall . . . . 71
7.2 Single– and dual– frequency approach for snowfall . . . . 84
7.3 Triple – frequency approach . . . . 88
v
8.2 Outlook . . . . 97
List of Acronyms 101
Bibliography 103
Chapter 1
Introduction
1.1 Motivation
Frozen water in the atmosphere influences the global energy budget by changing the radiative properties of clouds, as well as the global water cycle, within the complex precipitation formation process. While the small particles “floating” in a cloud are commonly denoted as cloud ice, the precipitating particles are usually called snow or graupel 1 (Waliser et al., 2009).
A quantitative estimate of the percentage of global precipitation falling as snow is just recently available with the upcoming of suitable satellite sensors. Earlier studies have mostly been based on ship observations (Petty , 1995). Those studies provided global frequency maps of snowfall that revealed snowfall to be a common precipitation type over the northern and southern oceans at latitudes higher than 40 ◦ . For a global estimate of snowfall, however, satellite observations are inevitable. Unlike rainfall, quantitative estimates of global snowfall amount can only be obtained by highly sensitive active and passive systems. The most comprehensive insight into global cloud ice and snowfall distribution is provided by the Cloud Profiling Radar (CPR) on CloudSat (Stephens et al., 2002), which was launched in 2006.
Using a one year set of the CloudSat data, the first quantitative estimate of snowfall rate (SR) on a global basis was provided by Liu (2008b). While the frequency distribution of snowfall agrees well with the earlier ship observations, this study reveals the predominance of snowfall compared to the total amount of precipitation at latitudes higher than ∼40 ◦ with slight differences between northern and southern hemisphere (Fig. 1.1). The maximum SR has been estimated to 1 mm/day at the northern and 2 mm/day in the southern hemisphere.
In a similar study by Kulie and Bennartz (2009) the average global SR is estimated to be about 0.28 mmh −1 , while the authors note that snowfall retrievals are still affected by large uncertainties. By analyzing histograms of SR for different climatic regions they further found that the majority of snowfall events reveal light and medium SR in the range of 0.05 – 1.0 mmh −1 . The lowest SR were found over polar regions, particularly over Antarctica.
These results implicate that for an accurate estimate of global snowfall amount, remote sensing instrument with a high sensitivity to capture even light snowfall events and shallow cloud structures are required.
Snowfall reaching the ground surface is presumably for most people of major relevance, due to its manifold impacts on public life: Modern transport infrastructure is highly de-
1
Hail is neglected in this context due to its minor relevance for global precipitation.
1
Figure 1.1: (left) Zonally averaged total (line with filled circles) and solid (line with open circles) precipitation (snowfall) and (right) mean snowfall rate for (top) all surfaces, (middle) over ocean, and (bottom) over land observations. The distinction between solid and liquid precipitation is based on near–surface temperature. [extracted from Liu (2008b)]
pendent on accurate prediction of hazardous weather events — like heavy snowfall — that can cause high economic costs. Snow isolates and therefore protects plants from cold air temperatures. The amount of snow may thus influence harvest time in agriculture since it hampers the warming of the soil in springtime. Particularly in mountainous regions like the Alps, accurate prediction and observation of snow accumulation are relevant not only for tourism but also for avalanche warning services. The amount of accumulated snowfall over land has also an important reservoir–function in the hydrological cycle. If melting occurs, the estimated snow accumulation is a crucial parameter for water resource management and flood prediction.
Besides the more regional impacts, surface snowfall influences the global hydrological and energy cycle. Snowfall is a key quantity in the mass balance of the polar ice caps. A com- prehensive understanding of snowfall is thus essential to improve climate model predictions.
Snowfall has further been found to influence the global oceans: As the predominant type of precipitation at high latitudes (Fig. 1.1) snowfall cools and freshens the upper water layers.
Thus, it is assumed that snowfall can modify ocean surface buoyancy and deep water forma-
tion (Liu and Curry , 1997). As mentioned above snow covered surfaces isolate the underlying
surface from the air above. In this respect, accurate prediction of snow cover — which is
1.1. Motivation 3
Figure 1.2: (top) Tropical–averaged and (bottom) zonal–averaged annual mean cloud wa- ter content (CWC in mgm −3 ) profiles from CloudSat (left) and three model simulations [extracted from Su et al. (2011)].
closely connected to accurate snowfall estimates — plays an important role in the potential warming of permafrost soils in a warmer climate (Chapter 4, IPCC , 2007).
A surface covered with snow has a higher albedo 2 (typically 0.8 to 0.9 for fresh fallen snow) than snow–free surfaces. Large areas covered by snow thus alter the global energy budget by reflecting more energy back into the atmosphere. The higher albedo of snow–covered surfaces results in slower warming of the air above and therefore yields in different heating rates at the lowest atmospheric layers (e.g. Groisman et al., 1994). A quantitative analysis of the global impact of terrestrial snow cover on temperature and atmospheric dynamics is given by Vavrus (2007): In an experiment with a global climate model (GCM) all snowfall over land was converted into its liquid water equivalent before reaching the surface. The simulation without snow cover produced 5 K higher mean–annual surface air temperatures over North America and Eurasia and an 8–10 K rise in temperatures during wintertime, compared to the control run. The absence of snow on the earth’s surface also affected upper–air circulation patterns and the frequency of extreme weather events. Different snowfall amounts resulting in varying snow cover have also an impact on large scale precipitation systems: The Eurasian snow cover in the springtime has been found to be linked to the strength of Asian summer monsoon as well as to the atmospheric pressure field over Northern America (Barnett et al., 1988).
In addition to the various impacts of surface snowfall for regional and global climate, understanding snowfall also helps understanding the process of the formation of “cold cloud”
rainfall. This rain formation process is particularly common for mid and high latitudes.
The cloud region above the freezing level is characterized by exceedingly complex interac- tions of cloud liquid water droplets, floating ice particles and sedimenting snow. While first attempts have been made towards more sophisticated representation of ice microphysics in
2
Albedo is the ratio of reflected to incoming (solar) radiation.
numerical weather prediction (NWP) models (Lynn et al., 2005; Seifert and Beheng , 2006), these complex mechanisms are currently still poorly represented in global climate models.
In many of those models snowfall is neglected or only a diagnostic variable. Consequently, the spatial distribution and global average amount of cloud ice predicted by climate models has been found to deviate dramatically from satellite observations (Waliser et al., 2009; Su et al., 2011). The disregard of snowfall can have significant effects on the radiation balance as investigated by (Waliser et al., 2011). Their analysis of CloudSat observations (Fig. 1.2) reveals a high concentration of ice and snow particles at high latitudes as well as in equatorial regions at heights above 500 hPa. This high concentration of ice in the equatorial region is associated with anvils of mesoscale convective systems. The authors found that an exclusion of precipitating snow and graupel can result in an underestimation of reflective shortwave flux at the top of the atmosphere. Additionally, the vertical shortwave and longwave heating rates can deviate up to 10 %, particularly in the most convective areas.
1.2 State of the Art
Given the enormous uncertainties in the prediction of snowfall in NWP and climate models and then again, the importance of snowfall for the hydrological cycle and global energy budget, global and reliable observations of snow water distribution are essential. Accurate surface–based in situ measurements of snowfall are only sporadically available around the globe; most operational stations only provide cumulative amounts of snowfall over the range of hours. Even for these measurements many problems, such as wind–induced error, have been identified to be severe (Sevruk et al., 2009). In–situ measurements within ice and snow clouds provided by airborne observations give an insight into microphysical processes and the variability of particle habits, amount of super–cooled liquid water and particle size distributions for different cloud systems (e.g. Heymsfield et al., 2002; Field et al., 2005).
However, such observations can only deliver “snapshots” with extremely limited spatial and temporal extent. As a matter of fact, remote sensing methods are the only means suited for the purpose of global snowfall data because they are able to provide continuous observations with high temporal resolution and broad spatial coverage.
Common remote sensing techniques
While visible and infrared satellite remote sensing observations have been available for decades and also have been widely used to investigate cirrus clouds, they show poor accuracy for clouds with high amounts of integrated ice water path (IWP) (e.g. Eliasson et al., 2011). In fact, visible and infrared techniques tend to be most sensitive to the cloud top because of their intrinsic incapability of sounding deeply within the cloud structure (Fig. 1.3). Observations in the microwave (MW) region, however, usually defined as the frequency range between 0.3 and 300 GHz (i.e. wavelength of 1 m to 1 mm), are even able to penetrate a cloudy atmosphere.
Frequencies along the wings of characteristic absorption lines are utilized to derive profile
information of temperature and water vapor. Column integrated amounts of water vapor and
liquid water can be derived due to their frequency dependent emissions. Within atmospheric
window regions, i.e. frequency regions with comparably low atmospheric optical thickness,
scattering effects of ice and snow particles, which are related to the total ice water content,
can be observed. For this reason, many efforts have focused on passive and active MW
1.2. State of the Art 5
Figure 1.3: Schematic figure of a thick cloud. The columns indicate approximately where the different remote sensing techniques are sensitive [extracted from Eliasson et al. (2011)]
techniques for the observation of snowfall. Yet, only for the last few years observational data have been made available on a global scale.
Numerous remote sensing methods for deriving rainfall from satellite sensors using passive microwave radiometry have been developed over the years and are being routinely applied (e.g. Kummerow et al., 1996; Weng et al., 2003). A breakthrough for retrieving rainfall rates in the tropical regions was the launch of the Tropical Rainfall Measurement Mission (TRMM) satellite in 1997, which combines an active precipitation radar operating at 13.8 GHz and passive microwave sensors at 10.7, 19.4, 21.3, 37.0 and 85.5 GHz (Iguchi et al., 2000). In contrast, remote sensing methods for deriving snowfall are much less sophisticated and suffer from large uncertainties.
Since 2006 vertically resolved reflectivity data from the nadir-viewing 94 GHz radar CPR on the CloudSat (Stephens et al., 2002) satellite are available. In addition to rainfall ob- servation the high sensitivity of the CPR allows deriving vertical profiles of frozen hydrom- eteor content. Passive observations (commonly shown as brightness temperatures, T B ) at atmospheric window channels (e.g. 89 and/or 150 GHz) are provided by the Special Sensor Microwave Imager (SSM/I) flown on the Defense Meteorological Satellite Program (DMSP), the Microwave Humidity Sounder (MHS) onboard the NOAA 18 and MetOp-A satellites, the Advanced Microwave Sounding Units (AMSU-A/B) onboard the NOAA 15-17 satellite and the Advanced Microwave Scanning Radiometer EOS (AMSR-E) onboard the NASA AQUA satellite.
Basic issues of snowfall retrievals
In fact, any snowfall retrieval based on passive, active or combined sensors is dependent on
assumptions about crystal habit and snow size distribution (SSD) that have a large impact on
the radiative properties and hence the quality of the retrieval. Following the argumentation
given in Petty and Huang (2010), two equally essential parts required for any snowfall retrieval
approach can be specified: 1) A detailed and validated statistical description of the cloud
microphysics is needed including the distribution of liquid water, snow particle sizes, habits
and densities under varying atmospheric conditions; 2) The microphysical characteristics have
to be transferred into electromagnetic properties which allows to relate the physical quantities to the measured variables like radar reflectivity factor or T B . While significant progress has been made regarding 2) there is still a lack of observations leading to large uncertainties for the requirement 1). It has to be considered that for the development of e.g. temperature and humidity retrievals a comprehensive global dataset of radio soundings and reanalyzes from NWP models exist. In contrast, in–situ measurements of vertical profiles of liquid and snow water as well as particle size distribution and particle habits are still rare. Existing datasets are mostly based on aircraft observations (e.g. Heymsfield et al., 2002; Field et al., 2005) however, suffering from the aforementioned problem of limited spatial and temporal coverage.
Recently, existing aircraft in–situ datasets have been analyzed and found to contain spurious large amounts of small particles, while larger snow particles are underestimated (Korolev and Isaac , 2005; Field et al., 2006; Korolev et al., 2011). The effect has been explained by shattering of ice particles at the housing of the in–situ (mostly optically) probes which raises the question how reliable existing aircraft in–situ datasets are. NWP models are currently not an alternative to in–situ observations since they have been found to poorly represent spatial fields of ice and snow (e.g. Reitter et al., 2011) and do usually contain only rather simplified parameterizations of snow particle habit and SSD.
Snow particle habit and scattering properties
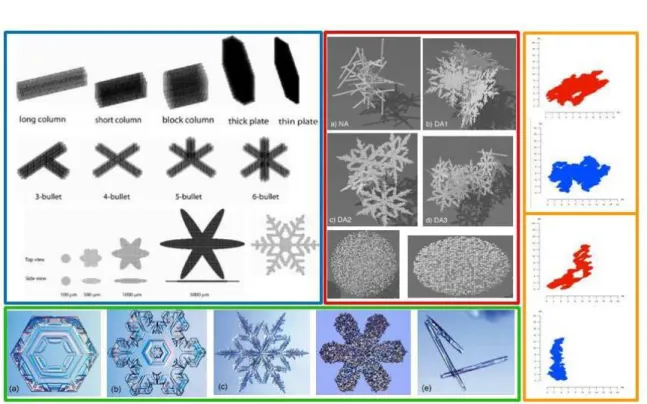
The development of realistical snow particle models mentioned in point 2) is further depen- dent on the observational data summarized in point 1): A database of in–situ observations of various clouds is needed to derive e.g. realistical ice particle models. Such particle mod- els can then be utilized to derive their specific scattering properties. Currently, existing scattering databases are under rapid development; recent progress in simulation of complex habits is mainly due to increasing available computational resources. In the last decades, it was common to use spheroids composed of solid ice or an ice-air mixture (“soft sphere”) (e.g. Skofronick-Jackson et al., 2003; Hogan et al., 2006) which allowed to efficiently com- pute scattering properties with Mie theory (Section 4.3.2). With the increase of available computational power, several efforts have been made to replace spherical approximations by more realistical ice crystals. The majority of these crystals were idealized and symmetri- cal (pristine) crystals such as hexagonal columns, plates, rosettes or dendrites (Liu , 2004;
Evans et al., 2005; Seo and Liu, 2005; Noh et al., 2006; Kim, 2006; Hong, 2007a; Grecu and Olson , 2008). Ground–based and airborne observations, however, revealed (e.g. Heymsfield et al., 2002; Brandes et al., 2007) that natural snow is dominated by non–pristine particles and crystal aggregates. The maximum size range in most particle models was limited to 5–10 mm while in–situ observations indicate a maximum size of 1–2 cm (Brandes et al., 2007;
Kneifel et al., 2010). These particles are especially relevant for radar applications since radar
quantities are particularly sensitive to large particles. Even a few large particles in the obser-
vational volume have a significant influence on the radar signal. Consequently, first studies
started quiet recently to investigate the scattering properties of large aggregate snowflakes
consisting of fractals (Ishimoto, 2008; Tyynel¨ a et al., 2011) or aggregates of pristine crystals
like dendrites or needles (Petty and Huang , 2010; Botta et al., 2010). Even if there remain
large uncertainties about the most appropriate particle habit model, the spheroid particle
models have thoroughly been found to be incapable to represent scattering parameters of
snow particularly with regard to its wavelength dependence and the backscatter–extinction
ratio.
1.2. State of the Art 7 Snow size distribution
Besides the particle habit which intrinsically includes the particle’s density or mass–size rela- tion, the SSD within a given volume is another critical parameter that needs to be specified.
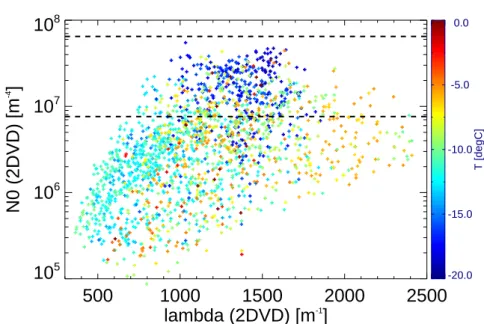
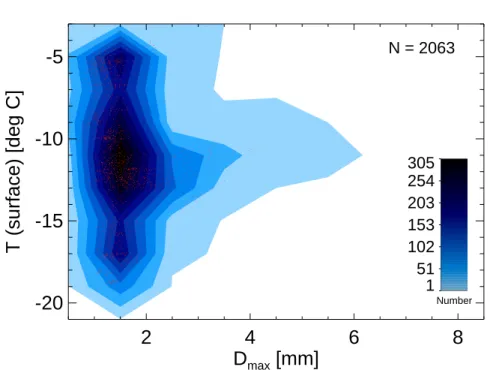
Analyses of several airborne datasets revealed that cloud temperature can be utilized to de- termine parameters of the SSD (Field et al., 2005, 2007). In general, the findings indicate higher concentrations of small particles at cold temperatures compared to warmer temper- atures. This temperature dependent parameterization of the SSD was found to improve modelled cloud properties if compared to fixed SSD parameterizations (e.g. B¨ ohme et al., 2011). For snowfall sampled at the ground it has been found that the Field parameterization tends to underestimate large snow particles (Brandes et al., 2007; L¨ ohnert et al., 2011) which might be related to processes like sublimation of small crystals or continued aggregation be- low the cloud or — as mentioned before — due to shattering effects at the in–situ probes.
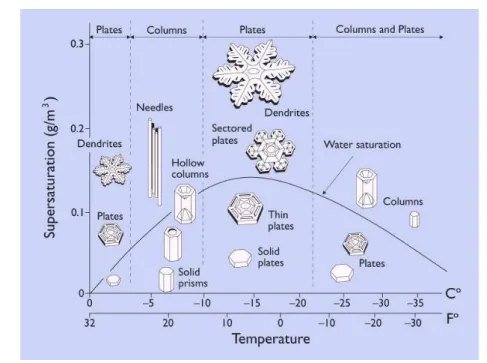
Furthermore, the currently temperature dependent SSD parameterizations do not include a well known effect called secondary aggregation region which has been found between -10 and -15 ◦ C (Hobbs et al., 1974; Hosler and Hallgren , 1960; L¨ ohnert et al., 2011). In this tem- perature region supersaturation over ice with respect to liquid water reaches its maximum value (e.g. Pruppacher and Klett , 1997, 119 pp.) leading to effective diffusional growth of ice crystals from evaporating liquid water drops. Further, snow crystals within this temperature range are mostly of dendritic structure (e.g. Libbrecht , 2005) which leads to increasing stick- ing efficiency and thus larger aggregates. It can be expected that further development of the temperature dependent SSD including e.g. the secondary aggregation region will increase the accuracy of SSD parameterizations.
Super–cooled liquid water
Observations of snow (e.g. Hiley et al., 2011; L¨ ohnert et al., 2011) and ice clouds (e.g. Boudala et al., 2004) revealed the frequent presence of super–cooled liquid water (SLW) — i.e. liquid water below 0 ◦ C — that can be found at temperatures down to -37 ◦ C before spontaneous homogeneous freezing occurs. Particularly higher MW frequencies (>90 GHz) that are used for snowfall retrievals are affected by SLW due to its increasing emissivity with frequency.
Emission from SLW can partly mask snow scattering received by passive sensors while it also contributes to the total attenuation of radar signals — especially at increasing frequencies (e.g. the 94 GHz CPR at CloudSat). For a correct treatment of SLW the vertical profile of liquid water content (LWC) is needed in order to account for the temperature dependence of liquid water emission. However, even with a perfect knowledge of the LWC profile an accurate radiative transfer is difficult due to the still poorly known refractive index of SLW at MW frequencies (M¨ atzler , 2006, p. 431-455). The different refractive index models (e.g.
Ray , 1972; Liebe et al., 1991; Stogryn et al., 1995; Ellison, 2007) are based on measurements in the positive temperature region. Thus, the values for temperatures below freezing are extrapolations except for single measurements at specific frequencies (Bertolini et al., 1982).
The uncertainties of refractive index models have been identified to be one of the major
sources of uncertainties in retrievals of SLW especially if frequencies ≥ 90 GHz are considered
(Cadeddu and Turner , 2011).
Radar snowfall retrievals
Vertical profiles of snow cloud properties like snow water content (SWC) or snowfall rate (SR) have been usually derived using single frequency radars. Several recent studies (Liu, 2008b;
Kulie and Bennartz , 2009; Hiley et al., 2011) investigated the sensitivity of single frequency spaceborne radar retrievals to snow particle model and SSD parameters. These studies show that derived SR from single frequency radar observations exhibit a large range of uncertainty caused largely by the lack of knowledge of snow microphysical parameters. Derived SR uncertainties from single frequency radar data generally exceed 50–75 % depending on the microphysical assumptions employed. An improvement in deriving snow quantities by radar can be achieved using a dual frequency approach (Matrosov , 1998). For ice and mixed–phase clouds, several studies analyzed collocated in–situ and radar measurements and revealed clear improvements obtained by using dual frequency techniques (Gosset and Sauvageot, 1992; Hogan et al., 2000; Heymsfield et al., 2008). Usually the frequencies are chosen with one frequency in the Rayleigh scattering regime (4.3.1) (e.g., S–, C–, X–band) and the other in the Mie regime (4.3.2) (e.g., K a –, W–band). Various studies have used soft spheres to generate representative scattering properties of snow particles (Matrosov , 1992; Liao et al., 2005, 2008). These dual–frequency investigations found a simple power law relation between the characteristic size of the SSD and the logarithmic reflectivity difference, also known as the dual wavelength ratio (DWR). This power law relation is almost independent of snow density.
In an attempt to develop more realistic models as proxies for falling snow, spheres have been replaced by spheroids (Matrosov , 1998, 2007) with a certain aspect ratio (i.e. ratio of shortest to longest dimension) to represent snow scattering properties. It has been shown that the dual frequency approach is a clear improvement over the single frequency approach. However, as Matrosov (1998) points out, a priori knowledge of the snow density is still needed as a tuning parameter in order to derive mass related quantities like SR. These studies revealed that while DWR is insensitive to snow density for spheres, it is sensitive to the chosen aspect ratio (Matrosov et al., 2005a), thus highlighting the importance of ice habit for DWR calculations.
Recent studies (Sekelsky et al., 1999; Gaussiat et al., 2003; Yoshida et al., 2006) have also employed triple–wavelength approaches to distinguish different crystal shapes in ice clouds.
In Yoshida et al. (2006), the authors focus on non–precipitating ice and mixed–phase clouds and consider comparably small ice spheres and hexagonal ice particles (maximum equivalent ice spheres radius of 500 µm) with varying aspect ratios. Their modelling results show that a distinction between different ice crystal habits is possible with the triple–frequency approach, however, a very high accuracy of the DWR measurements (better than 0.1 dB) is needed.
Admittedly, this accuracy is rather unrealistic to achieve with current cloud radar systems.
Passive–only and combined passive-active snowfall retrievals
While the radar derived hydrometeor content is related to the signal strength of the backscat-
tered radar pulse from hydrometeors, the passive signal is related to the vertically integrated
scattering properties of the entire atmospheric column. In a cloud–free case the passive sig-
nal received by a spaceborne sensor is dominated by atmospheric gases and the upwelling
thermal radiation from the earth’s surface. Thick ice and snow clouds have been found to
significantly reduce the signal of the thermal radiation at frequencies greater than ∼90 GHz
(e.g. Katsumata et al., 2000; Bennartz and Petty, 2001; Bennartz and Bauer , 2003). This
T B depression is caused by the increase of scattering by frozen hydrometeors with increasing
frequency and hydrometeor size. Thus, the scattering effects can be used to derive integrated
1.3. Focus of the present thesis 9 snow water path (SWP) (e.g. Noh et al., 2006), but are not able to provide any informa- tion about vertical ice distribution. Additionally, those passive–only retrievals suffer from large uncertainties exceeding 60% (Kulie et al., 2010) mainly related to the microphysical uncertainties mentioned above.
Passive MW measurements and radar reflectivities show different sensitivities to micro- physical snowfall parameters: While the sensitivity of the reflectivity signal on particle habit strongly increases at frequencies larger than ∼35 GHz, the passive T B are in general more sensitive to the SWP (e.g. Petty and Huang , 2010). A combination of both techniques can thus be expected to reduce retrieval uncertainties while including vertical profile information.
Radar data and passive MW observations have been combined in several studies: Noh et al.
(2006) and Seo and Liu (2005) applied different radar reflectivity – SWC relations based on single–frequency radar data to ground–based and airborne datasets. The SWC profiles have been utilized to build realistic a priori datasets (i.e. characteristic profile and variability of the snow quantities) and to finally develop snowfall retrievals based on passive MW obser- vations for frequencies between 89 and 220 GHz. Kulie and Bennartz (2009) used CloudSat observations and a comprehensive set of snow particle habits to simulate passive observa- tions between 36 and 157 GHz. The simulated T B have been compared to collocated satellite observations which allowed excluding particle habits with systematic higher/lower scattering properties. The authors applied solely the Field et al. (2005) SSD parameterization and thus the influence of potential errors introduced by the SSD could not be discussed. Combined retrieval algorithms of SWC and characteristic snow particle size have been derived based on airborne radar and passive observations by Skofronick-Jackson et al. (2003) for tropical convective clouds and by Grecu and Olson (2008) for snowstorms over the ocean. A clear result of these studies is that a significant improvement of snowfall retrievals can be obtained by combining passive and active MW observations using multiple frequencies. The retrievals are, however, still highly sensitive to the a priori data, the microphysical assumptions and the scattering models used for simulating T B and radar reflectivities.
A key problem hampering the development of both better particle scattering models and snowfall retrievals is the lack of simultaneous in–situ observations of snowfall microphysics combined with measurements of radiative properties. While in–situ observations are impos- sible to obtain with satellite sensors, airborne in–situ observations are difficult to match with ground–based or other aircraft remote sensing data. Although ground–based observations can not provide broad spatial coverage they allow collecting long–term datasets of both remote sensing observations and in–situ measurements — at least for the lowest cloud layers. Thus, ground–based observations can help to further constrain and improve snowfall retrievals that can finally be applied to satellite sensors. Most analyses within this thesis are based on such a ground–based dataset collected at an alpine site which will be described in the following chapters.
1.3 Focus of the present thesis
The majority of combined remote sensing and in–situ observations of snowfall and snow clouds have been obtained by airborne sensors. Similarly, most snowfall retrievals have been developed for the downward looking observation geometry of airborne or spaceborne sensor.
The overall question of the present study is which information content about snow clouds can
be gained by ground–based MW remote sensing observations. In order to answer this question
passive and active remote sensors have been deployed together with in–situ instruments within the Towards an Optimal estimation based Snow Characterizing Algorithm (TOSCA) project during winter 2008/2009 at the “Umweltforschungsstation Schneefernerhaus” (UFS) in the Bavarian Alps.
The unique atmospheric conditions at the UFS together with the considerably large fre- quency range from 22 to 150 GHz covered by the deployed passive microwave radiometers (MWR) make it possible to analyse potential signatures of snowfall in passive MW measure- ments. Similar to the well known T B depression found in downward looking measuring sensors an analogous T B enhancement at ground–based high frequency MW observation is expected but has not been reported yet by other authors. The large set of additional sensors like e.g.
ceilometer, cloud radar, in–situ sensors and nearby radiosonde ascents will be used within a case study to reconstruct the atmospheric state. This information is then combined with state–of–the–art scattering databases of realistical snow particle habits to simulate ground–
based T B at the considered frequencies. This allows to quantify the snow scattering effect and to compare the signatures with nadir measuring geometry. The simulation results will further be tested with respect to their sensitivity to snow particle habit, SSD parameters, ground surface emissivity and vertical liquid water distribution. Within a statistical analysis of the entire TOSCA time period it will be investigated whether the T B enhancement remains a robust effect even if completely different snowfall events are considered. Based on the ob- servational and simulation results it will be theoretically investigated which information can be gained from ground–based observations at higher MW frequencies up to 340 GHz that are already used e.g. for aircraft campaigns. Herein, specific attention will be given to the relation of liquid water emission and snow particle scattering.
The other major focus of this study is active MW remote sensing. In contrast to ground–
based passive MW observations several studies already presented single and dual–frequency cloud radar observations of snowfall. Therefore, this study concentrates on two new aspects of active remote sensing of snowfall: The first aspect is motivated by the simultaneous mea- surements of a small low–power radar together with a high–end cloud radar during TOSCA.
High power systems that need frequent maintenance are often not suitable for remote areas
like e.g. mountainous regions or arctic environments. However, measurements of snowfall and
snow cloud structure from those regions are of particular scientific relevance. Thus, it will be
investigated what information content about snowfall can be obtained by a low–end system
that is usually applied for rainfall measurements. Specific algorithms for snowfall observa-
tions will be developed and applied to the available measurements. From the simultaneous
measurements of the cloud radar the sensitivity level of the low–end radar can be derived and
compared with a clear–sky technique. The impact of the limitations of the low–end system on
estimates of accumulated snow amount and snowfall rate will be explored using the long–term
data form the high–end cloud radar together with different standard radar reflectivity – SR
relations. The second aspect regarding active MW remote sensing is related to the important
question which microphysical information can be gained from multi–frequency radar observa-
tion. Dual–frequency techniques have already been developed with help of spheroid particle
scattering models and their ability to derive SSD parameters like the characteristic particle
size has been demonstrated. In a first step this “classical” dual–frequency technique will be
repeated with a set of non–spheroid particle models that have become available, quiet re-
cently. With the various particle habits the dual–frequency techniques will be examined with
respect to their applicability to non–spherical particle habits. The theoretical study will be
further extended towards a third frequency in order to investigate whether a triple–frequency
1.3. Focus of the present thesis 11 approach can be utilized to distinguish between different particle habits.
Outline of the thesis
The present thesis is structured as follows: In Chapter 2 the measurement site UFS and the TOSCA campaign will be described. The available observation time periods during snowfall are summarized and the deployed instruments will be described in detail with a special focus on the passive microwave radiometers and radar systems. A compact summary of the microphysical properties of snowfall that have the largest influence on radiative transfer, namely SSD, snow particle habit, mass–size relation and snow particle orientation, will be given in Chapter 3. The subsequent Chapter 4 introduces the reader to the basic concepts of radiative transfer at MW frequencies including the description of typical scattering regimes and variables which are needed for the remaining chapters. The radiative transfer model for simulating passive T B as well as the definition of various input fields is described in detail in Chapter 5. The radiative transfer simulations are compared to measurements within a case study in Chapter 6. The comparison includes several sensitivity experiments with varying SSD parameters, particle habits, ground surface emissivities and vertical liquid water distribution. The case study is followed by a short statistical analysis of the snow scattering effect and will be closed with a discussion about the benefit that can be expected from passive observations at increasing frequencies between 150 and 340 GHz. In Chapter 7 the focus shifts to active remote sensing techniques. In the first part of Chapter 7 a comparison of a low–power radar system and a high–end cloud radar is presented together with an analysis of the impact of the limitations on snowfall rate and total snow accumulation. The second part describes a theoretical study within the applicability of the dual–frequency approach to non–spherical particles is explored. Finally, a new approach is presented extending the dual–
frequency approach towards a third frequency in order to potentially distinguish between different snow particle habits. A summary of the results of this thesis is given together with an outlook on future research in Chapter 8.
The analysis of snow scattering signals in ground–based passive MW observations Chap- ter 6 has been published in:
Kneifel, S., U. L¨ ohnert, A. Battaglia, and S. Crewell, and D. Siebler, Snow scattering signals in ground–based passive microwave radiometer measurements, J. Geophys. Res., 115, D16214, 2010.
Radiative transfer simulations and statistical analyses of the TOSCA dataset (similar to the analysis presented in Chapter 6 have been contributed to:
L¨ ohnert, U., S. Kneifel, A. Battaglia, M. Hagen, L. Hirsch, and S. Crewell, 2011: A Multisensor Approach Toward a Better Understanding of Snowfall Microphysics: The TOSCA Project. Bull. Amer. Meteor. Soc., 92, 613–628, 2011.
The capabilities of a low–power K–band radar for snowfall observations (Chapter 7) have been described in:
Kneifel, S., M. Maahn, G. Peters, and C. Simmer: Observation of snowfall with a low-
power FM–CW K-band radar (Micro Rain Radar), Meteorol. Atmos. Phys., 113, 75–87,
2011.
A theoretical study of the applicability of the dual–frequency approach to non–spheroid snow particles together with an extension towards a triple–frequency approach (Chapter 7) has been published in:
Kneifel, S., M. S. Kulie, and R. Bennartz: A triple-frequency approach to retrieve mi-
crophysical snowfall parameters, J. Geophys. Res., 116, D11203, 2011.
Chapter 2
The TOSCA Campaign
The observational data used in this study have been collected during the TOSCA campaign (L¨ ohnert et al., 2011). During TOSCA, a comprehensive set of ground–based instrumentation has been deployed at the Umweltforschungsstation Schneefernerhaus (UFS) in the winter season 2008/2009. The UFS is situated just ∼310 m below the peak of Germany’s highest mountain (Zugspitze, 2969 m MSL) located at 47.42 ◦ N and 10.98 ◦ N. UFS is ideally located for snow observation thanks to the frequent occurrence of snowfall and to the presence of low water vapor amounts (typically integrated water vapor content (IWV) <6 kgm −2 during wintertime). The latter is of interest because the dry atmospheric conditions provide a cold background for scattering signals originating from snow particles.
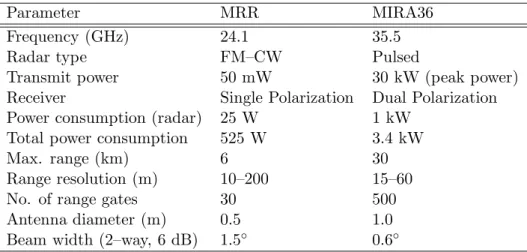
The remote sensing instrumentation combined active radar systems at 24.1 and 35.5 GHz with passive microwave observations in the frequency range from 20 to 150 GHz. The dataset was complemented by optical disdrometers, nearby radiosonde ascents (Radio sounding sta- tion Innsbruck and M¨ unchen-Oberschleißheim) and several standard meteorological measure- ments provided by the German Weather Service (DWD). Table 2.1 gives an overview of the operation time periods for single instruments and also for instrument combinations. Further details about the TOSCA campaign, the instrumentation and available data periods can be found online http://gop.meteo.uni-koeln.de/tosca/doku.php or in the overview article by L¨ ohnert et al. (2011). Since this study focuses on passive and active remote sensing, the passive microwave radiometers and the two radar systems will be described in more detail in the following subsections.
2.1 Passive microwave radiometers
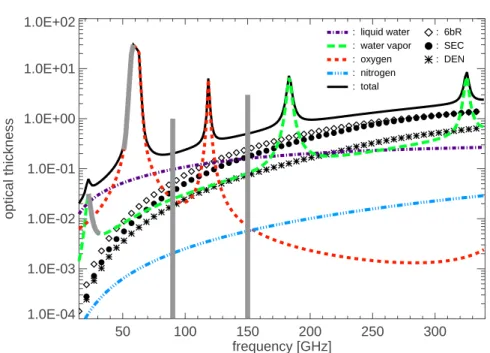
Two MWR manufactured by Radiometer Physics GmbH (RPG) were deployed: a Humidity and Temperature PROfiler (HATPRO) (Rose et al., 2005) and the Dual Polarization Ra- diometer (DPR) (Turner et al., 2009) — comprising in total 17 channels in the frequency range from 22 to 150 GHz. The microwave profiler HATPRO (Fig. 2.1) was designed as a network–suitable low–cost radiometer, which can observe LWP, humidity and temperature profiles with high temporal resolution up to 1 s. HATPRO consists of total–power radiometers utilizing 14 direct detection receivers within two bands, 22.235–31.4 GHz and 51.26–58.0 GHz (Fig. 2.2). The measurements are averaged onto a one second temporal resolution. The seven channels of the lower frequency band contain information on the vertical profile of humidity through the pressure broadening of the optically thin 22.235 GHz H 2 O line, and therefore also
13
Table 2.1: Instrument availability (quality controlled) during snowfall times of the TOSCA 2008/2009 measurement campaign. About 1218h of snowfall were registered, corresponding to about 25% of the total campaign time [after L¨ ohnert et al. (2011)]
% of total
Instrument(s) No. of hours snowfall time
Total hours of snowfall 1218 100
HATPRO + DPR 361 30
MIRA36 1118 92
2D-Video Disdrometer (2DVD) 348 29
HATPRO + DPR + MIRA36 340 28
HATPRO + DPR + 2DVD 132 11
MIRA36 + 2DVD 336 28
HATPRO + DPR + 2DVD + MIRA36 132 11
about the vertical IWV content. Simultaneously, LWP can be derived from cloud water emis- sion which increases with frequency (Fig. 2.2). Using multi–linear regression (L¨ ohnert et al., 2001) IWV and LWP can be derived with accuracies better than 0.7 kgm − 2 and 20 gm − 2 , respectively. For the retrieved humidity profile it has been found that the vertical profile contains only two to three independent layers mainly due to the relatively weak water vapor line at 22.235 GHz (L¨ ohnert et al., 2009). The seven channels of the higher frequency band contain information on the vertical profile of temperature due to the homogeneous mixing of O 2 throughout the atmosphere. At the opaque center of the O 2 absorption complex at 60 GHz, most of the information originates from near the surface, whereas further away from the line, the atmosphere becomes less opaque. Therefore, an increasing amount of informa- tion also originates from higher atmospheric layers. The accuracy of the derived temperature profile can significantly be improved to less than 1 K at heights below 1.5 km, if elevations scans are included in the retrieval (Crewell and L¨ ohnert, 2007). In order to ensure that mea- surements at low elevation angles (down to 5 ◦ ) are not contaminated by surface emissions, HATPRO has antenna half power beam widths (HPBW) of 3.5 ◦ (2 ◦ ) at the lower (higher) frequency channels with a side lobe suppression better than 30 dB.
The DPR (Fig. 2.1) is a three–channel system that performs observations at the window frequencies 90 and 150 GHz (Fig. 2.2), also frequently used by satellite instruments. It uses direct detection at 90 GHz, whereas the 150 GHz channels are heterodyne systems 1 . A wire grid is used to separate the polarizations at the latter frequency, so both the vertical and the horizontal polarization can be measured separately and simultaneously. In order to conserve the plane of polarization during elevation scanning, the DPR is mounted on a rotating horizontal axis. The DPR performs continuous zenith observations at a temporal resolution of 1 s that are interrupted by elevation scans every ten minutes including nine elevation angles between zenith and 15 ◦ elevation angle. The HPBW of the DPR antenna is slightly smaller compared to HATPRO with 1.8 ◦ and 1.5 ◦ at 90 and 150 GHz, respectively.
Besides the ability of the DPR to detect snow scattering signals which will be discussed later in this study, it has been shown that the combination of HATPRO and DPR can
1
In a heterodyne receiver, the received frequency is mixed with a constant frequency from an oscillator to
a lower frequency before detection.
2.1. Passive microwave radiometers 15
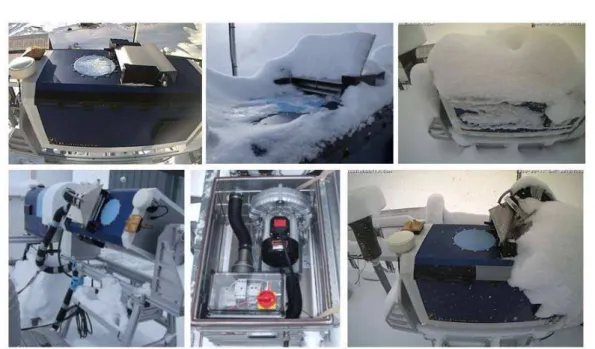
Figure 2.1: Overview over instruments deployed at (middle) UFS located ∼300 m below the summit of mountain Zugspitze in the German Alps during the TOSCA campaign in the winter season 2008/2009: (middle left) Microwave profiler HATPRO; (bottom left) – (bottom right) 10–m meteorological mast, 2DVD, Ceilometer, MRR, PARSIVEL disdrometer; (middle right) 35.5 GHz cloud radar MIRA36; (top right) 90/150 GHz dual-polarization microwave radiometer DPR. [from L¨ ohnert et al. (2011)]
significantly enhance the accuracy of LWP retrieval especially for LWP values lower than 100 gm − 2 (Crewell and L¨ ohnert, 2003; Zink , 2010).
Both radiometers are occasionally calibrated by viewing a liquid–nitrogen target, and the observations from this target and the internal blackbody are used to determine the noise source temperature (in case of HATPRO), system noise temperature, and the gain. Since the noise source and the system noise temperature are assumed to be highly stable, RPG recommends liquid–nitrogen calibration at the beginning of a deployment and every few months after that. However, the gain is updated every few minutes by interrupting the atmospheric observations and viewing an internal blackbody target at ambient temperature.
HATPRO also performed regularly scheduled tipping scans (Han and Westwater , 2000) for its channels in the range from 22.24 to 31.4 GHz. These were automatically evaluated by the operational radiometer software to update the calibration in case the sky was determined to be homogeneous and cloud free. The resulting absolute T B accuracy of HATPRO and DPR is estimated to be 1 K, while the radiometer noise is 0.2 K for HATPRO and 0.7 K for the DPR.
To ensure a high quality of the measured MWR data, it is essential not only to have precise calibrations but also to keep the radome completely free of liquid or frozen water.
For that purpose, both radiometers are regularly equipped with heated blower systems. The
curved shape of the HATPRO radome, together with the continous sideward airflow, avoids
the accumulation of snow on the radome and is able to evaporate any liquid residuals of
former rain or heavy snow showers. Unlike HATPRO, the shape of the DPR radome is a
plane circle of 18 cm diameter and thus, precipitation can more easily accumulate. During the
campaign, the original axial blower system (Fig. 2.3) of the DPR was found to be insufficient
during snowfall. As a consequence a completely new blower concept has been designed and
50 100 150 200 250 300 frequency [GHz]
1.0E-04 1.0E-03 1.0E-02 1.0E-01 1.0E+00 1.0E+01 1.0E+02
optical thickness
: 6bR : SEC : DEN : liquid water
: water vapor : oxygen : nitrogen : total
![Figure 5.1: Mass absorption κ a [m 2 kg −1 ] of single particles as a function of particle mass [mg] for (top left) 13.4 GHz, (top right) 36.5 GHz, (bottom left) 89.0 GHz, and (bottom right) 160 GHz](https://thumb-eu.123doks.com/thumbv2/1library_info/3694249.1505701/59.892.179.716.146.531/figure-mass-absorption-single-particles-function-particle-right.webp)
![Figure 5.2: Same as Fig. 5.1, but for mass extinction κ e [m 2 kg − 1 ] and without solid ice spheres](https://thumb-eu.123doks.com/thumbv2/1library_info/3694249.1505701/60.892.177.730.132.530/figure-fig-mass-extinction-κ-solid-ice-spheres.webp)
