DOI 10.1007/s00227-016-2892-0 ORIGINAL PAPER
Temporal dietary shift in jellyfish revealed by stable isotope analysis
Jamileh Javidpour1 · Ashlie N. Cipriano‑Maack2 · Agnes Mittermayr3 · Jan Dierking1
Received: 24 November 2015 / Accepted: 10 April 2016
© The Author(s) 2016. This article is published with open access at Springerlink.com
capillata, its isotope composition remained stable and was consistent with a mainly mesozooplanktonic diet. Mixing model output, mainly driven by δ34S values, indicated a lower proportion of A. aurita in the diet of C. capillata than previously reported, and thus to a potentially lesser impor- tance of intraguild predation among jellyfish in the Kiel Fjord. Overall, our results clearly highlighted the potential for substantial intraspecific isotopic seasonal variation in jellyfish, which should be taken into account in future feed- ing ecology studies on this group.
Introduction
Global awareness has been drawn to the increase in jel- lyfish blooms due to their possible negative impacts on ecosystem goods and services, such as interference with tourism, aquaculture, fishing operations and coastal indus- trial intakes (Richardson et al. 2009; Condon et al. 2012).
Population outbreaks of carnivorous jellyfish account for severe impacts on marine food webs, driven by a rapid pop- ulation growth rate in combination with a highly success- ful competition for food sources (Hay 2006; Gibbons and Richardson 2013). Populations of Aurelia aurita medusae have been known to consume roughly two-thirds of daily secondary production (mainly copepods) and thus compete with fish larvae for resources in the Kiel Bight, Baltic Sea (Behrends and Schneider 1995; Schneider 1989). In order to determine the ecological role and impact of jellyfish on marine food webs, it is important to gain a thorough under- standing of their trophic ecology by comprehending both the formation and structure of their blooms, as well as their likely role in the transfer of carbon and energy in the marine food web (Pitt et al. 2009).
Abstract A temporal change in the stable isotope (SI) composition of jellyfish in the Kiel Fjord, Western Baltic Sea, was documented by analyzing δ13C, δ15N and δ34S of bell tissue of Aurelia aurita and Cyanea capillata in the period between June and October 2011. A strong and sig- nificant temporal change in all SI values of A. aurita was found, including an increase of ~3 ‰ in δ13C, a decrease of ~4 ‰ in δ15N and sharp decline of ~7 ‰ in δ34S. While knowledge gaps in jellyfish isotope ecology, in particular the lack of reliable trophic enrichment factors, call for a conservative interpretation of our data, observed changes in particular in δ34S, as indicated by means of a MixSIR mixing model, would be consistent with a temporal die- tary shift in A. aurita from mesozooplankton (>150 µm) to microplankton and small re-suspended particles (0.8–
20 µm) from the benthos. Presence of a hitherto unidenti- fied food source not included in the model could also con- tribute to the shift. During the 2-month occurrence of C.
Responsible Editor: C. Harrod.
Reviewed by I. D’Ambra and undisclosed experts.
Electronic supplementary material The online version of this article (doi:10.1007/s00227-016-2892-0) contains supplementary material, which is available to authorized users.
* Jamileh Javidpour jjavid@geomar.de
1 GEOMAR Helmholtz Centre for Ocean Research Kiel, Düsternbrooker Weg 20, 24105 Kiel, Germany
2 Biological, Earth and Environmental Science, University College Cork, Cooperage Building, Distillery Fields, North Mall, Cork, Ireland
3 Marine Biological Laboratory, 7 MBL Street, Woods Hole, MA 02543, USA
In recent years, there has been a rapid rise in the use of stable isotope (hereafter SI) analysis as a tool for studying trophic ecology, which led to a better understanding of ori- gin, pathways and fate of organic matter (Robinson 2001;
Michener and Kaufman 2007). By comparing SI values of a consumer over time, information on trophic transfer, carbon and energy flux, and contribution of food sources to the diet of an organism can be gained (Kling et al. 1992;
Cabana and Rasmussen 1996; Ponsard and Arditi 2000).
δ13C and δ15N have been most commonly used to address ecological questions (review by Grey 2006), since carbon (C) isotopes are well suited to identify the primary car- bon sources at the base of a food web (Peterson 1999) and nitrogen (N) isotopes are a good tracer of the trophic posi- tion of an organism (Cabana and Rasmussen 1996). The use of additional elements has increased recently, e.g., sul- fur (S) isotopes can reveal whether a food web is driven by benthic or pelagic primary production (Hansen et al. 2009;
Jaschinski et al. 2008).
For many groups of animals, information on temporal SI changes is already available (Carlier et al. 2007); however, despite their ecological importance, to date, this informa- tion is lacking for most species of jellyfish, leading to mis- interpretation of trophic ecology of gelatinous taxa (Flem- ing et al. 2015; Pauly et al. 2009). At the same time, recent work by Fleming et al. (2015) highlights that such variation in jellyfish can be substantial. Here, we were interested in the strength and patterns in intraspecific seasonal variation in SI values of δ13C, δ15N and δ34S of the pelagic jellyfish
species A. aurita and C. capillata during their bloom period (June–October 2011) in Kiel Fjord, western Baltic Sea.
Secondly, we interpreted these values in the context of iso- tope composition of dietary sources to assess potential tem- poral changes in diet composition of these two species.
Materials and methods Study location
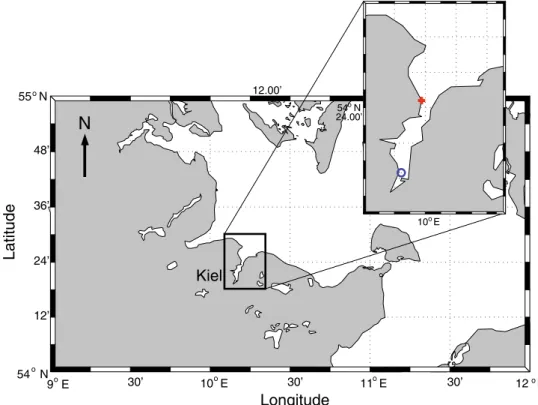
Kiel Fjord constitutes a small and shallow extension of the Kiel Bight in the Belt Sea (Fig. 1) with a mean depth of about 13 m (Javidpour et al. 2009). During most of the investigation period, the water column was well-mixed except during a short period of <15 days from July to August, where a weakly thermal stratification was detected.
Sampling
Weekly sampling in the Kiel Fjord was carried out during the annual occurrence of jellyfish from June to Novem- ber 2011. During this period, A. aurita occurred from June to the beginning of October and C capillata from the beginning of October to the end of November. A WP3 net with 1-mm mesh size was used to capture jellyfish by means of integrated vertical sampling between depths of 0 and 15 m. At each sampling event, five individuals per species were chosen from the collected material and bell
Fig. 1 Study area in the Western Baltic Sea and the Kiel Fjord with sampling stations Witlingskuhle (circle) and Falk- enstein station of Mittermayr et al. (2014b) (plus sign)
9oE 30’ 10oE 30’ 11oE 30’ 12oE
54oN 12’
24’
36’
48’
55oN
Longitude
Latitude
Kiel N
10oE 12.00’
54oN 24.00’
diameter (inter-rhopalia) was recorded. Specimens were kept in filtered sea water for 2 h at 20 °C, after which no remaining prey items were observed in the guts, indicat- ing that this period was sufficient to ensure complete gut evacuation (FitzGeorge-Balfour et al. 2013). Total wet mass of each individual was then measured to the nearest 0.01 g.
Prior to preparation for stable isotope analysis, the spec- imens were washed with filtered seawater (0.2 µm filter).
Bell tissue of each individual, the most suitable body part for SI measurements in A. aurita (D’Ambra et al. 2014), was dissected, rinsed using milli-Q water, dried to con- stant dry weight at 50–60 °C and ground to a fine powder using mortar and pestle. Subsamples of 4 ± 0.05 mg, found to yield optimum results in initial analyses, were then weighed out and sealed in tin cups.
Stable isotope data of potential food sources for the same time period including seston and mesozooplank- ton were obtained from Mittermayr et al. (2014a). Seston samples were sieved through a 20-µm mesh to separate zooplankton and were then filtered on 0.8-µm cellulose acetate filters (Sartorius) and carefully scraped off into distilled water with plastic cell scrapers before being des- iccated in small watch glasses. Since phytoplankton can- not be reliably separated from similar sized heterotrophic or detrital POM for stable isotope analysis, seston sam- ples were treated as proxy for mixed microplankton food sources. A study by Sommer and Sommer (2004) supports this procedure as they were not able to find a clear con- nection between seston size fractions and their SI values.
In the inner Kiel Fjord, seston can represent a mixture of phytoplankton and protozoans as well as re-suspended par- ticles from benthos. Mesozooplankton samples were col- lected using a 150-μm mesh size plankton net. As spatial variation within the south and central Baltic Sea area only accounts for 0.4 % of the total variance in mesozooplank- ton isotopic values (Agurto 2007), the use of Mittermayr et al. (2014a) data were deemed plausible for comparative purposes in this investigation considering that sampling sites are only ~7 km apart.
Stable isotope analysis
Analysis of samples was conducted with a continuous-flow isotope-ratio mass spectrometer (Europa Scientific ANCA- NT 20-20 Stable isotope analyzer with ANCA-NT Solid/
Liquid Preparation Module) at the University of California at Davis’ stable isotope facility. Delta notation was used as follows:
where X = 15N, 13C or 34S and R = 15N/14N, 13C/12C or
34S/32S. Reference materials for the calculation of δ-values were atmospheric N2 for N, Vienna Pee Dee Belemnite for C and SO2 for S. During analysis, samples were inter- spersed with replicates of two internal laboratory standards, nylon and bovine liver, previously calibrated against Inter- national Atomic Agency reference materials (IAEA-N1, IAEA-N2, IAEA-S-1, IAEA-S-2, IAEA-S-3 and USGS- 40), in order to correct for drift. The long-term standard deviation was 0.2 ‰ for δ13C and δ34S, 0.3 ‰ for δ15N and 0.4 ‰ for δ34S.
Lipid content might severely affect δ13C values, result- ing in 13C depleted values in correspondence with high lipid content and is therefore an important issue to address (DeNiro and Epstein 1977; Post et al. 2007). Post et al.
(2007) advises to conduct lipid correction on δ13C values for aquatic animals if lipid content is higher than 5 % of the biomass, or if C:N ratios are higher than 3.5. Since this was the case for C:N ratios of both A. aurita and C. capillata (see Table 1), δ13C values were corrected for lipid content based on the methods of Post et al. (2007) and D’Ambra et al. (2014). Both methods led to relatively small shifts in δ13C and very similar patterns over time compared to our original values. However, while the Post et al. correction slightly decreased variability in our dataset, the D’Ambra et al. correction introduced additional noise into the data set and increased the variability especially at the begin- ning of the season (supplementary Fig. S.1). Therefore, we decided to apply the correction by Post et al. to our original δ13C data set.
δX(‰)= [(Rsample/Rstandard)−1] ×1000
Table 1 Temporal biometric data (mean ± SD) collected for A. aurita and C. capillata from June to October 2011 Month (2011) Species Sample size (n) Wet mass (g)
(±SD)
Length (cm) (±SD)
C (µg 4 mg DW−1) (±SD)
N (µg 4 mg DW−1) (±SD)
C:N Molar ratio
June A. aurita 9 204.2 (92.1) 16.5 (3.6) 26.1 (9.1) 16.5 (3.6) 5.4 (0.9)
July A. aurita 15 530.9 (355.3) 22.8 (6.9) 25.0 (18.7) 6.5 (5.2) 4.7 (0.9)
August A. aurita 20 367.5 (256.3) 19.8 (5.3) 72.7 (42.6) 18.9 (10.9) 4.5 (0.1)
September A. aurita 10 161.19 (95.0) 17.0 (3.2) 28.73 (13.4) 7.23 (3.6) 4.7 (0.67)
September C. capillata 11 157.6 (97.5) 12.4 (3) 73.0 (27.4) 19.4 (6.6) 3.7 (0.4)
October C. capillata 10 232 (161) 13.6 (4) 69.9 (25.3) 19.3 (7) 3.6 (0.2)
Calculation of dietary composition based on MixSIR To determine potential contributions of different food sources to the diet of the collected jellyfish, a mixing model (MixSIR) based on Bayesian probability was applied. Mix- SIR is a graphical user interface (GUI) built on MATLAB that employs an algorithm based on a Bayesian framework to determine the probability distributions for proportional contributions of each food source to the diet mix of a con- sumer (Semmens and Moore 2008). This model allows for allocation of different fractionation factors ± standard deviation (SD) for each element and source, respectively, and accounts for uncertainty in isotope values when esti- mating contributions of sources.
Fractionation values of 0.5 ± 0.5 ‰ for δ13C (France and Peters 1997; Jaschinski et al. 2011) and 0 ± 0.2 ‰ for δ34S (Michener and Kaufman 2007) were chosen for all trophic level transfers; for δ15N, 2.4 ± 1.1 ‰ and 3.4 ± 1.1 ‰ were chosen for the first and following trophic level transfers, respectively (Currin et al. 1995;
Vanderklift and Ponsard 2003; Zanden and Rasmussen 2001). MixSIR was run with δ13C, δ15N and δ34S values of A. aurita and C. capillata on a bi-weekly basis. To account for turnover rates as reported by D’Ambra et al.
(2014), where bell tissue of A. aurita reached SI steady state with laboratory diet after 18–20 days, a lag time of 2 weeks between stable isotope values of jellyfish and sta- ble isotope values of their potential food sources was used in the model.
Statistical analysis
Our initial data exploration for A. aurita, zooplankton and seston was carried out with the response variables δ13C, δ15N and δ34S and time (date) as explanatory variable fol- lowing the protocol described in Zuur et al. (2010). The nonlinear relationship between response (SI) and explana- tory variables (time) warranted the application of a gen- eralized additive model (GAM) to δ13C, δ15N and δ34S.
Data on C. capillata were analyzed by applying one-way ANOVA for each stable isotope value to determine differ- ences among sampling time points as well as for compari- son of SI values of A. aurita and C. capillata. All statistical assumptions such as normality and constant variances were checked for any analysis and were checked for outliers.
Statistical analyses were performed in the software R 3.0.3 (R Core Team 2014).
Data management—raw data of the stable isotopes of jellyfish species underlying this paper are avail- able at PANGAEA (http://doi.pangaea.de/10.1594/
PANGAEA.858057).
Results
Seasonal changes in jellyfish occurrence, size and C:N ratios
A. aurita was present in all samples from June to Septem- ber, whereas C. capillata was found only on four occasions in September and October. Biometric measurements of A.
aurita indicated a significant increase in mean (±SD) diam- eter over time (F(3,50)= 3.8, p = 0.01) with a steep increase from June (16.5 ± 3.6 cm) to July (22.8 ± 6.9 cm), fol- lowed by a decrease in individual mean size in August and September (19.8 ± 5.3 and 17.0 ± 3.1 cm, respec- tively). Maximum mean (±SD) wet mass was recorded in July (531 ± 355 g ind−1). Total carbon (µg) and nitrogen (µg) per 4 mg dry mass showed a peak in August, with 72.7 ± 42.7 and 18.9 ± 10.9 µg, respectively (mean ±SD).
On average C:N ratios decreased from spring to summer and stayed constant until fall. Maximum C:N values were observed in June (5.4 ± 0.9), whereas the ratio was signifi- cantly lower in September (4.7 ± 0.7) (GAM, F = 59.1, p < 0.01).
In contrast, during the period of its occurrence (Sep- tember–October), C. capillata showed neither evidence of growth nor change in wet mass or total carbon and nitro- gen values (Table 1). C:N ratios also remained constant (3.7 ± 0.4 in Sep. and 3.6 ± 0.2 in Oct.).
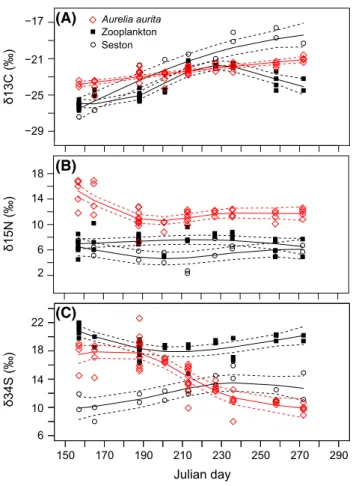
Temporal variability in jellyfish stable isotope values Strong directional temporal changes in all three isotopic markers occurred in A. aurita (Fig. 2a; Table 2). A. aurita δ13C values ranged from −23.9 ± 0.6 ‰ (mean ± SD) in June, to −21.3 ± 0.4 ‰ in September with a significant linear increase (GAM, F = 68.6, p < 0.001) toward the end of the season. While seston δ13C values were increas- ing significantly (GAM, F = 39.7, p < 0.001) from June (−26.0 ± 1.4) to September (−18.7 ± 1.1), zooplank- ton δ13C values increased from June (−25.2 ± 2.6) to the beginning of August (−21.8 ± 0.2), before decreasing from mid-August onward (GAM, edf = 3.7, F = 41.4, p < 0.001, Fig. 2a).
Maximum δ15N values of A. aurita were measured in June with 14.8 ± 2.3 ‰. These values then rapidly decreased to 10.9 ± 2.3 ‰ in early July (GAM, F = 15.4, p < 0.01), followed by a slight increase until the end of the period of occurrence in September (11.8 ± 0.7 ‰) (Fig. 2b). δ15N values of seston and zooplankton changed little over the observation period (GAM, F = 1.8, p = 0.5;
F = 1.2, p = 0.3, respectively), ranging from 6.3 ± 1.3 ‰ and 6.6 ± 1.1 ‰ in early June to 4.0 ± 1.0 ‰ and
6.1 ± 1.1 ‰ in late July and 5.0 ± 0.9 ‰ and 6.5 ± 1.3 ‰ in late September, respectively (Table 2).
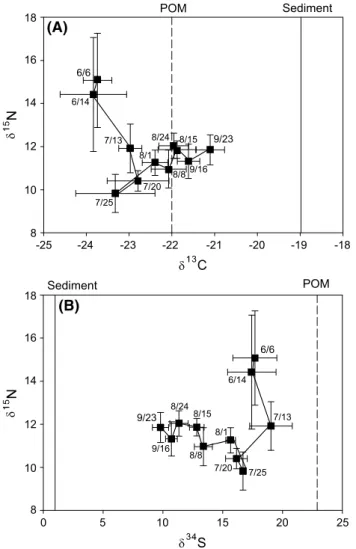
Temporal variation in δ34S of A. aurita was particu- larly pronounced, with a high in June and July (on average 17.4 ± 1.8 ‰ and 17.6 ± 2.0 ‰ respectively), followed by a steady decline (GAM, F = 45.3, p < 0.01) of more than 7 ‰ until late September (9.8 ± 0.7 ‰) (Fig. 2c). In contrast, δ34S of zooplankton decreased from 20.9 ± 1.0 ‰ in early June to 18.2 ± 1.1 ‰ in early July, followed by a slight increase to 19.1 ± 2.4 ‰ in September (GAM, F = 29.8, p > 0.01). Seston changed from 11.9 ± 3.2 in June to 12.4 ± 0.9 in late September. Temporal variation was significant (GAM, F = 5.2, p < 0.01), but of much lower magnitude than for A. aurita. To better illustrate tem- poral changes in SI composition of A. aurita, biplots of δ13C–δ15N and δ15N–δ34S with respect to sampling date are provided in Fig. 3.
In contrast to A. aurita, C. capillata showed fewer changes over the period of its occurrence in Kiel Fjord (Table 2; Fig. 4). There was a significant increase (ANOVA, F(1,18) = 6.9, p = 0.01) in δ13C of C. capillata from Sep- tember (−21.1 ± 0.6 ‰) to October (−20.5 ± 0.5 ‰), but no significant changes in δ15N or δ34S were measured.
During the short period of species co-occurrence in Sep- tember, the mean δ13C values of C. capillata were not sig- nificantly different from A. aurita (F(1,18)= 1.6, p = 0.2), but δ15N (F(1,17)= 8.1, p = 0.01) and δ34S (F(1,18)= 632.7, p < 0.001) showed highly significant differences, and no evidence for an approximation of values over time.
δ15N (‰)
10 14 18
δ13C (‰)
−29
−25
−21
−17
δ34S (‰)
150 170 190 210 230 250 270 290
(A)
(B)
(C)
Aurelia aurita Seston Zooplankton
Julian day 6
10 14 18 22 6 2
Fig. 2 δ13C, δ15N and δ34S of A. aurita (red diamond), zooplankton (square) and seston (circle) over the course of 5 months in the Kiel Fjord (Jun–Oct 2011). Julian day 150 corresponds to May 30 and 290 to October 17
Table 2 Isotope values (mean ± SD) of potential food sources (after Mittermayr et al. 2014b) and jellyfish from June to October 2011 June_1 June_2 July_1 July_2 August_1 August_2 September_1 September_2 October_1 October_2 Seston
δ15N 6.3 (1.3) 5.1 ± 1.2 4.4 ± 1.4 4.0 ± 1.0 2.3 ± 0.2 5.1 ± 1.0 6.0 ± 0.9 5.0 ± 1.0 δ13C −26.0 ± 1.4 −25.0 ± 1.7 −21.6 ± 3.5 −21.1 ± 1.4 −20.5 ± 1.4 −21.0 ± 1.2 −19.1 ± 2.2 −18.7 ± 1.1 δ34S 12.0 ± 3.2 9.9 ± 3.0 11.9 ± 1.2 11.9 ± 2.9 12.4 ± 0.2 13.2 ± 1.2 14.0 ± 2.9 12.4 ± 1.5 Zooplankton
δ15N 6.6 ± 2.0 7.7 ± 1.2 7.1 ± 1.1 6.1 ± 1.1 7.4 ± 0.6 7.3 ± 1.6 6.9 ± 1.9 6.5 ± 1.3 δ13C −25.2 ± 2.6 −24.6 ± 2.3 −25.1 ± 0.5 −23.1 ± 1.2 −21.8 ± 0.2 −22.1 ± 1.4 −23.0 ± 1.6 −21.8 ± 3.1 δ34S 21.0 ± 1.0 18.2 ± 2.0 18.2 ± 1.1 18.6 ± 0.4 18.6 ± 1.2 18.9 ± 1.2 18.94 ± 1.4 19.1 ± 2.4 Aurelia
δ15N 15.1 ± 2.2 14.4 ± 2.6 11.0 ± 2.3 11.5 ± 2.2 11.2 ± 0.7 11.9 ± 0.5 11.3 ± 0.8 11.8 ± 0.7 δ13C −22.0 ± 1.5 −22.4 ± 1.9 −20.7 ± 1.7 −22.8 ± 0.5 −21.8 ± 0.3 −21.4 ± 0.5 −20.9 ± 0.5 −20.6 ± 0.3 δ34S 17.7 ± 1.8 17.0 ± 2.0 19.9 ± 1.5 16.4 ± 0.6 13.9 ± 1.7 11.7 ± 0.3 10.7 ± 0.2 9.8 ± 0.7 Cyanea
δ15N 15.9 ± 3.0 12.4 ± 0.5 12.5 ± 0.5 15.3 ± 3.2
δ13C −22.0 ± 0.6 −20.9 ± 0.2 −20.9 ± 0.5 −20.6 ± 0.4
δ34S 17.8 ± 0.3 18.4 ± 0.9 17.7 ± 0.8 18.4 ± 0.4
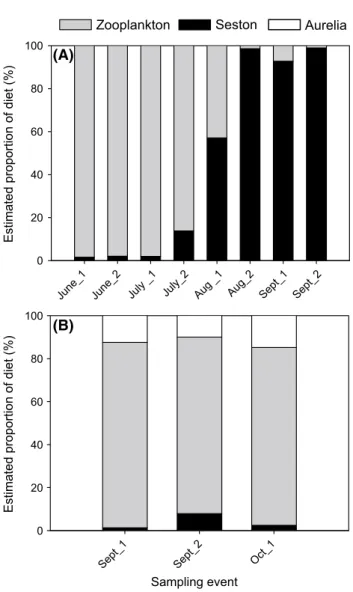
Contribution of prey sources to the diets of jellyfish Regarding the analysis of potential contributions of dif- ferent prey sources to the dietary mix of A. aurita, and assuming that all potential food sources were included, the MixSIR mixing models indicated a drastic shift from a mesozooplankton based diet (96.6 ± 0.8 % of total possible food sources) to a seston based diet (99.8 ± 0.2 %) at the end of the growing season in Sep- tember (Fig. 5a).
In contrast, the MixSIR mixing model for C. capillata indicated that this species fed mainly on mesozooplankton prey items over the limited period of observation in Kiel Fjord, whereas A. aurita comprised <15 % of its diet, and seston was nearly absent from its diet (Fig. 5b).
Discussion
The pronounced shifts of ~3 ‰ in δ13C, ~4 ‰ in δ15N and the sharp decline of ~7 ‰ in δ34S within the same popu- lation of the jellyfish species A. aurita over a period of 4 months highlighted the potential for substantial intraspe- cific isotopic seasonal variation in jellyfish populations in their natural environment. This underscores the importance to account for such changes in SI feeding ecology stud- ies on this group to avoid misinterpretation of datasets.
Because the temporal changes of the SI values of potential
6/6 6/14
7/13
7/20 7/25
8/1 8/8 8/24 8/15
9/16 9/23
(A)
6/6 6/14
7/13
7/20 7/25 8/1 8/8 8/248/15
9/16 9/23
(B)
0 5 10 15 20 25
8 10 12 14 16
18 Sediment POM
Sediment POM
8 10 12 14 16 18
-25 -24 -23 -22 -21 -20 -19 -18
Fig. 3 Stable isotope values of δ13C versus δ15N (a) and δ34S versus δ15N (b) for A. aurita. Numbers indicate the date of sampling. The symbols were connected in the temporal order of the data points, thus providing a time trajectory of change in isotope values
Fig. 4 δ13C, δ15N and δ34S of C. capillata (black diamond) and A.
aurita (red diamond) over the course of 2 months in the Kiel Fjord (Sep–Oct 2011). Julian day 255 corresponds to September 12 and 290 to October 17
prey items, in particular for δ34S, were much lower, it seems most likely that the dietary composition of A. aurita changed significantly over time. This interpretation was strengthened by the shift in A. aurita δ13C values which again differed from the pattern of the shifts in SI values of the potential prey.
δ34S of POM in Kiel Fjord was recorded at ~21 ‰, whereas sediment δ34S was at ~1 ‰ (Hansen et al. 2009).
These two extremes represent the isotopic endpoints of potential food sources at the base of the local food webs, i.e., δ34S isotopic values of all components in Kiel Fjord food webs generally fall within this range. δ34S has there- fore been used in previous studies as indicator of benthic versus pelagic dietary sources (see e.g., Jaschinski et al.
2011; Mittermayr et al. 2014a). While δ34S fractionation rates of jellyfish has not been reported so far, the strong
shift to lower δ34S values of A. aurita over time may sug- gest a dietary shift from strictly pelagic to benthic food sources. We were unable to analyze gut contents to support this hypothesis; however, our mixing model results would be consistent with a switch from pelagic mesozooplankton as the main carbon source to benthic microplankton (e.g., protozoan) and/or resuspended organic particles from the benthos over the course of 4 months. In this context, con- sidering the brief (2 week) duration and the weak nature of stratification during the study period, hydrographical changes probably were not a driver of the observed changes in SI values.
The changes observed in A. aurita SI values during its growing season in Kiel Fjord have important implications.
Firstly, there is an ongoing debate in the field of isotope ecology regarding the need to account for species-specific temporal variation in isotopic values (Fleming et al. 2015;
Jennings et al. 2008). Our finding confirm recent results by Fleming et al. (2015) with respect to substantial temporal variation in C and N values of jellyfish, and in addition highlighted particularly strong variation in S SI values over time that has not been previously assessed. The pronounced and rapid temporal changes observed here strongly under- score that SI feeding ecology studies in particular of jel- lyfish that do not account for this variation can result in misinterpretation of datasets. This point is illustrated by the fact that conclusions regarding the feeding ecology of A. aurita would be diametrically opposite when choosing only one isolated sampling point in June versus a point in September. Secondly, bentho-pelagic coupling is a key ecosystem process (Marcus 1998). Our data and the result- ing mixing model suggest that in contrast to the exclu- sively planktonic feeding ecology commonly assumed for this species (Behrends and Schneider 1995; Hansson et al.
2005; Moller and Riisgard 2007), it may also depend on benthic food sources at the base of its food web (see also Pitt et al. 2008). This would have consequences for assess- ments of the ecological role and impact of jellyfish and should be considered in the parameterization of food web models.
While the period of overlap of A. aurita with C. capil- lata was relatively short, this study nevertheless provides the first insights regarding the trophic interactions between these two species in Kiel Fjord based on SI analysis. Previ- ously, based on both field and experimental observations, C. capillata has mainly been described as an important predator of A. aurita (Bamstedt et al. 1994; Hansson 1997;
Titelman et al. 2007), although Hansson concluded that assimilation rate estimates were needed to clearly define the proportion of A. aurita in the diet. In contrast, while the short temporal overlap and the absence of significant growth of C. capillata means that this result needs to be treated with caution, our data provide an indication that
June_1 June_2 July _1 July_2 Aug _1 Aug_
2
Sept_1 Sept_2 0
20 40 60 80 100
Seston Zooplankton
Estimated proportion of diet (%)
0 20 40 60 80 100
Sept_1 Sept_2 Oct_
1 Sampling event
Aurelia (A)
(B)
Estimated proportion of diet (%)
Fig. 5 Graphical outcome of MixSIR models indicating percentage of mesozooplankton (gray bar) and microplankton (black bar) to the diet of A. aurita (a) and C. capillata (b) from June to October 2011 in a biweekly time span
the role of A. aurita in C. capillata diet may be lower than previously thought. At the time of first occurrence in Kiel Fjord in September, the δ34S values of C. capillata were significantly higher (+ ~8 ‰) than the values of A. aurita.
Over the following period of overlap, no temporal approxi- mation in δ34S values—which would be expected under the scenario of C. capillata feeding on A. aurita and assuming that turnover rates reported by D’Ambra et al. (2014) for A.
aurita do apply—occurred. Instead, C. capillata δ34S iso- tope values remained close to pelagic isotopic ratios, which were reflected by the estimated contribution of A. aurita to the diet of C. capillata of only 15 % as indicated by the MixSIR model.
To conclude, this study demonstrates the potential of triple stable isotope datasets to gain novel insights into the feeding ecology and ecological role of jellyfish, which is urgently needed due to the rising concern about worldwide increases in this marine ecosystem component in the course of global change (Gibbons and Richardson 2013). Further- more, carefully designed experimental designs are required in order to account for potential temporal variation in con- sumers and their prey to unlock the full potential future of such approaches.
Limitations of the study
The data reported here support the assumption that diet composition of A. aurita has changed over time not only from mesozooplankton to microzooplankton food, but also from a more pelagic source to a benthic one. It is important to mention that the MixSIR model results leading to this conclusion were mainly driven by the significant change in δ34S values of A. aurita. Results in δ13C and δ15N do not contradict this conclusion, but taken by themselves would have allowed different interpretations as well. In particular, the offset between A. aurita and the two assumed dietary source categories (zooplankton and seston) is always larger than >5 ‰. We assume here that this difference is due to trophic fractionation, which would place A. aurita on the upper end of the range reported for other organisms and larger than the value previously reported by D’Ambra et al.
(2014). An alternative explanation would be the presence of an additional trophic complexity, e.g., an unidentified die- tary source with a higher δ15N value and similar δ34S value compared to seston not included in our mixing model, although the low δ34S values would then still support a more benthic origin of material at the base of the food web in fall (Jaschinski et al. 2008; Mittermayr et al. 2014b).
Regarding our conclusion of limited feeding of C. capil- lata on A. aurita, it is important to consider that fractionation rates in particular for δ34S, and for jellyfish feeding on other
that general relationships in isotope ecology will hold true;
however, this assumption needs validation in the future.
Again, δ13C and δ15N values do not contradict this result, but based on C and N alone, a higher importance of A. aurita in the prey would have been a possible solution as well.
Finally, as in other isotope ecology studies, it is important to consider that SI fractionation factors may in part depend on the physiological state and the sexual maturity of an organism. However, while the effect of metabolic change on turnover rates has been assessed (Bearhop et al. 2004), little information exists on changes in fractionation. For practi- cal reasons, rates are therefore commonly assumed as stable over time in SI feeding ecology studies (e.g., Michener and Kaufman 2007). A. aurita developed gonads in mid-June and its sexual reproduction started in late July (unpublished data) which likely explain the observed slight C:N decrease of A. aurita during this time (Milisenda et al. 2014). It is still unclear to which extent the reproductive stage of jelly- fish might influence SI fractionation factors, but as no obvi- ous pattern coincided with the timing of reproduction here, we considered the effects as limited.
Acknowledgments We wish to thank Thomas Hansen for valuable advice in the early stages of this work, Eduardo Ramirez-Romero for providing the map of sampling stations and three reviewers who provided valuable feedback on previous versions of this manuscript.
We are particularly grateful to the crew of the research vessel “Polar- fuchs” for their help during our data collection. This project was funded by the German Research Foundation (DFG, JA2008/1-1). JD received financial support from the Cluster of Excellence “The Future Ocean” and the BONUS project BIO-C3, funded jointly by the EU and the BMBF (Grant No. 03F0682A).
Open Access This article is distributed under the terms of the Crea- tive Commons Attribution 4.0 International License (http://creativecom- mons.org/licenses/by/4.0/), which permits unrestricted use, distribution, and reproduction in any medium, provided you give appropriate credit to the original author(s) and the source, provide a link to the Creative Commons license, and indicate if changes were made.
References
Agurto C (2007) Assessing mesozooplankton trophic levels in the Baltic Sea and North Sea: a stable isotope study. Ph.D. thesis, Christian-Albrechts-University, Kiel
Bamstedt U, Martinussen MB, Matsakis S (1994) Trophodynamics of the 2 scyphozoan jellyfishes, Aurelia aurita and Cyanea capil- lata, in Western Norway. ICES J Mar Sci 51:369–382
Bearhop S, Adams CE, Waldron S, Fuller RA, MacLeod H (2004) Determining trophic niche width: a novel approach using stable isotope analysis. J Anim Ecol 73:1007–1012
Behrends G, Schneider G (1995) Impact of Aurelia aurita medusae (cnidaria, scyphozoa) on the standing stock and community composition of mesozooplankton in the Kiel Bight (Western Bal- tic Sea). Mar Ecol Prog Ser 127:39–45
Cabana G, Rasmussen JB (1996) Comparison of aquatic food chains using nitrogen isotopes. Proc Natl Acad Sci-Biol
Carlier A et al (2007) A seasonal survey of the food web in the Lapa- lme Lagoon (northwestern Mediterranean) assessed by carbon and nitrogen stable isotope analysis. Estuar Coast Shelf S 73:299–315 Condon RH et al (2012) Questioning the rise of gelatinous zooplank-
ton in the world’s oceans. Bioscience 62:160–169
Currin CA, Newell SY, Paerl H (1995) The role of standing dead Spartina alterniflora and benthic microalgae in salt marsh food webs: considerations based on multiple stable isotope analysis.
Mar Ecol Prog Ser 121:99–116
D’Ambra I, Carmichael RH, Graham WM (2014) Determination of delta C-13 and delta N-15 and trophic fractionation in jellyfish:
implications for food web ecology. Mar Biol 161:473–480 DeNiro MJ, Epstein S (1977) Mechanism of carbon isotope fractiona-
tion associated with lipid synthesis. Science 197:261–263 FitzGeorge-Balfour T, Hirst AG, Lucas CH, Craggs J, Whelan EJ,
Mombrikotb S (2013) Estimating digestion time in gelati- nous predators: a methodological comparison with the scypho- medusa Aurelia aurita. Mar Biol 160:793–804. doi:10.1007/
s00227-012-2134-z
Fleming NEC, Harrod C, Newton J, Houghton JDR (2015) Not all jel- lyfish are equal: isotopic evidence for inter- and intraspecific var- iation in jellyfish trophic ecology. PeerJ. doi:10.7717/peerj.1110 France RL, Peters RH (1997) Ecosystem differences in the trophic
enrichment of C-13 in aquatic food webs. Can J Fish Aquat Sci 54:1255–1258
Gibbons MJ, Richardson AJ (2013) Beyond the jellyfish joyride and global oscillations: advancing jellyfish research. J Plankton Res 35:929–938. doi:10.1093/plankt/fbt063
Grey J (2006) The use of stable isotope analyses in freshwater ecol- ogy: current awareness. Pol J Ecol 54:563–584
Hansen T, Burmeister A, Sommer U (2009) Simultaneous delta N-15, delta C-13 and delta S-34 measurements of low-biomass samples using a technically advanced high sensitivity elemental analyzer connected to an isotope ratio mass spectrometer. Rapid Commun Mass Sp 23:3387–3393
Hansson LJ (1997) Capture and digestion of the scyphozoan jellyfish Aurelia aurita by Cyanea capillata and prey response to predator contact. J Plankton Res 19:195–208
Hansson LJ, Moeslund O, Kiorboe T, Riisgard HU (2005) Clear- ance rates of jellyfish and their potential predation impact on zooplankton and fish larvae in a neritic ecosystem (Limfjorden, Denmark). Mar Ecol Prog Ser 304:117–131
Hay S (2006) Marine ecology: gelatinous bells may ring change in marine ecosystems. Curr Biol 16:R679–R682
Jaschinski S, Brepohl DC, Sommer U (2008) Carbon sources and trophic structure in an eelgrass Zostera marina bed, based on stable isotope and fatty acid analyses. Mar Ecol Prog Ser 358:103–114
Jaschinski S, Brepohl DC, Sommer U (2011) Seasonal variation in carbon sources of mesograzers and small predators in an eelgrass community: stable isotope and fatty acid analyses. Mar Ecol Prog Ser 431:69–82
Javidpour J, Molinero J, Peschutter J, Sommer U (2009) Seasonal changes and population dynamics of the ctenophore Mnemiopsis leidyi after its first year of invasion in the Kiel Fjord, Western Baltic Sea. Biol Invasions 11:873–882
Jennings S, Maxwell TA, Schratzberger M, Milligan SP (2008) Body- size dependent temporal variations in nitrogen stable isotope ratios in food webs. Mar Ecol Prog Ser 370:199–206
Kling GW, Fry B, O’Brien WJ (1992) Stable isotopes and planktonic trophic structure in arctic lakes. Ecology 73:561–566
Marcus NH (1998) Minireview: the importance of benthic–pelagic coupling and the forgotten role of life cycles in coastal aquatic systems. Limnol Oceanogr 43:763–768
Michener RH, Kaufman L (2007) Stable isotope ratios as tracers in marine food webs: an update. In: Michener RH, Lajtha K (eds)
Stable isotopes in ecology and environmental science. Wiley, Oxford, pp 238–282
Milisenda G, Rosa S, Fuentes VL, Boero F, Guglielmo L, Purcell JE, Piraino S (2014) Jellyfish as prey: frequency of predation and selective foraging of Boops boops (Vertebrata, Actinopterygii) on the mauve stinger Pelagia noctiluca (Cnidaria, Scyphozoa).
PLoS ONE 9(4):e94600. doi:10.1371/journal.pone.0094600 Mittermayr A, Fox SE, Sommer U (2014a) Temporal variation in
stable isotope composition (δ13C, δ15N and δ34S) of a temperate Zostera marina food web. Mar Ecol Prog Ser 505:95–105 Mittermayr A, Hansen T, Sommer U (2014b) Simultaneous analysis
of δ13C, δ15N and δ34S ratios uncovers food web relationships and the trophic importance of epiphytes in an eelgrass Zostera marina community. Mar Ecol Prog Ser 497:93–103
Moller LF, Riisgard HU (2007) Feeding, bioenergetics and growth in the common jellyfish Aurelia aurita and two hydromedu- sae, Sarsia tubulosa and Aequorea vitrina. Mar Ecol Prog Ser 346:167–177
Pauly D, Graham W, Libralato S, Morissette L, Deng Palomares M (2009) Jellyfish in ecosystems, online databases, and ecosystem models. Hydrobiologia 616:67–85
Peterson BJ (1999) Stable isotopes as tracers of organic matter input and transfer in benthic food webs: a review. Acta Oecol 20:479–487 Pitt KA, Clement AL, Connolly RM, Thibault-Botha D (2008) Preda-
tion by jellyfish on large and emergent zooplankton: implications for benthic–pelagic coupling. Estuar Coast Shelf Sci 76:827–833 Pitt K, Connolly R, Meziane T (2009) Stable isotope and fatty acid
tracers in energy and nutrient studies of jellyfish: a review. Hyd- robiologia 616:119–132
Ponsard S, Arditi R (2000) What can stable isotopes (δ15N and δ13C) tell about the food web of soil macro-invertebrates? Ecology 81:852–864
Post DM, Layman CA, Arrington DA, Takimoto G, Quattrochi J, Montana CG (2007) Getting to the fat of the matter: models, methods and assumptions for dealing with lipids in stable iso- tope analyses. Oecologia 152:179–189
R Core Team (2014) R: A language and environment for statistical computing. R Foundation for Statistical Computing, Vienna, Austria. http://www.R-project.org/. Accessed 7 April 2016 Richardson AJ, Bakun A, Hays GC, Gibbons MJ (2009) The jellyfish
joyride: causes, consequences and management responses to a more gelatinous future. Trends Ecol Evol 24:312–322
Robinson D (2001) delta N-15 as an integrator of the nitrogen cycle.
Trends Ecol Evol 16:153–162. doi:10.1016/s0169-5347(00)02098-x Schneider G (1989) Estimation of food demands of Aurelia aurita medusae populations in the Kiel Bight/western Baltic. Ophelia 31:17–27
Semmens BX, Moore JW (2008) MixSIR: a Bayesian stable isotope mixing model, version 1.0, EcologyBox, Mathematical Biology Program, Northwest Fisheries Science Center, Seattle. http://
www.ecologybox.org. Accessed 1 Mar 2013
Sommer F, Sommer U (2004) δ15N signatures of marine mesozoo- plankton and seston size fractions in Kiel Fjord, Baltic Sea. J Plankton Res 26:495–500
Titelman J, Gandon L, Goarant A, Nilsen T (2007) Intraguild predatory interactions between the jellyfish Cyanea capil- lata and Aurelia aurita. Mar Biol 152:745–756. doi:10.1007/
s00227-007-0721-1
Vanderklift MA, Ponsard S (2003) Sources of variation in consumer- diet δ15N enrichment: a meta-analysis. Oecologia 136:169–182 Zanden M, Rasmussen JB (2001) Variation in δ15N and δ13C trophic
fractionation: implications for aquatic food web studies. Limnol Oceanogr 46:2061–2066
Zuur AF, Ieno EN, Elphick CS (2010) A protocol for data explora- tion to avoid common statistical problems. Methods Ecol Evol 1:3–14. doi:10.1111/j.2041-210X.2009.00001.x