• Keine Ergebnisse gefunden

Latitudinalvariationsin δ Si and δ N signaturesalongthePeruvianshelf:quantifyingtheeffectsofnutrientutilizationversusdenitrificationoverthepast600years Supplementof

N/A
N/A
Protected

Academic year: 2022

Aktie "Latitudinalvariationsin δ Si and δ N signaturesalongthePeruvianshelf:quantifyingtheeffectsofnutrientutilizationversusdenitrificationoverthepast600years Supplementof"

Copied!
2
0
0

Wird geladen.... (Jetzt Volltext ansehen)

Volltext

(1)

Supplement of Biogeosciences, 16, 2163–2180, 2019 https://doi.org/10.5194/bg-16-2163-2019-supplement

© Author(s) 2019. This work is distributed under the Creative Commons Attribution 4.0 License.

Supplement of

Latitudinal variations in δ

30

Si and δ

15

N signatures along the Peruvian shelf: quantifying the effects of nutrient utilization versus denitrification over the past 600 years

Kristin Doering et al.

Correspondence to:Kristin Doering (kristin.doering@dal.ca)

The copyright of individual parts of the supplement might differ from the CC BY 4.0 License.

(2)

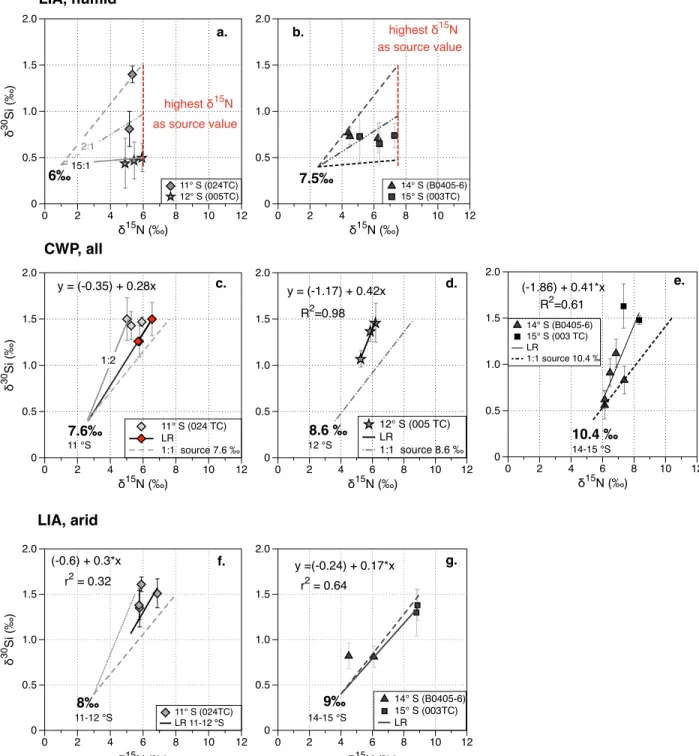
Figure S1: Calculation of d15NO3- source signatures based on equations of the linear regression gained by the direct comparison of d15NBulk versus d30SiBSi for the LIA (humid; a-b), CWP (c-e), the LIA (arid; f-g) and. Black lines indicate the estimated linear regression. Dashed lines indicate the resulting 1:1 utilization line.

11° S (024 TC) LR

1:1 source 7.6 ‰ 1:2

7.6‰

y = (-0.35) + 0.28x

11 °S

δ30 Si (‰)

0 0.5 1.0 1.5 2.0

δ15N (‰)

0 2 4 6 8 10 12

12° S (005 TC) LR

1:1 source 8.6 ‰

8.6 ‰ R2=0.98 y = (-1.17) + 0.42x

12 °S 0

0.5 1.0 1.5 2.0

δ15N (‰)

0 2 4 6 8 10 12

14° S (B0405-6) 15° S (003 TC) LR

1:1 source 10.4 ‰

10.4 ‰ (-1.86) + 0.41*x

R2=0.61

14-15 °S 0

0.5 1.0 1.5 2.0

δ15N (‰)

0 2 4 6 8 10 12

11° S (024TC) LR 11-12 ºS 11-12 °S

8‰

r2= 0.32 (-0.6) + 0.3*x

δ30 Si (‰)

0 0.5 1.0 1.5 2.0

δ15N (‰)

0 2 4 6 8 10 12

14° S (B0405-6) 15° S (003TC) LR

9‰

y =(-0.24) + 0.17*x r2= 0.64

14-15 °S 0

0.5 1.0 1.5 2.0

δ15N (‰)

0 2 4 6 8 10 12

LIA, arid CWP, all

c. d. e.

f. g.

11° S (024TC) 12° S (005TC) 2:1

6‰15:1

highest δ15N as source value δ30 Si (‰)

0 0.5 1.0 1.5 2.0

δ15N (‰)

0 2 4 6 8 10 12

14° S (B0405-6) 15° S (003TC)

7.5‰

highest δ15N as source value

0 0.5 1.0 1.5 2.0

δ15N (‰)

0 2 4 6 8 10 12

LIA, humid

b.

a.

Abbildung

Figure S1: Calculation of d 15 NO 3 - source signatures based on equations of the linear regression gained by the direct  comparison of d 15 N Bulk  versus d 30 Si BSi  for the LIA (humid; a-b), CWP (c-e), the LIA (arid; f-g) and

Referenzen

ÄHNLICHE DOKUMENTE

The non-oxygen gas components are trapped in cold trap, Oxygen passes to the molecular sieve cooled with liquid nitrogen and is transferred to the mass spectrometer for

An even larger deviation from the canonical picture of river water flow in the Arctic Ocean occurs in the early 1990s, when river water almost entirely moves eastward along

• genau einer Quelle, die mit einer Booleschen Variablen markiert ist, deren Eingangsgrad 0 und Ausgangsgrad 2 betragen und von den beiden vom Knoten ausgehenden Kanten ist die eine

To test the idea of changing dominant microbial commu- nities as drivers for isotope depth patterns, we did a fatty acid (FA) analysis of four investigated sites, namely two drained

Falls ihr die Aufgabe 1,d) aus dem Ortsraum kommend nachrechnen wollt, ben¨ otigt ihr ebenso die Fouriertransformierte der δ(p) Funktion.. (4) Dar¨ uberhinaus wurden wir

Auf dem Umkreis eines gleichseitigen Dreiecks ABC wählen wir einen Punkt P wie zum Beispiel in der Abbildung 1.. Die Sache spielt im

noch vorhandene Eduktmoleküle können sich mit Produktmolekülen mischen und damit einen Beitrag zur Erhöhung der Gesamtentropie liefern.. 2 Die Berechnungen und die Grafiken

Aus Gleichung (2) wird zum Beispiel sofort die Temperaturabhängigkeit des chemischen Gleichgewichts (Prinzip von Le Chatelier) ersichtlich. a) Bei einer exothermen