Investigating Implemented Process Design:
A Case Study on the Impact of Process-aware Information Systems on Core Job Dimensions
Bela Mutschler, Mark Rijpkema, Manfred Reichert Information Systems Group, University of Twente, The Netherlands
{b.b.mutschler;m.rijpkema;m.u.reichert}@utwente.nl
Abstract. Adequate process design particularly means that a process fulfills its stakeholders’ expectations. However, when designing process-aware information systems (PAIS), one stakeholder and his expectations are often neglected: the end user. Frequently, this results in end user fears, which, in turn, lead to emotional re- sistance and a lack of user support during process and information system design.
In order to overcome this vicious circle it becomes necessary to better understand the impact of operationalized process design on the end users’ work profile. This paper presents the results of a case study at two Dutch companies. We investigate in which way employees perceive the impact of a newly introduced PAIS based on workflow management technology with respect to five job dimensions: skill variety, task identity, task significance, autonomy, and feedback from the job.
1 Introduction
Providing effective IT support for business processes has become crucial for enterprises to stay competitive in their market. Adequate process design adopts a key role in this re- spect. With ”adequate” we mean that a business process fulfills its stakeholders’ expec- tations. However, while expectations of policy makers and IT managers are carefully considered in most cases, the wishes of end users are often neglected when design- ing processes and when implementing supporting process-aware information systems (PAIS). Often, this results in end user fears, e.g., due to job redesign, changed social clues, or the automation of process fragments by means of a workflow management sys- tem (WfMS). End user fears, in turn, may lead to emotional resistance and missing (but highly needed) user support during process design (e.g., when conducting interview- based process analysis). One success factor for avoiding such a scenario is to better understand the impact of process automation on work profiles.
Picking up this issue, this paper presents the results of a case study we conducted at two Dutch companies. In this case study, we investigate in which way end users perceive the impact of a newly introduced process design and its implementation based on a PAIS. Section 2 summarizes our case study. Section 3 concludes with a summary.
2 The Case Study
Research Design. Our case study involves two Dutch companies: a facility manage- ment organization (Site 1) and a housing corporation (Site 2). At Site 1, financial pro-
cesses, helpdesk services, and procurement processes are supported by the considered PAIS. At Site 2, fewer processes are supported, e.g., the company’s project manage- ment process for building new houses. Generally, our goal is to investigate how end users perceive the introduction of a PAIS and the related process (re)design.
To collect data, we use a web-based online questionnaire. Besides statistical infor- mation about the participants (e.g., their work profile), we gather data about the useful- ness of the PAIS and its impact on job dimensions:
– Part I (General Usefulness): Addresses the usefulness of the PAIS, not only for the respondents themselves, but also for their organization.
– Part II (Impact on Job Dimensions): Addresses the perceived impact of the PAIS on the end users’ work profiles. Specifically, we analyze the perceived impact along the five dimensions of the job characteristics model [1, 2]:
• Job Dimension 1 (Skill Variety): Deals with the degree to which a job requires different skills for carrying out work.
• Job Dimension 2 (Task Identity): Deals with the degree to which a job requires the treatment of complete tasks, i.e., tasks from beginning to end.
• Job Dimension 3 (Task Significance): Deals with the degree to which a job influences the work of other (internal and external) people.
• Job Dimension 4 (Autonomy): Deals with the degree to which a job provides freedom regarding the scheduling and performance of work.
• Job Dimension 5 (Feedback from the Job): Deals with the degree to which an employee obtains information and feedback about his work performance.
The questions for analyzing these five dimensions are partially based on the question- naire used in the job diagnostic survey (JDS) [1, 2] (which constitutes one part of the job characteristics model). Yet, we need to adopt the original JDS questionnaire to our context. Thereby, we use Likert-type scales for quantifications in our questionnaire.
Likert-type scales consist of a series of declarative statements and the survey partici- pant is asked to indicate whether he agrees or disagrees with each statement.
We received 25 questionnaires, 10 from Site 1 and 15 from Site 2. Note that this only allows to identify general trends rather than statistically significant conclusions.
Results. In this section, we present results of our case study. First, we present results on the general usefulness of the introduced PAIS (cf. Part I of our questionnaire). Sec- ond, we summarize results regarding the perceived impact of the PAIS on the end users’
work profile (cf. Part II of our questionnaire).
Part I. Fig. 1 shows the mean and standard deviation for data collected at Site 1. We calculate these statistical metrics not only for the total number of responses, but also for different user groups (technical staff, research & development, management, etc.).
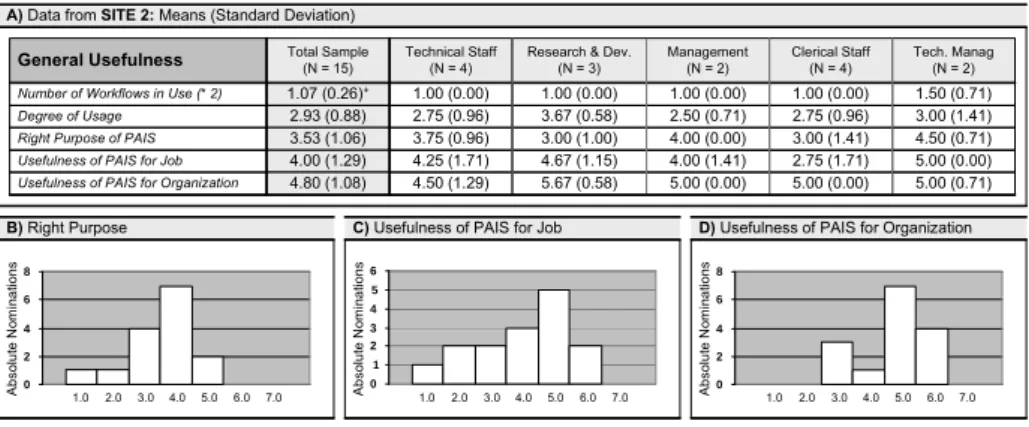
Fig. 1A shows the survey results regarding the general usefulness of the PAIS as perceived by respondents. We analyze ”general usefulness” based on four questions:
(1) To what degree do you use the PAIS within your organization? (2) To what degree does the PAIS contribute to your tasks in a positive way? (3) To what degree is the PAIS used for the ”right” purpose? (4) To what degree does the PAIS contribute to your
organization? For quantifying these four questions, a Likert-type scale with assumed possibilities is used (very slight: 1, slight: 2, fairly slight: 3, neither nor: 4, fairly high:
5, high: 6, very high: 7). Fig. 1B, Fig. 1C, and Fig. 1D clarify selected results about the usefulness of the PAIS for the job and organization.
A) Data from SITE 1: Means (Standard Deviation)
General Usefulness
Number of supported Workflows (* 11) Degree of Usage
Right Purpose of PAIS Usefulness of PAIS for Job Usefulness of PAIS for Organization
Total Sample (N = 10) 3.50 (1.78)+
4.50 (2.17) 4.50 (1.78) 4.20 (1.48) 5.20 (1.69)
Technical Staff (N = 2) 1.50 (0.71) 3.50 (3.54) 4.00 (2.83) 5.00 (1.41) 6.38 (0.00)
Research & Dev.
(N = 1) 4.00 (-) 5.00 (-) 6.00 (-) 6.00 (-) 7.00 (-)
Management (N = 2) 3.00 (1.41) 6.50 (0.71) 4.50 (2.12) 3.00 (2.83) 4.00 (2.83)
Clerical Staff (N = 3) 5.00 (1.73) 5.33 (1.53) 5.00 (1.73) 3.67 (0.58) 5.33 (2.08)
Tech. Manag (N = 2) 3.50 (2.12) 2.00 (0.00) 3.50 (2.12) 4.50 (0.71) 4.50 (0.71)
B) Right Purpose C) Usefulness of PAIS for Job D) Usefulness of PAIS for Organization
0 1 2 3 4
0 1 2 3 4
0 1 2 3 4
1.0 2.0 3.0 4.0 5.0 6.0 7.0 1.0 2.0 3.0 4.0 5.0 6.0 7.0 1.0 2.0 3.0 4.0 5.0 6.0 7.0
Absolute Nominations Absolute Nominations Absolute Nominations
very slight - 1, slight - 2, fairly slight - 3, slight nor high - 4, fairly high - 5, high - 6, very high - 7
N = number of questionnaires * overall number of supported workflows by the PAIS + Mean (Standard Deviation) for all data
Fig. 1. General Usefulness (Site 1).
Fig. 2A shows the data collected at Site 2. Obviously, results are more divergent when compared to the ones from Site 1 (though the general usefulness of the PAIS for the own organization is recognized as well).
A) Data from SITE 2: Means (Standard Deviation) General Usefulness Total Sample
(N = 15) 1.07 (0.26)+
2.93 (0.88) 3.53 (1.06) 4.00 (1.29) 4.80 (1.08)
Technical Staff (N = 4) 1.00 (0.00) 2.75 (0.96) 3.75 (0.96) 4.25 (1.71) 4.50 (1.29)
Research & Dev.
(N = 3) 1.00 (0.00) 3.67 (0.58) 3.00 (1.00) 4.67 (1.15) 5.67 (0.58)
Management (N = 2) 1.00 (0.00) 2.50 (0.71) 4.00 (0.00) 4.00 (1.41) 5.00 (0.00)
Clerical Staff (N = 4) 1.00 (0.00) 2.75 (0.96) 3.00 (1.41) 2.75 (1.71) 5.00 (0.00)
Tech. Manag (N = 2) 1.50 (0.71) 3.00 (1.41) 4.50 (0.71) 5.00 (0.00) 5.00 (0.71)
B) Right Purpose C) Usefulness of PAIS for Job D) Usefulness of PAIS for Organization
0 2 4 6 8
0 1 2 3 4 5 6
0 2 4 6 8
Number of Workflows in Use (* 2) Degree of Usage Right Purpose of PAIS Usefulness of PAIS for Job Usefulness of PAIS for Organization
Absolute Nominations Absolute Nominations Absolute Nominations
1.0 2.0 3.0 4.0 5.0 6.0 7.0 1.0 2.0 3.0 4.0 5.0 6.0 7.0 1.0 2.0 3.0 4.0 5.0 6.0 7.0
very slight - 1, slight - 2, fairly slight - 3, slight nor high - 4, fairly high - 5, high - 6, very high - 7
N = number of questionnaires * overall number of supported workflows by the PAIS + Mean (Standard Deviation) for all data
Fig. 2. General Usefulness (Site 2).
Part II. Fig. 3A shows the the mean and the standard deviation collected at Site 1 on the perceived impact of the PAIS on the considered job dimensions (cf. Section 2).
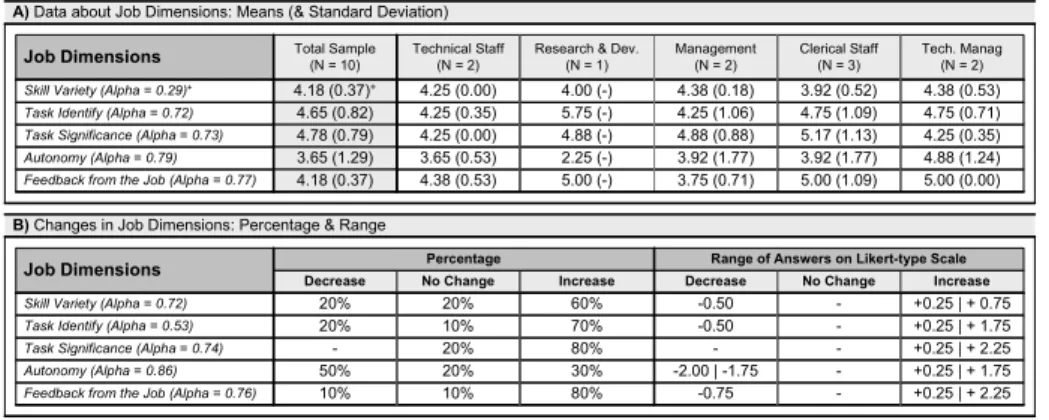
Regarding the perceived impact of the PAIS on the core job dimensions, we use another Likert-type scale than the one described in Part I (lot less: 1, less: 2, little less: 3, neither less nor more: 4, little more: 5, more: 6, lot more: 7).
Fig. 3B denotes for each job dimension the percentage of respondents perceiving a ”de- crease”, ”no change” or ”increase” in the respective job dimensions. Fig. 3B also shows the range of answers corresponding to the used Likert-type scale. In every job dimen- sion (except for the ”autonomy” dimension), most participants denote an increase.
A) Data about Job Dimensions: Means (& Standard Deviation)
B) Changes in Job Dimensions: Percentage & Range Job Dimensions
Skill Variety (Alpha = 0.29)+ Task Identify (Alpha = 0.72) Task Significance (Alpha = 0.73) Autonomy (Alpha = 0.79) Feedback from the Job (Alpha = 0.77)
Total Sample (N = 10) 4.18 (0.37)+
4.65 (0.82) 4.78 (0.79) 3.65 (1.29) 4.18 (0.37)
Technical Staff (N = 2) 4.25 (0.00) 4.25 (0.35) 4.25 (0.00) 3.65 (0.53) 4.38 (0.53)
Research & Dev.
(N = 1) 4.00 (-) 5.75 (-) 4.88 (-) 2.25 (-) 5.00 (-)
Management (N = 2) 4.38 (0.18) 4.25 (1.06) 4.88 (0.88) 3.92 (1.77) 3.75 (0.71)
Clerical Staff (N = 3) 3.92 (0.52) 4.75 (1.09) 5.17 (1.13) 3.92 (1.77) 5.00 (1.09)
Tech. Manag (N = 2) 4.38 (0.53) 4.75 (0.71) 4.25 (0.35) 4.88 (1.24) 5.00 (0.00)
Job Dimensions
Skill Variety (Alpha = 0.72) Task Identify (Alpha = 0.53) Task Significance (Alpha = 0.74) Autonomy (Alpha = 0.86) Feedback from the Job (Alpha = 0.76)
Decrease 20%
20%
- 50%
10%
No Change 20%
10%
20%
20%
10%
Increase 60%
70%
80%
30%
80%
Decrease -0.50 -0.50 - -2.00 | -1.75
-0.75
No Change - - - - -
Increase +0.25 | + 0.75 +0.25 | + 1.75 +0.25 | + 2.25 +0.25 | + 1.75 +0.25 | + 2.25 Percentage Range of Answers on Likert-type Scale
Likert-type Scale: a lot less - 1, less - 2, a little less - 3, neither less nor more - 4, a little more - 5, more - 6, a lot more - 7 N = number of questionnaires + Mean (Standard Deviation) for all data Alpha = Cronbach’s Alpha
Fig. 3. Impact on Job Dimensions (Site 1).
Finally, Fig. 4 shows the data collected at Site 2. When compared to Site 1, results are different. In all job dimensions most respondents neither recognize a significant increase nor a significant decrease.
A) Data about Job Dimensions: Means (& Standard Deviation)
B) Changes in Job Characteristics: Percentage & Range Job Dimensions
Skill Variety (Alpha = 0.29) Task Identify (Alpha = 0.72) Task Significance (Alpha = 0.73) Autonomy (Alpha = 0.79) Feedback from the Job (Alpha = 0.77)
Total Sample (N = 15) 4.07 (0.48)+
4.00 (0.57) 4.32 (0.39) 4.00 (0.53) 4.25 (0.37)
Technical Staff (N = 4) 4.06 (0.92) 3.63 (0.92) 4.19 (0.38) 3.63 (0.75) 4.06 (0.13)
Research & Dev.
(N = 3) 4.25 (0.25) 4.17 (0.52) 4.17 (0.29) 4.00 (0.00) 4.42 (0.52)
Management (N = 2) 4.00 (0.00) 4.00 (0.35) 5.00 (0.00) 4.75 (0.35) 4.50 (0.71)
Clerical Staff (N = 4) 3.94 (0.13) 4.19 (0.38) 4.31 (0.38) 4.00 (0.41) 4.13 (0.14)
Tech. Manag (N = 2) 4.12 (0.53) 4.13 (0.18) 4.13 (0.18) 4.00 (0.00) 4.38 (0.53)
Job Dimensions
Skill Variety (Alpha = 0.72) Task Identify (Alpha = 0.53) Task Significance (Alpha = 0.74) Autonomy (Alpha = 0.86) Feedback from the Job (Alpha = 0.76)
Decrease 20%
20%
- 13.3%
-
No Change 53.3%
46.7%
53.%
66.7%
53%
Increase 26.7%
33.3%
46.7%
20%
46.7%
Decrease -1.00 | -0.75 -1.75 | -0.25
- -1.50 | -0.50
-
No Change - - - - -
Increase +0.25 | + 1.25 +0.25 | + 0.75 +0.25 | + 1.00 +0.50 | + 1.00 +0.25 | + 1.00 Likert-type Scale: a lot less - 1, less - 2, a little less - 3, neither less nor more - 4, a little more - 5, more - 6, a lot more - 7
Percentage Range of Answers on Likert-type Scale
N = number of questionnaires + Mean (Standard Deviation) for all data Alpha = Cronbach’s Alpha
Fig. 4. Impact on Job Dimensions (Site 2).
Discussion. This section summarizes the main trends that can be derived from the col- lected data. Thereby, we focus on the impact of the PAIS on the analyzed job dimensions and neglect the self-explanatory results on the usefulness of the PAIS:
– Skill Variety: Our results show (cf. Fig. 3 and Fig. 4) that the majority of partici- pants perceive no decrease in skill variety (some even perceive a slight increase).
– Task Identity: PAIS often provide only that data to the user which is needed for the execution of an activity (”context tunneling”). Hence, one may expect a decrease in the task identity dimension, e.g., due to the feeling of being less involved as employees have no overview of entire ”work cases” anymore. However, at both sites, our data does not show significant decrease in task identity.
– Task Significance: One might also conclude that working with a PAIS may lead to an increasing task significance, e.g., as employees perceive their job as being more important and become aware of the inherent interdependence of their work.
Generally, our data confirms this and shows a slightly increasing task significance.
– Autonomy: Generally, our data only shows a minor decrease of perceived autonomy at Site 1 (cf. Fig. 3). Only the ”Research & Development” and the ”Management”
user group perceive a stronger drop. At Site 2, by contrast, our data shows no sig- nificant change in the autonomy dimension (cf. Fig. 4). Since the PAIS generally adopts a less important role at Site 2 (by means of a smaller number of supported workflows), this allows for the conclusion that autonomy decreases with an increas- ing amount of supported workflows.
– Feedback from the Job: At both sites, our data shows that working with PAIS gives end users more direct feedback on their performance. Only the ”Management” user group at Site 1 negates this (cf. Fig. 3).
Related Work. There exist only few studies which address organizational changes en- abled by PAIS, mainly in the field of workflow technology. Sarmento and Machado [3], for example, propose a framework to investigate the impact of a WfMS on an organiza- tion. In [4], they additionally describe changes enabled by WfMS as well as approaches to evaluate such changes. In his qualitative study [5], Kueng states that ”through the use of a workflow system, jobs become more structured and more routine”.
3 Summary
This paper has summarized the results of a case study at two Dutch companies in which we investigate how employees perceive the impact of a newly introduced process design and its implementation based on a PAIS. Thereby, we analyze the perceived impact along the five core job dimensions of the job characteristics model.
References
1. Hackman, R.J., Oldham, G.R.: Development of the Job Diagnostic Survey. Journal of Applied Psychology, 60(2), pp.159-170 (1975)
2. Hackman, R.J., Oldham, G.R.: Motivation through the Design of Work: Test of a Theory.
Organizational Behavior & Human Performance, 16(2), pp.250-279 (1976)
3. Sarmento, A., Machado, A.: The Adoption of Workflow Systems: Proposal of a Model for a Methodology to Analysis the Impact of Workflow Systems in Organizations. 2nd Int’l. Conf.
on Enterprise Information Systems (ICEIS ’00), pp.349-355 (2000)
4. Sarmento, A., Machado, A.: Impact Evaluation of Organisational Changes Enabled by Work- flow Systems. 6th Int’l. Workshop on Groupware (CRIWG ’00), pp.134-137 (2000) 5. Kueng, P.: The Effects of Workflow Systems on Organization: A Qualitative Study. Business
Process Management, LNCS 1806, pp. 301-316 (2000)