BioOne Complete (complete.BioOne.org) is a full-text database of 200 subscribed and open-access titles in the biological, ecological, and environmental sciences published by nonprofit societies, associations, museums, institutions, and presses.
Your use of this PDF, the BioOne Complete website, and all posted and associated content indicates your acceptance of BioOne’s Terms of Use, available at www.bioone.org/terms-of-use.
Usage of BioOne Complete content is strictly limited to personal, educational, and non-commercial use.
Commercial inquiries or rights and permissions requests should be directed to the individual publisher as copyright holder.
BioOne sees sustainable scholarly publishing as an inherently collaborative enterprise connecting authors, nonprofit
publishers, academic institutions, research libraries, and research funders in the common goal of maximizing access to critical research.
Toward the Morphometric Calibration of the Environmental Biorecorder Arctica islandica
Authors: Salma Begum, Doris Abele, and Thomas Brey
Source: Journal of Coastal Research, 35(2) : 369-375
Published By: Coastal Education and Research Foundation
URL: https://doi.org/10.2112/JCOASTRES-D-18-00002.1
Begum, S.; Abele, D., and Brey, T., 2019. Toward the morphometric calibration of the environmental biorecorderArctica islandica.Journal of Coastal Research,35(2), 369–375. Coconut Creek (Florida), ISSN 0749-0208.
Owing to its extremely long life span and occurrence in the entire North Atlantic, the Arctic borealArctica islandicahas become of particular significance for monitoring the environment, because information on past environmental conditions is archived in morphological and biogeochemical properties of the calcareous shell. To evaluate whether such properties are comparable between different localities, shell and soft body morphometry of sixA. islandicapopulations, Norwegian Coast, Kattegat, Kiel Bay (Baltic), White Sea, German Bight (North Sea), and off NE Iceland, were compared.
Discriminant analysis indicated distinct differences between populations, albeit not related to geographical distance, but more likely to local hydrography, bottom morphology, and food regime.
ADDITIONAL INDEX WORDS: Population, mollusc, morphometry, soft body mass, environment.
INTRODUCTION
The Arctic borealArctica islandica is among the longest- lived and slowest growing marine bivalves (Jones, 1980;
Murawski, Ropes, and Serchuk, 1982; Thompson, Jones, and Dreibelbis, 1980). Individuals over 100 years old are common (Kraus et al., 1992; Ropes and Murawski, 1983) and a maximum age above 400 years is reported from Iceland (Abele et al., 2008).Arctica islandicacan live at temperatures between 6 and 168C (Butler et al.,2013; Mann, 1982) and shows a correspondingly wide distribution across the boreoarctic continental shelves on either side of the North Atlantic Ocean.
At the east Atlantic Coast it ranges from the White Sea and Barents Sea to Iceland and the F ˚ar Islands and to the Bay of Biscay in the south, and at the west Atlantic Coast it is found from Labrador to North Carolina (Abbott, 1974; Brey et al., 1990; Nicol, 1951; Witbaard, Duineveld, and de Wilde, 1999).
Arctica islandicaoccurs at depths down to 482 m (Nicol, 1951), although it is commonly found between 10 and 280 m (Kennish and Lutz, 1995; Merrill and Ropes, 1969; Rowell and Chaisson, 1983; Thompson, Jones, and Ropes, 1980).
There is considerable knowledge on anatomy (Borettoet al., 2014; Morton, 2011; Palmer, 1979), behaviour (Taylor, 1976), ecophysiology (Ballesta-Artero et al., 2017; Bayne, 1971;
Tschischka, Abele, and Portner, 2000), and population dynam- ics (Breyet al., 1990; Murawski, Ropes, and Serchuk, 1982;
Thompson, Jones, and Ropes, 1980), the latter being particu- larly interesting for the management of commercial fisheries of A. islandica. Recently, longevity ofA. islandicawas the focus of interest in this species: on the one hand, physiologists study the cellular mechanisms of ageing (Abeleet al., 2008; Strahlet al., 2007); on the other hand climatologists and ecologists are
interested in the calcareous archive provided by the shell that contains morphological and biogeochemical information on past environmental conditions (Bonitzet al., 2018; Lohmann and Sch¨one, 2013; Marali and Sch¨one, 2015; Milano et al., 2017). It is important for determining which conditions will assist conservation managers in their global effort to calibrate this biorecorder species and to predict the future environmen- tal scenario (e.g.,Finkl and Makowski, 2015; Makowski, Finkl, and Rusenko, 2013; Makowski, Seminoff, and Salmon, 2006;
Von Leesenet al.,2017).
Owing to its extremely long life span and wide geographical distribution,A. islandicais a prospective model organism for studies of climate change effects on northern boreal marine ecosystems (Jones, 1980; Murawski, Ropes, and Serchuk, 1982). To make A. islandica a ‘‘standard’’ biorecorder of northern boreal coastal and shelf systems, it is necessary to check whether individuals from different populations are comparable in their biology throughout the distributional range. Begumet al. (2009) have measured the ecophysiological requirement of A. islandica from similar populations; the authors proposed a general respiration model that links individual metabolic rates. Again, on the basis of the von Bertalanffy growth models and size–mass relationships, the authors showed thatA.islandicapopulations differed distinctly in maximum life span, but less in growth performance; lifetime energy investment distinctly shifted from somatic to gonad production with increasing life span (Begum et al., 2010).
Therefore an important step is to check for differences in body size and mass among populations. Size differences were found in many bivalve species (seee.g., Abbot, 1974; Daniels, Stewart, and Gibbons, 1998; Hateleyet al., 1992; Papadopoulouet al., 2002; Schwaninger, 1999) and also inA. islandicaby Holmes, Witbaard, and Van der Meer (2003).
This research intends (1) to compare severalA. islandica populations by means of shell and soft tissue parameters and DOI: 10.2112/JCOASTRES-D-18-00002.1 received 7 January 2018;
accepted in revision 17 April 2018; corrected proofs received 24 May 2018.
*Corresponding author: samee2005@gmail.com
ÓCoastal Education and Research Foundation, Inc. 2019
(2) to evaluate whether differences in body size and mass can be related to differences in salinity and temperature regime.
METHODS
Arctica islandicasamples were collected using dredges from six different sites: Norwegian Coast, Kattegat, Kiel Bay (Baltic), White Sea, German Bight (North Sea), and off NE Iceland (Figure 1). All samples were collected in 2006 except those from NE Iceland, which were collected in 2004 and 2005.
From NE Iceland, only shells were available, whereas animals from the other sites were transported alive to the Alfred Wegener Institute for Polar and Marine Research, Bremer- haven, Germany, where they were used in physiological experiments before morphological analysis.
Statistical and Morphometric Analysis
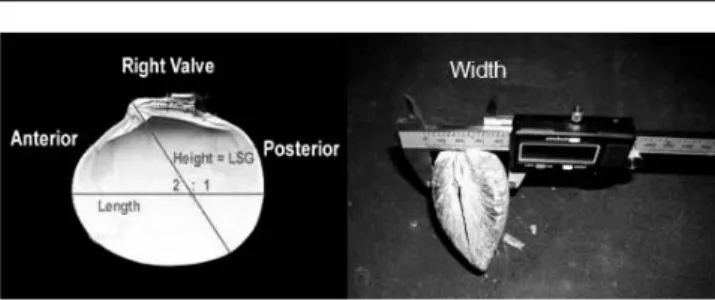
Different parameters were determined (Figure 2),e.g.,shell length (L; greatest anteroposterior distance) shell height (H;
greatest distance from umbo to ventral shell margin, not perpendicular toL), shell width (W; greatest distance through both valves to the lower 0.1 mm), and shell mass (M; air-dried mass of both valves) with 0.001-g precision. Wet mass (WM;
soft tissue drained on paper), dry mass (DM; 48 h at 608C), and ash mass (Ash; 24-h incineration at 5008C) were determined with 0.001-g precision. Water fraction was computed as (WM DM)/WM.
Before comparative analysis, the effect of animal size on the selected parameters in question had to be removed from the data. The approach applied by Krzanowski (1993) and Holmes, Witbaard, and Van der Meer (2003), i.e. dividing the shell parameter in question by shell width, did not remove all size effects (tested by analysis of variance). Therefore a more elaborate approach was chosen in a first step and computed for each animal standard size SS and standard volume SV for each animal as:
SS¼ ðL3W3HÞ1=3 ð1Þ
and
SV¼ ðL3H3WÞ: ð2Þ
Then, linear regressions of size measures on SS and of mass measures on SV were established using all data from all populations, where a is intercept and b the slope of the respective regression:
size measure¼aþb3SS ð3Þ mass measure¼aþb3SV: ð4Þ The residualsYR¼(YmeasuredYestimated) of these regressions proved to be independent of animal size and thus were used as unbiased shell morphometric and soft tissue parameters (LR, HR,WR,MR, residual water fraction [WFR], AshR, residual ash- free dry mass [AFDMR]) in the following analysis.
Analysis
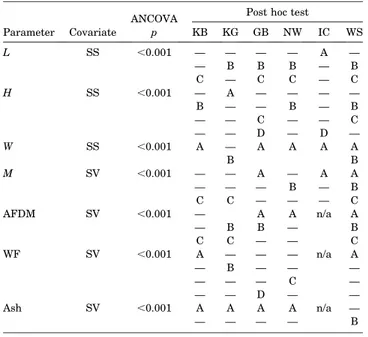
For each parameter (L, H, W, M, WF, Ash, AFDM), differences between populations were analysed by analysis of covariance (ANCOVA with covariate SS or SV, respectively) with subsequent post hoc test on differences between means.
Then, discriminant analysis was used to compare populations on the basis of all parameters (LR,HR,WR,MR, WFR, AshR, AFDMR) simultaneously (Fraley and Raftery, 2002). Owing to the fact that no soft body data were available for the NE Iceland population, two analyses were performed, one on the basis of shell parameters including all six populations (N¼427), and one on the basis of shell and soft body parameters (N¼223) excluding the NE Iceland population. Multivariate outliers in the sample space were identified by Mahalanobis jackknife distances (Barnett and Lewis, 1994) and excluded from further analysis.
RESULTS
Mahalanobis analysis identified 9 outliers in the first data set (shell parameters) and 10 outliers in the second data set (shell and soft body parameters). The number of data available for analysis was reduced to 418 and 213, accordingly.
Shell size distributions differ distinctly between populations (Figure 3). Smaller animals,30 mm are completely missing in German Bight and Kattegat, whereas White Sea is restricted to animals,40 mm. The majority of Norway animals were.60 mm.
ANCOVA identified significant differences between popula- tions in every parameter, but there was no consistent overall Figure 1. Sample locations ofArctica islandica. NW: Norwegian Coast; KG:
Kattegat; GB: German Bight; WS: White Sea; IC: Iceland; KB: Kiel Bay. Map redrawn from www.aquarius.geomar.de.
Figure 2. Shell measurements (height, length, width) technique ofArctica islandicafrom six different populations of NE Atlantic Ocean (Norwegian Coast, Kattegat, German Bight, White Sea, Iceland, Kiel Bay).
Journal of Coastal Research, Vol. 35, No. 2, 2019
370 Begum, Abele, and Brey
pattern, i.e. populations did not group similarly for each parameter (Table 1).
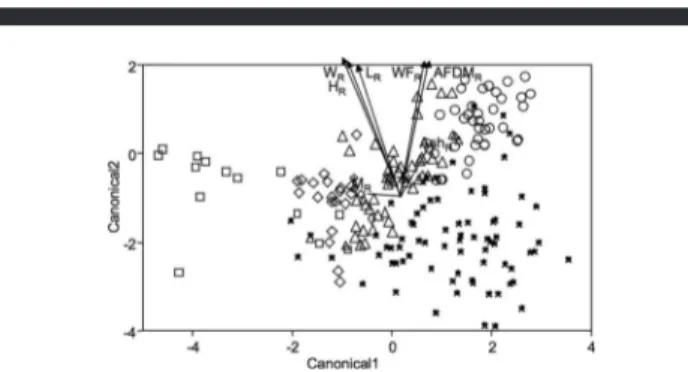
Discriminant plot (Figure 4) and corresponding match–
mismatch tables (Tables 2, 3) indicate distinct differences between populations on the basis of shell morphology. In terms of the share of animals classified correctly, White Sea has the most distinct population (100%), followed by German Bight (82%). Iceland, Kattegat, and Norway at a similar level (77, 75, and 74%), whereas Kiel Bay is distinctly less well defined (38%). In terms of animals misclassified into a certain population, German Bight takes the lead (only 0.8% of total), followed by Kiel Bay (1.4%), Iceland (5.3%), Kattegat (7.4%), Norway (8.8%), and White Sea (9.5%). Judging from the number of animals misclassified in either direction (Table 3),
Kattegat and Norway are most similar (13.5% of Kattegatþ Norway), followed by Kiel Bay and White Sea (11.6%). German Bight and Iceland (0.7%), German Bight and Kattegat (0%), as well as Kattegat and White Sea (0%) do not mix at all. Shell widthWRhas the strongest discriminative effect, followed by HRandLR, which all point in nearly the same direction (Figure 4). The effect of shell mass MR is distinctly weaker and independent of shell size effects (about 908in Figure 4).
Discriminant analysis indicates a quite similar pattern when based on both shell and soft tissue parameters (Figure 5, Tables 4, 5). The most remarkable difference is the much better definition of Kiel Bay, where 58% (Table 4) were correctly classified compared with 38% (Table 2) above. Overall separation between populations increases slightly in terms of animals correctly classified (79%vs. 71%, Tables 4 and 2).
Again, shell widthWRhas the strongest discriminative effect, followed by HR and LR, which all point in about the same direction (Figure 5). The effects of shell massMRand of soft tissue mass parameters WFR, AshR,and AFDMRare distinctly Figure 3. Standard size (L3H3W)1/3frequency distribution ofArcrtica
islandica. NW: Norwegian Coast; KG: Kattegat; GB: German Bight; WS:
White Sea; IC: Iceland; KB: Kiel Bay.
Table 1. Analysis of covariance (ANCOVA) of differences in shell and soft tissue parameters between populations. Populations not separated by the post hoc test are marked with the same letter. NW¼Norwegian Coast, KG¼ Kattegat, GB¼German Bight, WS¼White Sea, IC¼Iceland, KB¼Kiel Bay. L¼shell length,H¼shell height,W¼shell width,M¼shell mass, AFDM¼ash-free dry mass, WF¼water fraction, Ash¼ash fraction, SS¼ standard size, SV¼standard volume; n/a¼not applicable.
Parameter Covariate
ANCOVA Post hoc test
p KB KG GB NW IC WS
L SS ,0.001 — — — — A —
— B B B — B
C — C C — C
H SS ,0.001 — A — — — —
B — — B — B
— — C — — C
— — D — D —
W SS ,0.001 A — A A A A
B B
M SV ,0.001 — — A — A A
— — — B — B
C C — — — C
AFDM SV ,0.001 — A A n/a A
— B B — B
C C — — C
WF SV ,0.001 A — — — n/a A
— B — — —
— — — C —
— — D — —
Ash SV ,0.001 A A A A n/a —
— — — — B
Figure 4. Discrimination analysis on the basis of shell parameters.LR: length residuals;WR: width residuals;HR: height residuals; andMR: shell mass residuals. Data plotted on the first and second canonical axes. Lines indicate strength and direction of parameter effects (arrowheads indicate that lines are longer than shown). Triangles: Kiel Bay; diamonds: White Sea; squares:
German Bight; stars: Norwegian Coast; circles: Kattegat; crosses: Iceland.
Table 2.Match–mismatch matrix derived from the discriminant analysis on the basis of shell morphology. Each row shows how the animals of one population are placed into each of the six populations compared. % MM is the number of animals wrongly placed into this population in terms of all animals analysed minus the number of animals in this population; % TF is total match and mismatch fraction; % CM is the number of animals of this population matched correctly in terms of total number of animals in this population. Each column shows how many animals of each of the six populations have been grouped into one particular population. NW¼ Norwegian Coast, KG¼Kattegat, GB¼German Bight, WS¼White Sea, IC
¼Iceland, KB¼Kiel Bay.
Population Total KB GB IC KG NW WS % CM % TF
KB 73 28 0 9 10 13 13 38.4 72.0
GB 39 0 32 1 0 0 6 82.1
IC 97 1 0 75 9 1 11 77.3
KG 70 2 0 1 53 14 0 75.7
NW 100 2 3 6 9 74 6 74.0
WS 39 0 0 0 0 0 39 100.0
% MM 1.4 0.8 5.3 7.4 8.8 9.5 28.0
weaker and apparently independent of the shell size effects, but the effects are in opposition (Figure 5).
DISCUSSION
The research was done on the basis of the morphometric data set of Arctica islandicafrom six different sites. Though the stepwise methods were well defined throughout the research, there are still some concerning steps to make the research more meaningful for calibrating theA. islandicapopulations.
Methodology
The linear regression approach removed all detectable size effects from shell and soft tissue parameters. Nevertheless, the distinct differences in sample shell size range between populations (Figure 3) may have introduced further, albeit undetectable, bias into our analysis, if the relationships between analysed parameters and SS (or SV) change with size and if the mode of this change differs between populations.
Such bias can be avoided only by comparing identical size ranges across populations, which was not possible here.
The comparison of populations on the basis of single parameters produced a rather inconsistent picture (Table 1).
Nevertheless, the‘‘holistic’’approach by means of discriminant analysis indicated distinct separation between populations (Figures 4 and 5). Moreover, adding soft tissue parameters to the analysis improved the level of separation between populations. The following will discuss two questions: (1)
which parameters contribute most to the separation of populations, and why; and (2) how are the six populations related to each other morphologically, and which external factors may force morphological differentiation.
Both discriminant analyses (shell parameters only, and shell þsoft tissue parameters) indicate that shell widthWRis the most significant factor, followed by the other two shell dimensions (Figures 4 and 5),i.e. shells differ most distinctly in shape, whereas shell massMRis less distinctive. Soft tissue WFR and AFDMR are almost as important as shell shape (Figure 4). Their inclusion increases overall accuracy just slightly from 72% to 79% correct matches, but enhances the definition of Kiel Bay dramatically (Figure 6), except in comparison with White Sea. Contrary to the findings of ANCOVA (Table 1), shell mass has the least discriminating power (Figures 4 and 5). On the other hand, soft tissue mass is as important as shell shape in separating populations (Figure 5). The most likely explanation might be the synergistic effects of salinity and temperature that affect the organism’s somatic mass (e.g.,Heilmeyaret al., 2008; Shumway, 1996).
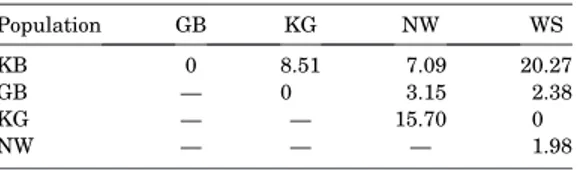
Table 3. Reciprocal mismatch matrix derived from the discriminant analysis on the basis of shell morphology. Each value indicates the rate of mismatch for a particular pair of populations in either direction in terms of percentage of the sum of both populations. NW¼Norwegian Coast, KG¼ Kattegat, GB¼German Bight, WS¼White Sea, IC¼Iceland, KB¼Kiel Bay.
Population GB (%) IC (%) KG (%) NW (%) WS (%)
KB 0 5.89 8.39 8.67 11.60
GB — 0.73 0 2.15 7.69
IC — — 5.99 3.56 8.09
KG — — — 13.53 0
NW — — — — 4.32
Figure 5. Discrimination analysis on the basis of shell and soft tissue parameters.LR: length residuals;WR: width residuals;HR: height residuals;
MR: shell mass residuals; WFR: water fraction residuals; AFDMR: ash-free dry mass residuals; AshR: ash fraction residuals. Data plotted on the first and second canonical axes. Lines indicate strength and direction and of parameter effects (arrowheads indicate that lines are longer than shown).
Triangles: Kiel Bay; diamonds: White Sea; squares: German Bight; stars:
Norwegian Coast; circles: Kattegat.
Figure 6. Two-dimensional match–mismatch plot for all populations and both analyses. Triangles: Kiel Bay; diamonds: White Sea; squares: German Bight; stars: Norwegian Coast; circles: Kattegat; and crosses: Iceland. Open symbols: discriminant analysis on the basis of shell parameters; closed symbols: shell and soft tissue parameters.
Table 4.Match–mismatch matrix derived from the discriminant analysis on the basis of shell and soft tissue parameters. Each row shows how the animals of one population are placed into each of the five populations compared. % CM is the number of animals of this population matched correctly in terms of total number of animals in this population. Each column shows how many animals of each of the five populations have been grouped into one particular population. % MM is the number of animals wrongly placed (matched) into this population in terms of all animals analysed minus the number of animals in this population. % TF is total match and mismatch fraction. NW¼Norwegian Coast, KG¼Kattegat, GB
¼German Bight, WS¼White Sea, IC¼Iceland, KB¼Kiel Bay.
Population Total KB GB KG NW WS % CM % TF
KB 50 29 0 6 2 13 58.0 78.9
GB 18 1 16 0 1 1 88.9
KG 44 2 0 35 8 0 79.5
NW 77 7 2 11 61 2 79.2
WS 24 2 0 0 0 22 91.7
% MM 7.4 1.0 10.0 8.0 8.5 21.1
Journal of Coastal Research, Vol. 35, No. 2, 2019
372 Begum, Abele, and Brey
Relations between Populations
Generally, the six populations appear to be well separated morphologically (72% and 79% correct matches, Tables 2 and 4), but a pairwise comparison reveals obvious differences in definition. The reciprocal mismatch matrices (Tables 3 and 5) indicate that two pairs of populations are quite similar, Kiel Bay and White Sea (11.60% and 20.27% reciprocal mismatch in the first and second analyses, respectively), and Kattegat and Norway (13.53% and 15.70%). Kiel Bay and White Sea populations live in similar distinctly polyhaline environments with an average salinity of 25 (Table 6). Salinity is known to affect morphology in many organisms (e.g.,Cuesta and Anger, 2005; Grieve, Shannon, and Dierig, 1999; Marali and Sch¨one, 2015). In bivalve molluscs, primarily shell thickness and mass have been reported to correlate with salinity, but the findings of this research indicate that shell shape may be affected, too, thus confirming observations of Zettler, Bonsch, and Gosselck (2001). Regarding the similarity of Kattegat and Norway, there is no obvious explanation. Information on environmental conditions is insufficient to identify a common feature that separates these two sites from the remaining ones. Besides, and in combination with salinity, temperature may be significant (e.g., Davis and Calabrese, 1964; Lohmann and Sch¨one, 2013; Sch¨oneet al., 2003a,b; Shumway, 1996), but even more important are bottom topology and sediment properties (e.g., Hiebenthal et al., 2012; Sejrup et al., 2000; Witbaard, Jansma, and Sass Klaassen, 2003). Finally, the food regime (amount and variability) may also have an effect (Ballesta- Arteroet al., 2017, 2018). One might speculate that the setting of these two sites is rather similar,e.g., semiprotected coastal transitional sites (e.g., Berggrenaet al., 1999), but complete evidence is still missing. Eventually the outcome of complex interactions of many factors may cause the apparent morpho- logical similarity, as described in several studies (e.g.,Bataller, Boghen, and Burt, 1999; Lohmann and Sch¨one, 2013; Wit- baard, Jansma, and Sass Klaassen, 2003). Local environment
explanation for this finding. The German Bight is a hydrody- namically very active and variable area, strongly affected by tidal currents, storms, and riverine input (Eppl´eet al., 2006;
Marali and Sch¨one, 2015). The causal links between these features andArcticamorphology, however, are still unclear.
Overall, the morphological differences between populations do not correlate with geographical distance (Figures 1, 4, and 5). Holmes, Witbaard, and Van der Meer (2003) observed a similar pattern in a different set ofA. islandicapopulations (four North Sea: Oyster Ground, Fladen Ground, Outer Gullmarsfjord, Inner Gullmarsfjord, and one Canadian: Nova Scotia). The authors found that genetic distance was indepen- dent of geographical distance, as well as little evidence that morphological differences coincide with genetic differentiation.
Obviously, shell morphology ofA. islandicais forced by local environmental conditions (Eppl´e et al., 2006; Holmes, Wit- baard, and Van der Meer, 2003; Kr¨onckeet al., 2004; Sch¨oneet al.,2003c), and rather not controlled by specific genes. Similar findings in Antarctic limpets (Mauro, Arcuelo, and Parrinello, 2003) support the idea that this might be a general feature in benthic molluscs. Consequently, Dahlgren, Weinberg, and Halanych (2000) also compared the morphological and genetic variations of different A. islandica populations from the western Atlantic Coast and found that the morphological variation is forced by local environment too! The authors’ next research approach will be to check whether or not morpholog- ical distances reflect genetic distances between A. islandica populations.
CONCLUSIONS
The present research confirms distinct morphological differ- ences among populations ofA. islandicathat are environmen- tally but possibly not genetically driven. Discriminant analyses (shell parameters only, and shellþsoft tissue parameters) indicate that shell width was the parameter that contributed more to the separation of populations. Nevertheless, they may be accompanied by population-specific physiological adapta- tions that affect the shell formation process and thus morphological and biogeochemical shell properties. Thus, a
NW — — — 1.98
Table 6. Arctica islandica sample size and site information.
Population Site Coordinates Depth (m)
Salinity (annual mean)
Temp.
(annual mean)
Sample Size (total number) Shell
Morphometrics
Tissue Mass
Norwegian Coast 698390N, 188570E 10–30 33 4 100 77
Kattegat 568090N, 118480E 33 31 8 70 44
Kiel Bay 548320N, 108420E 25 25 10 73 50
White Sea 668180N, 338380E 10 25 4 39 24
German Bight 548090N, 078470E 40 31 10 39 18
Iceland 668020N, 148480W 14–22 35 5 97 —
comparative calibration of such properties is recommended to make archives from different populations comparable.
ACKNOWLEDGMENTS
The authors are indebted to L. Camus (Norway animals), M. Sejr (Kattegat animals), and J. Strahl (shell data from the Iceland population). S.B. was funded through a Helmholtz–
DAAD fellowship.
LITERATURE CITED
Abbott, R.T., 1974.American Seashells. New York: Van Nostrand and Reinhold, 663p.
Abele, D.; Strahl, J.; Brey, T., and Philipp, E.E.R., 2008. Impercep- tible senescence: Ageing in the ocean quahogArctica islandica.
Free Redical Research, 42(5), 474–480.
Ballesta-Artero, I.; Janssen, R.; van der Meer, J., and Witbaard, R., 2018. Interactive effects of temperature and food availability on the growth ofArctica islandica(Bivalvia) juveniles.Marine Environ- mental Research, 133, 67–77.
Ballesta-Artero, I.; Witbaard, R.; Carroll, M.L., and van der Meer, J., 2017. Environmental factors regulating gaping activity of the bivalve Arctica islandica in Northern Norway. Marine Biology, 164, 116–127.
Barnett, V. and Lewis, T., 1994. Outliers in Statistical Data. New York: Wiley, 134p.
Bataller, E.E.; Boghen, A.D., and Burt, M.D.B., 1999. Comparative growth of the eastern oysterCrassostrea virginica(Gmelin) reared at low and high salinities in New Brunswick, Canada.Journal of Shellfish Research, 18, 107–114.
Bayne, B.L., 1971. Oxygen consumption by three species of lamelli- branch molluscs in declining ambient oxygen tension.Comparative Biochemistry and Physiology, 40(a), 955–970.
Begum, S.; Basova, L.; Heilmayer, O.; Philipp, E.; Abele, D., and Brey, T., 2010. Growth and energy budget models of the bivalveArctica islandica at 6 different sites in the Northeast Atlantic realm.
Journal of Shellfish Research,29(1), 1–9.
Begum, S.; Basova, L.; Strahl, J.; Sukhotin, A.; Heilmayer, O.;
Philipp, E.; Brey, T., and Abele, D., 2009. A metabolic model for the ocean quahogArctica islandica—Effects of animal mass and age, temperature, salinity and geography on respiration rate.Journal of Shellfish Research,28(3), 533–539.
Berggrena, P.; Ishaq, R.; Zeb ¨uhr, Y.; N ¨af, C.; Bandh, C., and Broman, D., 1999. Patterns and levels of organochlorines (DDTs, PCBs, non- ortho PCBs and PCDD/Fs) in male harbour porpoises (Phocoena phocoena) from the Baltic Sea, the Kattegat–Skagerrak Seas and the west coast of Norway.Marine Pollution Bulletin, 38(12), 1070–
1084.
Bonitz, F.G.W.; Dahl, C.A.; Trofimova, T., and Ha´t ´un, H., 2018.Links between phytoplankton dynamics and shell growth of Arctica islandicaon the Faroe Shelf.Journal of Marine Systems,179, 72–
87.
Boretto, G.M.; Baranzelli, M.C.; Gordillo, S.; Consoloni, I.; Zanchetta, G., and Mora´n, G., 2014. Shell morphometric variations in a Patagonian Argentina clam (Ameghinomya antiqua) from the Mid Pleistocene (MIS 7) to the present.Quaternary International, 352, 48–58.
Brey, T.; Arntz, W.E.; Pauly, D., and Rumohr, H., 1990. Arctica (Cyprina) islandicain Kiel Bay (Western Baltic): Growth, produc- tion and ecological significance.Journal of Experimental Marine Biology and Ecology, 136, 217–235.
Butler, P.G.; Wanamaker, A.D. Jr.; Scourse, J.D.; Richardson, C.A., and Reynolds, D.J., 2013. Variability of marine climate on the North Icelandic Shelf in a 1357-year proxy archive based on growth increments in the bivalve Arctica islandica. Palaeogeography, Palaeoclimatology, Palaeoecology, 373, 141–151.
Cuesta, J.A. and Anger, K., 2005. Larval morphology and salinity tolerance of a land crab from West Africa,Cardisoma armatum (Brachyura: Grapsoidea: Gecarcinidae). Journal of Crustacean Biology,25(4), 640–654.
Dahlgren, T.G.; Weinberg, J.R., and Halanych, K.M., 2000. Phylo- geography of the ocean quahog (Arctica islandica): Influences of paleoclimate on genetic diversity and species range. Marine Biology, 137, 487–495.
Daniels, S.R.; Stewart, B.A., and Gibbons, M.J., 1998. Genetic and morphometric variation in the potamonautid river crabPotamo- nautes parvispina (Decapoda: Potamonautidae) from 2 Western Cape rivers, South Africa.Journal of Natural History,32, 1245–
1258.
Davis, H.C. and Calabrese, A., 1964. Combined effects of temperature and salinity on development of eggs and growth of larvae ofM.
mercenaria and C. virginica. Fishery Bulletin and Fisheries Wildlife Survey,63, 643–655.
Eppl ´e, V.M.; Brey, T.; Witbaard, R.; Kuhnert, H., and P ¨atzold, J., 2006. Sclerochronological records of Arctica islandica from the inner German Bight.Holocene,16(5), 763–769.
Finkl, C.W. and Makowski, C., 2015. Auto classification versus cognitive interpretation of digital bathymetric data in terms of geomorphological features for seafloor characterization.Journal of Coastal Research,31(1), 1–16.
Fraley, C. and Raftery, A.E., 2002. Model-based clustering, discrim- inant analysis, and density estimation.Journal of the American Statistical Association,97(458), 611–631.
Grieve, C.M.; Shannon, M.C., and Dierig, D.A., 1999. Salinity effects on growth, shoot–ion relations, and seed production ofLesquerella fendleri.In:Janick, J. (ed.),Perspectives on New Crops and New Uses. Alexandria, Virginia: ASHS Press, pp. 239–243.
Hateley, J.G.; Grant, A.; Taylor, S.M., and Jones, M.V., 1992.
Morphological and other evidence on the degree of genetic differentiation between populations ofNereis diversicolor.Journal of the Marine Biological Association UK,72, 365–381.
Heilmayer, O.; DiGialleonardo, J.; Qian, L., and Roesijadi, G., 2008.
Stress tolerance of a subtropicalCrassostrea virginicapopulation to the combined effects of temperature and salinity. Estuarine, Coastal and Shelf Science,doi:10.1016/j.ecss 2008–03–022.
Hiebenthal, C.; Philipp, E.E.R.; Eisenhauer, A., and Wahl, M., 2012.
Interactive effects of temperature and salinity on shell increment, condition and cellular stress of two bivalve populations,Mytilus edulis(L.) andArctica islandica(L.), from the Western Baltic Sea.
Aquatic Biology, 14, 289–298.
Holmes, S.P.; Witbaard, R., and Van der Meer, J., 2003. Phenotypic and genotypic population differentiation in the bivalve mollusc Arctica islandica: results from RAPD analysis.Marine Ecology Progress Series,254, 163–176.
Jones, D.S., 1980. Annual cycle of shell growth increment formation in two continental shelf bivalves and its paleoecologic significance.
Paleobiology, 6, 331–340.
Kennish, M.J. and Lutz, R.A., 1995. Assessment of the ocean quahog, Arctica islandica (Linnaeus, 1767), in the New-Jersey Fishery.
Journal of Shellfish Research, 14, 45–52.
Kraus, M.G.; Beal, B.F.; Chapman, S.R., and McMartin, L., 1992. A comparison between growth rates inArctica islandica(Linnaeus, 1767) between field and laboratory populations. Journal of Shellfish Research, 11, 289–294.
Kr ¨oncke, I.; Stoeck, T.; Wieking, G., and Paloj ¨arvi, A., 2004.
Relationship between structural and trophic aspects of microbial and macrofaunal communities in different areas of the North Sea.
Marine Ecology Progress Series,282, 13–31.
Krzanowski, W.J., 1993.Principles of Multivariate Analysis, A User’s Perspective. Oxford: Clarendon Press, 234p.
Lohmann, G. and Sch¨one, B.R., 2013. Climate signatures on decadal to interdecadal time scales as obtained from mollusk shells (Arctica islandica) from Iceland.Paleogeography, Paleoclimatology, Paleo- ecology, 373, 152–162.
Makowski, C.; Finkl, C.W., and Rusenko, K., 2013. Suitability of recycled glass cullet as artificial dune fill along coastal environ- ments.Journal of Coastal Research,29 (4), 772–782.
Makowski, C.; Seminoff, J.A., and Salmon, M., 2006. Home range and habitat use of juvenile Atlantic green turtles (Chelonia mydasL.) on shallow reef habitats in Palm Beach, Florida, USA.Marine Biology,148, 1167–1179.
Journal of Coastal Research, Vol. 35, No. 2, 2019
374 Begum, Abele, and Brey
surf clam and ocean quahog.Proceedings of the Natural Shellfish Association, 59, 40–45.
Milano, S.; Nehrke, G.; Wanamaker, A.D. Jr.; Ballesta-Artero, I.;
Brey, T., and Sch¨one, B.R., 2017. The effects of environment on Arctica islandicashell formation and architecture.Biogeosciences, 14, 1577–1591.
Morton, B., 2011.The biology and functional morphology ofArctica islandica (Bivalvia: Arcticidae)—A gerontophilic living fossil.
Journal of Marine Biology Research, 7(6), 540–553.
Murawski, S.A.; Ropes, J.W., and Serchuk, F.M., 1982. Growth of the ocean quahog, Arctica islandica, in the Middle Atlantic Bight.
Fishery Bulletin,80, 21–34.
Nicol, D., 1951. Recent species of the Veneriod pelecypodArctica.
Journal of Washington Academy of Science, 41, 102–106.
Palmer, R.E., 1979. A histological and histochemical study of digestion in the bivalve Arctica islandica.Biology Bulletin,156, 115–129.
Papadopoulou, K.; Ehaliotis, C.; Tourna, M.; Kastanis, P.; Karydis, I., and Zervakis, G., 2002. Genetic relatedness among dioeciousFicus caricaL. cultivars by random amplified polymorphic DNA analysis, and evaluation of agronomic and morphological characters.
Genetica, 114, 183–194.
Ropes, J.W. and Murawski, S.A., 1983. Maximum shell length and longevity in ocean quahogs,A. islandicaLinne’ ICES/CM, K: 32.
Shellfish Community,p. 8.
Rowell, T.W. and Chaisson, D.R., 1983. Distribution and abundance of the ocean quahog (Arctica islandica) and Stimpson’s surf clam (Spisula polynyma) resource on the Scotian shelf. Canadian Industry Report.Fisheries and Aquatic Sciences, 142, 75.
Sch¨one, B.R.; Kr¨oncke, I.; Houk, S.D.; Freyre Castro, A.D., and Oschmann, W., 2003a. The cornucopia of chilly winters: Ocean quahog (Arctica islandicaL., Mollusca) master chronology reveals bottom water nutrient enrichment during colder winters (North Sea).Senckenbergiana Maritima,32, 165–175.
Sch¨one, B.R.; Oschmann, W.; R¨ossler, J.; Freyre Castro, A.D.; Houk, S.D.; Kr¨oncke, I.; Dreyer, W.; Janssen, R.; Rumohr, H., and Dunca, E., 2003b. North Atlantic oscillation dynamics recorded in shells of a long-lived bivalve mollusk.Geology,31, 1237–1240.
region.Quaternary Science Reviews,19, 667–685.
Shumway, S.E., 1996. Natural environmental factors.In:Kennedy, V.S.; Newell, R.I.E.; Eble, A.F. (eds.), The Eastern Oyster Crassostrea virginica. College Park, Maryland: Sea Grant College, pp. 467–513.
Strahl, J.; Philipp, E.; Brey, T.; Broeg, K., and Abele, D., 2007.
Physiological ageing in the Icelandic population of the ocean quahogArctica islandica.Aquatic Biology, 1, 77–83.
Taylor, A.C., 1976. Burrowing behaviour and anaerobiosis in the bivalve Arctica islandica (L.). Journal of the Marine Biological Association of the UK, 56, 59–109.
Thompson, I.; Jones, D.S., and Dreibelbis, D., 1980. Annual internal growth banding and life history of the ocean quahog Arctica islandica(Mollusca: Bivalvia).Marine Biology, 57, 25–34.
Thompson, I.; Jones, D.S., and Ropes, J.W., 1980. Advanced age for sexual maturity in the ocean quahogArctica islandica(Mollusca:
Bivalvia).Marine Biology, 57, 35–39.
Tschischka, K.; Abele, D., and Portner, H.O., 2000. Mitochondrial oxy- conformity and cold adaptation in the polychaeteNereis pelagica and the bivalveArctica islandicafrom the Baltic and White Seas.
Journal of Experimental Biology, 203, 3355–3368.
Von Leesen, G.; Beierlein, L.; Scarponi, D.; Sch¨one, B.R., and Brey, T., 2017. A low seasonality scenario in the Mediterranean Sea during the Calabrian (Early Pleistocene) inferred from fossil Arctica islandicashells.Palaeogeography, Palaeoclimatology, Palaeoecol- ogy, 485, 706–714. doi: 10.1016/j.palaeo.2017.07.027.
Witbaard, R.; Duineveld, G.C.A., and de Wilde, P.A.W.J., 1999.
Geographical differences in the growth rates ofArctica islandica (Mollusca: Bivalvia) from the North Sea and adjacent waters.
Journal of the Marine Biological Association of the UK, 79, 907–
915.
Witbaard, R.; Jansma, E., and Sass Klaassen, U., 2003. Copepods link quahog growth to climate.Journal of Sea Research, 50, 77–83.
Zettler, M.L.; Bonsch, R., and Gosselck, F., 2001. Distribution, abundance and some population characteristics of the ocean quahog, Arctica islandica (Linnaeus 1767), in the Mecklenburg bight (Baltic Sea).Journal of Shellfish Research, 20, 161–169.