BioOne Complete (complete.BioOne.org) is a full-text database of 200 subscribed and open-access titles in the biological, ecological, and environmental sciences published by nonprofit societies, associations, museums, institutions, and presses.
Your use of this PDF, the BioOne Complete website, and all posted and associated content indicates your acceptance of BioOne’s Terms of Use, available at www.bioone.org/terms-of-use.
Usage of BioOne Complete content is strictly limited to personal, educational, and non-commercial use.
Commercial inquiries or rights and permissions requests should be directed to the individual publisher as copyright holder.
BioOne sees sustainable scholarly publishing as an inherently collaborative enterprise connecting authors, nonprofit
publishers, academic institutions, research libraries, and research funders in the common goal of maximizing access to critical research.
In situ Measurements of pH, CA2+, and Dic Dynamics within the Extrapallial Fluid of the Ocean Quahog Arctica islandica
Authors: Kristina Stemmer, Thomas Brey, Martin S. Gutbrod, Martin Beutler, Burgel Schalkhausser, et. al.
Source: Journal of Shellfish Research, 38(1) : 71-78
Published By: National Shellfisheries Association
URL: https://doi.org/10.2983/035.038.0107
IN SITU MEASUREMENTS OF pH, CA
2+, AND DIC DYNAMICS WITHIN THE EXTRAPALLIAL FLUID OF THE OCEAN QUAHOG ARCTICA ISLANDICA
KRISTINA STEMMER,1,2*†THOMAS BREY,1,3MARTIN S. GUTBROD,2 MARTIN BEUTLER,4BURGEL SCHALKHAUSSER1AND DIRK DE BEER2
1Alfred-Wegener-Institute Helmholtz Centre for Polar and Marine Research, Am Handelshafen 12, Bremerhaven D-27570, Germany;2Max-Planck-Institute for Marine Microbiology, Celsiusstraße 1, Bremen D-28359, Germany;3Helmholtz Institute for Functional Marine Biodiversity at the University Oldenburg, Ammerl ¨ander Heerstraße 231, Oldenburg D-26129, Germany;4bionsys GmbH,
Fahrenheitstraße 1, Bremen D-28359, Germany
ABSTRACT This study investigated to what extent the extrapallial fluid (EPF) of the marine bivalveArctica islandica (Linneaus, 1767) is involved in shell formation. Within situpH microscopy, pH gradients were identified between inner shell surface and outer mantle epithelium (OME). pH at the OME varied rapidly between neutral and values above 9, suggesting active H+pumping. Microsensor measurements showed also remarkable short-term dynamics in pH and Ca2+concentrations, again suggesting active ion pumping. Further focus was on pH, Ca2+, and dissolved inorganic carbon dynamics within the EPF to determine whether calcium carbonate precipitation is possible within the EPF. The data show that the bulk of the inner EPF rarely reaches calcium carbonate saturation and, thus, cannot be the site of shell formation. At the OME surface, however, pH levels of up to 9.5 were observed, corresponding to a 30-fold carbonate supersaturation. Thus, ion pumping by the OME can drive calcification when the OME is just a fewmm distant from the inner shell surface, as it is the case in the outer EPF.
KEY WORDS: Arctica islandica, calcification, bivalves, ion transportation, microsensors, calcium carbonate saturation
INTRODUCTION
Biomineralization is a regulated process within living or- ganisms where calcium carbonate precipitates on an organic matrix (Crenshaw 1972a, Lowenstam 1981, Falini et al. 1996, Nudelman et al. 2006). Shell formation in bivalves (referred to as calcification throughout the following text) happens extra- cellularly with a strong biological control (Crenshaw 1980, Weiner & Traub 1980, Weiner & Dove 2003). There are dif- ferent models on shell formation. (1) The shell is thought to form extracellularly from the extrapallial fluid (EPF) that is located between the inner shell surface and the outer mantle epithelium (OME) (Wada & Fujinuki 1976, Wilbur 1983, Addadi et al. 2003, Weiner & Dove 2003, Jacob et al. 2011). The OME is a thin barrier between the hemolymph and the EPF and is the secreting organ for the shell constituents. It is, hence, suggested to control the concentrations of inorganic ions (i.e., Ca2+, H+, and HCO3–) and organic components (i.e., proteins, glycoproteins, and polysaccharides) entering the EPF or the actual site of calcification (Crenshaw 1972a). (2) Within the mantle cells, vesicles with amorphous calcium carbonate (ACC) as a transient precursor of the crystalline aragonite or calcite form (Maria et al. 2002, Jacob et al. 2011). (3) Active cellular transport of CaCO3to the site of mineralization by hemocytes (Mount et al. 2004). Where the site of calcification is located and how CaCO3 is exactly precipitated is the matter of ongoing research (Nudelman et al. 2007, Weiss 2010, Zhang et al. 2012).
The EPF is in direct contact with the shell and mostly divided in an inner and outer section (Wilbur 1983). The two com- partments are divided by the pallial line where the OME is at- tached via numerous retractor muscles to the inner shell surface
(Wilbur 1983, Wheeler 1992). Sampling of the fluid is difficult because of the small volumes, and analyses are mostly restricted to the inner EPF (Crenshaw 1972a, Wada & Fujinuki 1976, Gillikin et al. 2006, Ip et al. 2006).
Previous investigations of the EPF form a controversial picture of its organic and inorganic composition and ion transportation mechanisms. Regarding Ca2+concentration that has to be necessarily increased for CaCO3precipitation, only a little fraction of Ca2+was found freely dissolved within the EPF of the blue musselMytilus edulis(Misogianes & Chasteen 1979).
Some organic molecules, such as an EPF glycoprotein, have been identified to reversely bind to Ca2+, probably presenting a building block of the soluble organic shell matrix (Hattan et al.
2001). Coimbra et al. (1988) reported Ca2+ concentrations within the EPF quite similar to seawater but with higher car- bonate ion concentrations. The OME is highly permeable to Ca2+, and different pathways for Ca2+transport through the mantle tissue have been discussed previously (Wheeler 1992, Klein et al. 1996, Gillikin et al. 2005, Carre et al. 2006).
The EPF is an enclosed compartment; thus, its chemistry can be well controlled, for example, by ion transport. It functions as a reservoir for all compounds necessary for calcification (Crenshaw 1972a, Misogianes & Chasteen 1979, Hattan et al.
2001). Several studies were dedicated to the EPF, but the con- cept of ion transportation mechanisms driving calcification is still controversial and the precise function of the EPF has yet stayed unresolved (Crenshaw 1972a, Carre et al. 2006, McConnaughey & Gillikin 2008, Thomsen et al. 2010).
Melzner et al. (2009) measured highpCO2values in extra- cellular fluids (in both hemolymph and EPF) that form a dif- fusion barrier for metabolic CO2excretion. Consequently, the pH values of the EPF are below that of ambient seawater for most of the time, and the fluid is undersaturated with respect to CaCO3 (Crenshaw 1972a, Thomsen et al. 2010, Heinemann et al. 2012). Some bivalves can even calcify at high rates under
†Present address: Kristina Stemmer, PhD, Zeughausstrasse 81, 3902 Glis, CH.
*Corresponding author. E-mail: kristina.stemmer@gmx.de DOI: 10.2983/035.038.0107
acidified conditions of the surrounding seawater with a satu- ration state of CaCO3 < 0.5 (Thomsen & Melzner 2010, Thomsen et al. 2010, Stemmer et al. 2013). The microenviron- ment in which calcification occurs has to be highly supersatu- rated with respect to shell minerals. Calcification is, thus, not likely to occur in the bulk of the EPF.
The speciesArctica islandica(Linneaus, 1767), also called ocean quahog, was chosen as the study species because of its ecological significance and its important role as environmental proxy archive (Brey et al. 1990). The clam is a key species in Western Baltic benthic communities and flourishes in areas exposed to fluctuating environmental parameters as salinity, oxygen, andpCO2(Hansen et al. 1999). Stemmer et al. (2013) showed that shell growth was unaffected under elevated CO2
levels. The present study helps to clarify the role of the EPF in the calcification process within young specimen of the ocean quahog by directly measuring ion dynamics with high temporal resolution. Optical pH measurements were performed within the inner EPF, and pH and Ca2+ microsensors were used to measure short- and long-term dynamics. Dissolved inorganic carbon (DIC) was also measured over time to evaluate the in- ternal carbonate system of the EPF. The data are used to discuss the function of the EPF as a shielded site for calcification.
MATERIALS AND METHODS
Clam Maintenance and Preparation
All measurements were conducted on the North Atlantic bivalveArctica islandica. Young bivalves were collected from Kiel Bight in the Western Baltic and maintained in aquaria at 14°C and a salinity of 25. Seawater was exchanged every 2 days.
As a food source, live marine plankton (SA/DTÕs Premium Blend; Sustainable Aquatics, Jefferson City, TN) was added every 2 days.
For microsensor measurements, holes were drilled in the bivalve shell of one specimen using a hand held drill (Dremel
‘‘MultiPro’’ 395; Germany). The first layers of the outer shell were removed carefully with a polishing tool in the area before or behind the pallial line and between the adductor muscles depending on the compartment of interest. Preventing heating of the shell and accumulation of CaCO3powder, the shell was flushed constantly with a water stream. When the shell at the
target area was thin enough, a small drilling head was used.
Carefully three holes of;2 mm in diameter were drilled into the bivalve shell: two entrances for the microsensors (Ca2+and pH) and one entrance for the reference electrode.
The holes were extended and sealed by gluing pipette tips of
;10 mm length onto the holes. To prevent gas exchange, par- afilm was applied to seal the pipette tips (further referred to as catheters, Fig. 1).
For microscopic pH measurements, a PVC measuring win- dow (with an area of;1 cm2) was attached onto a similarly drilled opening of the shell of two different specimens (Fig. 1A).
The pH indicator was injected into the EPF through a catheter in the window that was then sealed with parafilm.
Clams were positioned in the experimental chambers and holding tanks so that catheters were above the seawater level at all times (Fig. 1). After shell preparation, the clams were ac- climatized in the holding tanks for more than 12 h before measurements commenced. All bivalves were actively filtrating shortly after preparation. The bivalves were checked for tissue damages after measurement.
Microscopic pH Analysis
For microscopic analysis, a pH-sensitive nonmembrane- permeable dye BCECF-dextran (Invitrogen) was dissolved just before the measurement (2 g/L). Fifty microliters was in- jected in the inner EPF. The excitation intensity ratio (Invi- trogen Manual) of BCECF at 458 and 488 nm (emission:
505–550 nm) alters with changing pH, thus enabling measure- ments independent from the dye concentration. Fluorescence measurements were carried out with an upright confocal mi- croscope (LSM 510; Zeiss, Oberkochen, Germany) using an argon laser (458 and 488 nm, blue light) for excitation of the indicator dye. Fluorescence emission was measured between 505 and 550 nm.
By integrating the measured intensities of each image of a stack, a pH depth profile between the installed window (here- after referred to as ‘‘shell’’) and the OME of the animal was calculated. Calibrations were performed using BCECF in sea- water with pH 8.85 and pH 5.75 (Invitrogen Manual). Optical sections of extracellular pH of the clam were taken in 50-mm steps every 5.6 sec. Parameters of the measurement series are listed in Table 1.
Figure 1. Sketch of prepared clam. (A) For microscopic pH measurements, the installed window allows viewing into the inner EPF and onto the OME of the mantle tissue. The connection of the mantle tissue with the shell (on the pallial line) separates the inner and the outer EPF. The catheter enables application of dye. The animal was placed on a pedestal covered with a thin sand layer for stability. (B) For microsensor measurements, three catheters were installed. Arrows indicate the position range of sensor tips during short- and long-term measurements (out of scale).
STEMMER ET AL. 72
The window was clearly visible when in focus, because of its autofluorescence, and defined as the zero depth. The end point (meaning the OME was reached) was defined when fluorescence signals decreased down to the dimension of the signal offset, as the dye molecules cannot penetrate membranes and tissues.
During measurements, the bivalves were placed in a petri dish submerged in seawater. Only the installed window was positioned above the surface. By adding cooled water several times during the measurements, the seawater temperature was kept around 14°C with a salinity of 25. During all measure- ments, the bivalves were open and filtrating.
Microsensor Measurements
Liquid ion exchange membrane–type pH and Ca2+micro- electrodes were built and calibrated as described previously (de Beer et al. 1997, de Beer 2000). All pH measurements were performed on the NBS scale. Microsensors had a tip diameter of approximately 10mm and were installed on a micromanipulator (MD 4; Maerzhaeuser, Wetzlar, Germany) fixed on a heavy stand to enable careful positioning within the installed tubes on the clam to reach the EPF. The clam was submerged and the installed catheters were reaching out of the water covered by parafilm. A polycarbonate flow chamber ensured the circula- tion with aerated seawater at constant temperature of 14°C and a salinity of 25. The experimental setup is depicted in Figure 2.
Electrodes were guided carefully through the punctured parafilm of each catheter. The reference electrode was first fixed within one catheter with the tip of the reference reaching shortly behind the shell into the EPF. The fluid reached about 1–2 mm into the catheters so that contact of the sensors with the fluid was ensured. Positioning of the microsensors was performed manually with the help of a stereoscope. Mea- surement depth was determined by monitoring pH gradients while inserting sensors into the catheters. pH signals remained constant less than 300 mm depth within the bivalve shell (Fig. 1). This depth range was chosen for all long-term time series measurements.
Signals of pH and Ca2+were recorded simultaneously every 3–10 sec. pH and Ca2+values were taken before and after the measurements from the experimental seawater and used as baselines for calculations of theΔpH andΔCa2+in the EPF of Arctica islandica. All measurements were conducted under ambient light conditions.
Dissolved Inorganic Carbon Measurements
Extrapallial fluid samples were taken during microsensor measurements using gastight glass syringes (Hamilton). A vol- ume of at least 80mL of the EPF was carefully drawn from the installed catheters with a fine needle syringe and immediately transferred to a DIC analyzer. Levels of DIC were quantified by flow injection analysis (Hall & Aller 1992). This procedure was TABLE 1.
Parameters for microscopic pH.
Specimen Stack size No. of stacks Steps (mm) Total distance (mm) Time per measurement (s) Time between each stack (s) Total time (min)
#1 32 13 50 1,600 5.6 600 358.83
#2 24 28 50 1,200 5.6 300 197.72
Parameters used for microscopic pH measurements within the inner EPF of two specimens ofArctica islandica. The stack size comprises the amount of measurement points. Several stacks have been measured consecutively (No. of stacks).
Figure 2. Microsensor setup. The microsensors are attached to a micromanipulator to enable fine adjustments. A heavy stand provides stability. The microsensors are connected to a millivolt meter. The signal is getting transported from there to the DAQ-Pad (data acquisition devise) and thus visualized on the computer. The sample (here the bivalve) is located in a flow cell with circulating temperate water.
repeated over the course of one measurement as long as suffi- cient EPF was accessible.
Calcite Saturation Calculation
We used CO2SYS (Lewis & Wallace 1998) to calculate the saturation of calcite (W), from the DIC (assuming a seawater DIC of 2,300mmol/kg) and the measured pH.
RESULTS
The transparent (PVC) window in the shell enabled optical measurements of pH depth profiles between the OME and the shell. Insertion of Ca2+ and pH microsensors into the EPF through small operational holes was successful, and synchro- nous recordings of Ca2+and pH were possible with high tem- poral resolution.
Optical pH Measurements
Using BCECF-dextran as a pH indicator, it was possible to measure a pH gradient over depth within the inner EPF of Arctica islandicabetween the shell and the OME of the animal.
All pH depth profiles of specimen #1 and the first 17 depth profiles of specimen #2 show a decrease in pH toward the OME.
These measurements show that the pH at the OME surface is very low over a long period of time, probably because of res- piration. These profiles were averaged and are displayed in Figure 3.
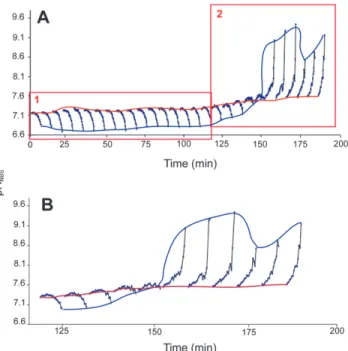
On several occasions, the pH at the OME increased strongly (Fig. 4). The last 11 pH depth profiles of specimen #2 show an
inversion of a decreasing to an increasing pH gradient toward the OME (Fig. 4). The pH at the shell did not follow the OME pH dynamics but was comparatively constant. At the observed pH of;9.5, the supersaturation of CaCO3was calculated with CO2SYS. Assuming a DIC of 2,300mmol/kg (seawater DIC), the oversaturation was 30-fold.
Simultaneous pH, Ca2+, and DIC Dynamics
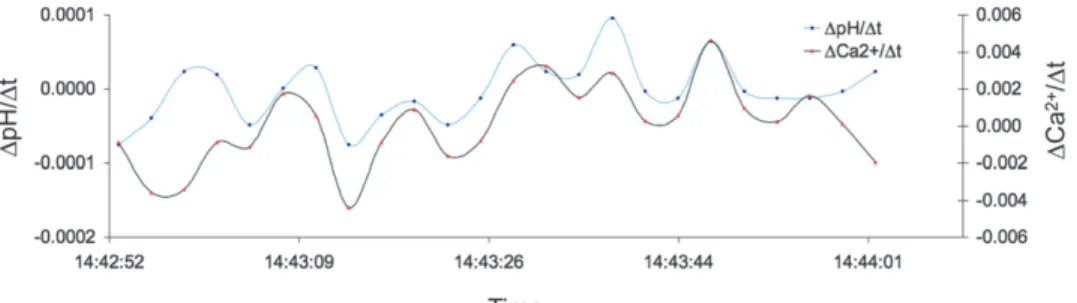
Using liquid ion exchange microsensors, pH and Ca2+con- centrations were measuredin situand simultaneously within the inner EPF ofArctica islandicawhile the valves of the calm were open. Both values change synchronously over time. Rising pH values are accompanied by increasing Ca2+levels andvice versa (Fig. 5). Occasionally, the synchronous dynamics change and move in opposite directions. Measurements were performed every 3 sec and demonstrate the fast change of the two parameters.
Simultaneous microsensor long-term measurements of pH and Ca2+within the inner EPF ofArctica islandicawere per- formed over 7 h. The valves of the clam were open over the whole period of time. pH of the EPF was between 0.2 and 0.6 units lower than that of the surrounding seawater. Calcium ion concentrations increased up to 2.5 mM over seawater Ca2+ concentrations (seeΔCa2+in Fig. 6A). During this microsensor measurement, EPF samples were analyzed for DIC. In- terestingly, DIC values also oscillate but are not synchronous to pH and Ca2+(Fig. 6B).
Dissolved inorganic carbon was measured six times during the microsensor measurements, and the difference to the sur- rounding experimental seawater was calculated. The dynamics ofΔDIC can be seen in Figure 6B. During the first 2 h of the
Figure 3. Averages of microscopically imaged pH profiles showing a decrease from the shell to the OME of the EPF in two individuals of Arctica islandica. (A)n$13. (B)n$17 profiles. The arrow indicates the measuring direction.
Figure 4. Time series of microscopic pH depth profiles through the EPF of Arctica islandicaspecimen #2. (A) 28 pH depth profiles over time. Box 1 shows the 17 profiles averaged in Figure 3C. Profiles within box 2 are magnified in (B). (B) Inversion of decreasing to increasing pH gradient.
The red line follows the pH close to the shell; the blue line shows the pH increase around the OME of up to 9.5.
STEMMER ET AL. 74
measurements (with increasing pH and Ca2+level), the DIC concentration is similar to that in seawater with a slightly lower DIC concentration of ;174 mmol/kg. The following three measurements show a steep increase in DIC of up to 3,191mmol/kg, which exceeds the seawater DIC level by more than 50%. During elevated DIC levels, the two other parame- ters, pH and Ca2+, show a simultaneous oscillation. The last measured DIC value had reversed to almost seawater values.
DISCUSSION
For the detailed understanding of the shell-formation pro- cess, mechanisms of ion transportation to the site of calcifica- tion need to be identified (Carre et al. 2006, McConnaughey &
Gillikin 2008). In bivalve shell formation, the two major com- partments filled with the inner and the outer EPF are closest to the site of biomineralization (Wheeler 1992). The outer EPF, however, is not suitable for analysis because of the small area and volume. Therefore, this study focused on the inner EPF.
The number of observations was limited to one set of ex- tensive microsensor measurements (pH and calcium) and two series of optical pH measurements as the procedures to get
access to the EPF were difficult and appeared often stressful for the animal.
The exact series of the calcification mechanisms are still debated. One increasingly accepted scenario is that ACC is transported in vesicles to the site of calcification, where the unstable ACC is converted into calcite (Addadi et al. 2003). The ACC could be stabilized before reaching the site of calcification by Mg2+, phosphate, or organics (Weiner et al. 2005). Alter- natively, metabolically driven membrane transporters pump Ca2+to the site of calcification, or exchangers transport H+ from, and Ca2+into the calcifying site, leading to an increase in Ca2+and pH, thus stimulating calcite formation (Al-Horani et al. 2003a, 2003b). The latter exchange process is possibly controlled by a Ca–H-ATPase. Several mechanisms in parallel or in combination are possible. For example, ACC may be transported in vesicles and, during its release on the calcifying site, the pH is elevated by active H+pumps. This study shows the occurrence of pumping and does not exclude the ACC vesicle mechanism.
The low pH recorded at the tissue surface may be well driven by respiratory CO2 production. The two clams had slightly different pH values at the epithelium surface, but the profiles Figure 5. Short-term dynamics of pH and Ca2+within the inner EPF ofArctica islandica. The change in pH and Ca2+are plotted against the change over time. Concentrations were measured every 3 sec.
Figure 6. Long-term dynamics of pH, Ca2+, and DIC within the inner EPF ofArctica islandica. (A)ΔpH andΔCa2+relative to seawater pH and Ca2+
concentrations, respectively (see legend). The box indicates the short-term dynamics shown in Figure 5. (B) Dissolved inorganic carbon concentrations simultaneously measured during microsensor measurements shown in (A). Displayed asΔDIC relative to seawater.
were similar in shape. The pH decrease in the EPF through activity by the tissue will decrease the calcite oversaturation and hence reduce calcification. The sudden elevation of the pH from 7.3 to levels of above 9.5 in less than 20 min were most likely caused by active H+ uptake by the epithelium, which costs metabolic energy. Calcification will be accelerated during such an alkalinization event. This observation suggests that calcifi- cation is not a continuous process but occurs in bursts. Possibly, this explains the pattern of bands in the shells.
The simultaneously recorded pH and Ca2+concentration showed a parallel dynamic (Fig. 5), which can be explained by a Ca2+/H+ exchanger (Ca2+-ATPase). Such a counterporter is thought to drive calcium carbonate precipitation (Al-Horani et al. 2003, McConnaughey & Gillikin 2008).
Indeed, Ca–H-ATPase can transport Ca2+across the mantle epithelia to the EPF in exchange for 2H+(Schwiening et al. 1993).
Their activity was shown to induce synchronous Ca2+and pH dynamics at the surface of macroalgae (McConnaughey & Falk 1991). These transporters have been described in detail and are suggested to play a role in the calcification process (Kingsley &
Watabe 1985, Ip & Lim 1991). Moreover, Fan et al. (2007) found evidence for Ca2+-ATPase on the OME of pearl oysters. In- terestingly, similar pH and Ca2+dynamics were measured in the calcification site of coral polyps, the calicoblastic fluid (Al- Horani et al. 2003a, 2003b). The authors validated the activity of Ca2+-ATPase enzyme via Ca2+-ATPase inhibitors.
The sudden increase in DIC of 1 mM within 10 min, followed by an equally large decrease 2.5 h later cannot be explained by respiratory activity. As the oxygen level will not exceed 0.3 mM, the DIC production in the EPF cannot exceed 0.3 mM, in the unlikely case that complete oxygen depletion could occur.
Rather, an active pumping of DIC toward the calcifying site can explain this increase. Possibly, a sudden release of ACC vesicles occurred. Like the sudden alkalinization of the EPF, the DIC dynamics hint to bursts of calcification. The pH dynamics, measured at the same time with a pH microsensor, show a sudden decrease of 0.3 units. Taking the two observations together, a pH increase is coupled to a DIC decrease andvice versa. Despite the increase in DIC, during the acidification pe- riod, theW(CaCO3) decreases from 3.6 to 2.7. It can only be speculated on the processes that control the DIC dynamics, but these data suggest a correlation between DIC and H+/Ca2+ pumping.
This study proposes that these pumps are involved in shell formation, possibly together with ACC vesicles. The H+pumps can induce a pH at the tissue surface that is high enough to induce calcification, but the pH close to the shell surface of the inner EPF stays too low (Fig. 3). The oversaturation of 30-fold is certainly enough to drive calcite formation. It is documented that CaCO3 precipitation only occurs under strong local su- persaturation. For example, in calcifying algae, supersaturation
was recorded greater than 30-fold (McConnaughey & Falk 1991), in freshwater stromatolites, it was greater than 20-fold (Bissett et al. 2008), and in corals and hypersaline microbial mats;25-fold (Al-Horani et al. 2003b, Ludwig et al. 2005). The authors of this study propose that calcification happens when the tissue is in close contact with the shell, as, for example, in the outer EPF. Here, the distance is in the order of microns, and in this enclosed volume, the water chemistry can even be better controlled to induce calcification. The pumping may offer the organism several options to control the shell building. First, the pumps may be actively regulated, like in other complex or- ganisms. Second, the animal may control the distance between shell and tissue in which the active pumps are located (OME).
Probably, the mechanisms regulate H+, Ca2+, and DIC by membrane transporters and possibly ACC vesicles that are concentrated in the area where the shell grows. The calcification will be most important at the shell margin where shell expansion occurs; however, according to the data, these pumps are also present in the OME adjacent to the inner EPF where calcifica- tion leads to increased shell thickness.
CONCLUSION
In the present study, the inner EPF ofArctica islandicawas investigated as a highly dynamic compartment with regard to pH, Ca2+, and DIC. A sudden increase in pH from below 7 up to 9.5 at the OME shows active H+pumping and is consistent with the hypothesis of H+pumps being integrated in the OME. Si- multaneous pH and Ca2+microsensor measurements revealed remarkable short-term dynamics and demonstrate the power of this method for in situmeasurements of ion dynamics. The function of this active pumping process likely plays a role in the calcification process. Calculations of the saturation state within the inner EPF indicate an environment that can reach very strong CaCO3oversaturation within limited portions near the OME. The animal might temporally shift the OME toward the growing shell surface to permit calcification.
Futurein situinvestigations of the OME in the inner and in the outer EPF using Ca2+markers will help to uncover possible Ca2+pumps or channels and get us closer to resolve the enigma of the biomineralization process withinArctica islandica.
ACKNOWLEDGMENTS
Many thanks to the technicians of the microsensor group for technical support. We also would like to thank Duygu Sevilgen, Gisela Lannig, and Christian Bock for fruitful discussions.
Thanks to Eva Philipp for organizing the cruise where the animals were collected. This research was funded by the Alfred Wegener Institute in the framework of the BIOACID project and the Max Planck Institute for Marine Microbiology.
LITERATURE CITED Addadi, L., S. Raz & S. Weiner. 2003. Taking advantage of disorder:
amorphous calcium carbonate and its roles in biomineralization.
Adv. Mater.15:959–970.
Al-Horani, F. A., S. M. Al-Mograbi & D. de Beer. 2003a. The mech- anism of calcification and its relation to photosynthesis and respi- ration in the scleractinian coral Galaxea fascicularis. Mar. Biol.
142:419–426.
Al-Horani, F. A., S. M. Al-Mograbi & D. de Beer. 2003b. Microsensor study of photosynthesis and calcification in the scleractinian coral Galaxea fascicularis: active internal carbon cycling.J. Exp. Mar.
Biol. Ecol.288:1–15.
Bissett, A., D. de Beer, R. Schoon, A. Reimer & G. Arp. 2008. Microbial mediation of stromatolite formation in karst-water creeks.Limnol.
Oceanogr.53:1159–1168.
STEMMER ET AL. 76
Brey, T., W. E. Arntz, D. Pauly & H. Rumohr. 1990.Arctica (Cyprina) islandica in Kiel Bay (Western Baltic)—growth, production and ecological significance.J. Exp. Mar. Biol. Ecol.136:217–235.
Carre, M., I. Bentaleb, O. Bruguier, E. Ordinola, N. T. Barrett & M.
Fontugne. 2006. Calcification rate influence on trace element con- centrations in aragonitic bivalve shells: evidences and mechanisms.
Geochim. Cosmochim. Acta70:4906–4920.
Coimbra, J., J. Machado, P. L. Fernandes, H. G. Ferreira & K. G.
Ferreira. 1988. Electrophysiology of the mantle ofAnodonta cygnea.
J. Exp. Biol.140:65–88.
Crenshaw, M. A. 1972a. The inorganic composition of molluscan extrapallial fluid.Biol. Bull.143:506–512.
Crenshaw, M. A. 1972b. The soluble matrix fromMercenaria merce- nariashell.Biomineral. Res. Rep.6:6–11.
Crenshaw, M. A. 1980. Mechanisms of shell formation and dissolution.
Top. Geobiol.1:115–132.
de Beer, D. 2000. Potentiometric microsensors forin situmeasurements in aquatic environments. In: Buffle, J. & G. Horvai, editors.In situ monitoring of aquatic systems: chemical analysis and speciation.
London, United Kingdom: Wiley & Sons. pp. 161–194.
de Beer, D., A. Schramm, C. M. Santegoeds & M. K ¨uhl. 1997. A nitrite microsensor for profiling environmental biofilms. Appl. Environ.
Microbiol.63:973–977.
Falini, G., S. Albeck, S. Weiner & L. Addadi. 1996. Control of aragonite or calcite polymorphism by mollusc shell macromolecules.Science 271:67–69.
Fan, W., C. Li, S. Li, Q. Feng, L. Xie & R. Zhang. 2007. Cloning, characterization, and expression patterns of three sarco/endoplasmic reticulum Ca2+-ATPase isoforms from pearl oyster (Pinctada fucata).
Acta Biochim. Biophys. Sin. (Shanghai)39:722–730.
Gillikin, D. P., F. Dehairs, A. Lorrain, D. Steenmans, W. Baeyens & L.
Andre. 2006. Barium uptake into the shells of the common mussel (Mytilus edulis) and the potential for estuarine paleo-chemistry re- construction.Geochim. Cosmochim. Acta70:395–407.
Gillikin, D. P., A. Lorrain, J. Navez, J. W. Taylor, E. Keppens, W.
Baeyens & F. Dehairs. 2005. Strong biological controls on Sr/Ca ratios in aragonitic marine bivalve shells.Geochem. Geophys. Geo- syst.6:Q05009.
Hall, O. J. & R. C. Aller. 1992. Rapid, small-volume, flow injection analysis for SCO2and NH4+in marine and freshwaters. Limnol.
Oceanogr.37:1113–1119.
Hansen, H. P., H. C. Giesenhagen & G. Behrends. 1999. Seasonal and long-term control of bottom-water oxygen deficiency in a stratified shallow-water coastal system.ICES J. Mar. Sci.56:65–71.
Hattan, S. J., T. M. Laue & N. D. Chasteen. 2001. Purification and characterization of a novel calcium-binding protein from the extrapallial fluid of the mollusc, Mytilus edulis. J. Biol. Chem.
276:4461–4468.
Heinemann, A., J. Fietzke, F. Melzner, F. Boehm, J. Thomsen, D.
Garbe-Schoenberg & A. Eisenhauer. 2012. Conditions ofMytilus edulis extracellular body fluids and shell composition in a pH- treatment experiment: acid-base status, trace elements andd11B.
Geochem. Geophys. Geosyst.13:1–17.
Ip, Y. K. & A. L. L. Lim. 1991. Are calcium and strontium transported by the same mechanism in the hermatypic coralGalaxea fascicularis.
J. Exp. Biol.159:507–513.
Ip, Y. K., A. M. Loong, K. C. Hiong, W. P. Wong, S. F. Chew, K.
Reddy, B. Sivaloganathan & J. S. Ballantyne. 2006. Light induces an increase in the pH of and a decrease in the ammonia concentration in the extrapallial fluid of the giant clamTridacna squamosa.Physiol.
Biochem. Zool.79:656–664.
Jacob, D. E., R. Wirth, A. L. Soldati, U. Wehrmeister & A. Schreiber.
2011. Amorphous calcium carbonate in the shells of adult Union- oida.J. Struct. Biol.173:241–249.
Kingsley, R. J. & N. Watabe. 1985. Ca-ATPase localization and in- hibition in the gorgonianLeptogorgia virgulata(Lamarck) (Coe- lenterata: Gorgonacea).J. Exp. Mar. Biol. Ecol.93:157–167.
Klein, R. T., K. C. Lohmann & C. W. Thayer. 1996. Sr/Ca and C-13/C- 12 ratios in skeletal calcite ofMytilus trossulus: covariation with metabolic rate, salinity, and carbon isotopic composition of sea- water.Geochim. Cosmochim. Acta60:4207–4221.
Lewis, E. & D. W. R. Wallace. 1998. Program developed for CO2system calculations. ORNL/CDIAC-105. Oak Ridge, TN: Oak Ridge Na- tional Laboratory.
Lowenstam, H. A. 1981. Minerals formed by organisms. Science 211:1126–1131.
Ludwig, R., F. A. Al-Horani, D. de Beer & H. M. Jonkers. 2005.
Photosynthesis controlled calcification in a hypersaline microbial mat.Limnol. Oceanogr.50:1836–1843.
Maria, W. I., T. Noreen, A. Lia & W. Steve. 2002. Mollusc larval shell formation: amorphous calcium carbonate is a precursor phase for aragonite.J. Exp. Zool.293:478–491.
McConnaughey, T. A. & R. H. Falk. 1991. Calcium-proton exchange during algal calcification.Biol. Bull.180:185–195.
McConnaughey, T. A. & D. P. Gillikin. 2008. Carbon isotopes in mollusk shell carbonates.Geo-Mar. Lett.28:287–299.
Melzner, F., M. A. Gutowska, M. Hu & M. Stumpp. 2009. Acid-base regulatory capacity and associated proton extrusion mechanisms in marine invertebrates: an overview.Comp. Biochem. Physiol.153A:S80.
Misogianes, M. J. & N. D. Chasteen. 1979. Chemical and spectral characterization of the extrapallial fluid of Mytilus edulis. Anal.
Biochem.100:324–334.
Mount, A. S., A. P. Wheeler, R. P. Paradkar & D. Snider. 2004.
Hemocyte-mediated shell mineralization in the eastern oyster.Sci- ence304:297–300.
Nudelman, F., H. H. Chen, H. A. Goldberg, S. Weiner & L. Addadi.
2007. Spiers memorial lecture: lessons from biomineralization:
comparing the growth strategies of mollusc shell prismatic and na- creous layers inAtrina rigida.Faraday Discuss.136:9–25.
Nudelman, F., B. A. Gotliv, L. Addadi & S. Weiner. 2006. Mollusk shell formation: mapping the distribution of organic matrix components underlying a single aragonitic tablet in nacre. J. Struct. Biol.
153:176–187.
Schwiening, C. J., H. J. Kennedy & R. C. Thomas. 1993. Calcium hydrogen-exchange by the plasma-membrane Ca-ATPase of voltage-clamped snail neurons.Proc. Biol. Sci.253:285–289.
Stemmer, K., G. Nehrke & T. Brey. 2013. Elevated CO2levels do not affect the shell structure of the bivalveArctica islandicafrom the Western Baltic.PLoS One8:e70106.
Thomsen, J., M. A. Gutowska, J. Saphoerster, A. Heinemann, K.
Truebenbach, J. Fietzke, C. Hiebenthal, A. Eisenhauer, A. Koert- zinger, M. Wahl & F. Melzner. 2010. Calcifying invertebrates suc- ceed in a naturally CO2-rich coastal habitat but are threatened by high levels of future acidification.Biogeosciences7:3879–3891.
Thomsen, J. & F. Melzner. 2010. Moderate seawater acidification does not elicit long-term metabolic depression in the blue musselMytilus edulis.Mar. Biol.157:2667–2676.
Wada, K. & T. Fujinuki. 1976. Biomineralization in bivalve molluscs with emphasis on the chemical composition of the extrapallial fluid.
In: Watabe, N. & K. M. Wilbur, editors. The mechanism of min- eralization in the invertebrates and plants. Univ. South Carolina Press. pp. 175–190.
Weiner, S. & P. Dove. 2003. An overview on biomineralization pro- cesses and the problem of the vital effect, vol. 54. In: Dove, P. M., S.
Weiner & J. J. De Yoreo, editors. Biomineralization. Washington, DC: Mineralogical Society of America. pp. 1–31.
Weiner, S., I. Sagi & L. Addadi. 2005. Choosing the crystallization path less traveled.Science309:1027–1028.
Weiner, S. & W. Traub. 1980. X-ray-diffraction study of the insoluble organic matrix of mollusk shells.FEBS Lett.111:311–316.
Weiss, I. M. 2010. Jewels in the pearl.Chembiochem11:297–300.
Wheeler, A. P. 1992. Mechanisms of molluscan shell formation. In:
Bonucci, E., editor. Calcification in biological systems. Boca Raton, FL: CRC Press. pp. 179–215.
Wilbur, K. M. & A. S. M. Saleuddin. 1983. Shell formation. In: The mollusca, vol. 4. Physiology. Wilbur, K. M. & A. S. M. Saleuddin, editors. New York, NY: Academic Press. pp. 235–287.
Zhang, G., X. Fang, X. Guo, L. Li, R. Luo, F. Xu, P. Yang, L.
Zhang, X. Wang, H. Qi, Z. Xiong, H. Que, Y. Xie, P. W. H.
Holland, J. Paps, Y. Zhu, F. Wu, Y. Chen, J. Wang, C. Peng, J. Meng, L. Yang, J. Liu, B. Wen, N. Zhang, Z. Huang, Q. Zhu, Y.
Feng, A. Mount, D. Hedgecock, Z. Xu, Y. Liu, T. Domazet-Lo ˇso, Y. Du, X. Sun, S. Zhang, B. Liu, P. Cheng, X. Jiang, J. Li, D. Fan,
W. Wang, W. Fu, T. Wang, B. Wang, J. Zhang, Z. Peng, Y. Li, N.
Li, J. Wang, M. Chen, Y. He, F. Tan, X. Song, Q. Zheng, R.
Huang, H. Yang, X. Du, L. Chen, M. Yang, P. M. Gaffney, S.
Wang, L. Luo, Z. She, Y. Ming, W. Huang, S. Zhang, B. Huang, Y. Zhang, T. Qu, P. Ni, G. Miao, J. Wang, Q. Wang, C. E. W.
Steinberg, H. Wang, N. Li, L. Qian, G. Zhang, Y. Li, H. Yang, X.
Liu, J. Wang, Y. Yin & J. Wang. 2012. The oyster genome reveals stress adaptation and complexity of shell formation. Nature 490:49–54.
STEMMER ET AL. 78