source: https://doi.org/10.7892/boris.142475 | downloaded: 10.5.2021
1 Disproportionately strong climate forcing from explosive extratropical volcanic 1 eruptions
2 3
Matthew Toohey*,1, Kirstin Krüger2, Hauke Schmidt3, Claudia Timmreck3, Michael Sigl2,4,5, 4
Markus Stoffel6,7,8, Rob Wilson9,10 5
1GEOMAR Helmholtz Centre for Ocean Research Kiel, Germany 6
2University of Oslo, Department of Geosciences, Oslo, Norway 7
3Max Planck Institute for Meteorology, Hamburg, Germany 8
4Laboratory of Environmental Chemistry, Paul Scherrer Institute, 5232 Villigen, Switzerland 9
5Oeschger Centre for Climate Change Research, 3012 Bern, Switzerland 10
6Climate Change Impacts and Risks in the Anthropocene (C-CIA), Institute for Environmental 11
Sciences, University of Geneva, Boulevard Carl-Vogt 66, CH-1205 Geneva, Switzerland 12
7dendrolab.ch, Department of Earth Sciences, University of Geneva, Rue des Maraîchers 13, CH- 13
1205 Geneva, Switzerland 14
8Department F.-A. Forel for Aquatic and Environmental Sciences, University of Geneva, 15
Boulevard Carl-Vogt 66, CH-1205 Geneva, Switzerland 16
9School of Earth and Environmental Sciences, University of St Andrews, Fife KY16 9AL, UK 17
10Lamont-Doherty Earth Observatory, Columbia University, Palisades NY 10964, USA 18
*Corresponding author 19
20
2
Abstract
21
Extratropical volcanic eruptions are commonly thought to be less effective at driving large-scale 22
surface cooling than tropical eruptions. However, recent minor extratropical eruptions have 23
produced a measurable climate impact, and proxy records suggest that the most extreme 24
Northern Hemisphere cold period of the Common Era was initiated by an extratropical eruption 25
in 536 CE. Using ice core-derived volcanic stratospheric sulfur injections and Northern 26
Hemisphere summer temperature reconstructions from tree rings, we show here that in 27
proportion to their estimated stratospheric sulfur injection, explosive extratropical eruptions 28
since 750 CE have produced stronger hemispheric cooling than tropical eruptions. Stratospheric 29
aerosol simulations demonstrate that for eruptions with sulfur injection magnitude and height 30
equal to that of the 1991 Mt. Pinatubo eruption, extratropical eruptions produce time- 31
integrated radiative forcing anomalies over the Northern Hemisphere extratropics up to 80%
32
greater than tropical eruptions, as decreases in aerosol lifetime are overwhelmed by the 33
enhanced radiative impact associated with the relative confinement of aerosol to a single 34
hemisphere. The model results are consistent with the temperature reconstructions, and 35
elucidate how the radiative forcing produced by extratropical eruptions is strongly dependent 36
on eruption season and sulfur injection height within the stratosphere.
37
3
Main
38
Major volcanic eruptions impact climate through the injection of sulfur into the stratosphere, 39
leading to the production of stratospheric sulfate aerosol, which scatters incoming solar 40
radiation and cools the Earth’s surface1. The climatic impact of any eruption depends on the 41
properties of the stratospheric aerosol enhancement, and is tied principally to the amount of 42
sulfur injected, but also to the aerosol’s atmospheric lifetime, spatial spread, and size 43
distribution.
44
It is commonly thought that extratropical eruptions have a weaker climatic impact than tropical 45
eruptions2,3. This hypothesis rests on the idea that aerosol resulting from tropical eruptions 46
spreads globally, and has a longer stratospheric lifetime due to a longer transport path from the 47
tropics to removal across the mid- or high-latitude tropopause4. Shorter lifetimes for 48
stratospheric aerosol from extratropical eruptions have been assumed in prior volcanic forcing 49
reconstructions5,6 and are thus implicit in model studies which support the idea of weaker 50
climate forcing from extratropical eruptions4. 51
Comparing the aerosol clouds and climate impacts resulting from tropical vs. extratropical 52
eruptions based on observations and proxy records is complicated by a number of confounding 53
factors. During the satellite era, stratospheric sulfur injections from the strongest extratropical 54
eruptions have been an order of magnitude weaker than the largest tropical eruptions7. On 55
longer timescales, ice cores record sulfate from major eruptions from both the tropics and 56
extratropics8, however, limited knowledge of the height of the volcanic sulfur injection from 57
those eruptions adds uncertainty to estimates of radiative forcing from ice cores9. 58
4 Interest in extratropical eruptions has recently increased, due in part to a series of minor
59
extratropical volcanic eruptions which produced significant radiative forcing on climate, 60
counteracting a portion of greenhouse gas warming10,11. Furthermore, model results suggest 61
the hemispherically asymmetric radiative forcing from extratropical eruptions has distinct 62
impacts on tropical precipitation12,13, and atmospheric and ocean circulation14,15. 63
Reconstructions of volcanic activity spanning the past 2500 years from ice cores have identified 64
large extratropical volcanic events with associated large-scale cooling8, including extreme NH 65
cold conditions initiated by an extratropical eruption around the year 536 CE8,16,17. These 66
findings motivate a re-examination of the radiative forcing and climate impacts of extratropical 67
eruptions.
68
Hemispheric cooling by tropical and extratropical eruptionsReconstructions of Northern 69
Hemisphere (NH) extratropical summer temperatures over land from tree rings show a clear 70
cooling response to volcanic eruptions18. Here, we examine the magnitude of the cooling 71
recorded in three tree ring NH temperature reconstructions19–21 over the 750-2000 CE period, 72
supplemented with estimates of eruption region and volcanic stratospheric sulfate injection 73
(VSSI) deduced from ice core sulfate records22. We select eruptions with VSSI> 2 Tg S, excluding 74
cases potentially affected by prior eruptions (see Methods, Supplementary Table 2) and five 75
events linked to Iceland (Supplementary Table 3).
76
Post-volcanic 3-year mean NH temperature anomalies, averaged over the three reconstructions 77
(∆𝑇3yrALL, see Methods) show a clear relationship with VSSI (Fig. 1). Tropical eruptions show a 78
particularly coherent correlation (r=-0.68) between temperature and VSSI. There is also clearly 79
5 scatter in the relationship between ∆𝑇3yr and VSSI, which can be due to uncertainties in both 80
quantities, but also the influences of internal climate variability on ∆𝑇3yr and the impact of 81
secondary eruption characteristics such as eruption season and plume heights. Ratios of 82
temperature response to VSSI (Supplementary Tables 4 and 5, Fig. 1 inset) show a broad range 83
of values, with outliers including events with apparent post-eruption warming to very strong 84
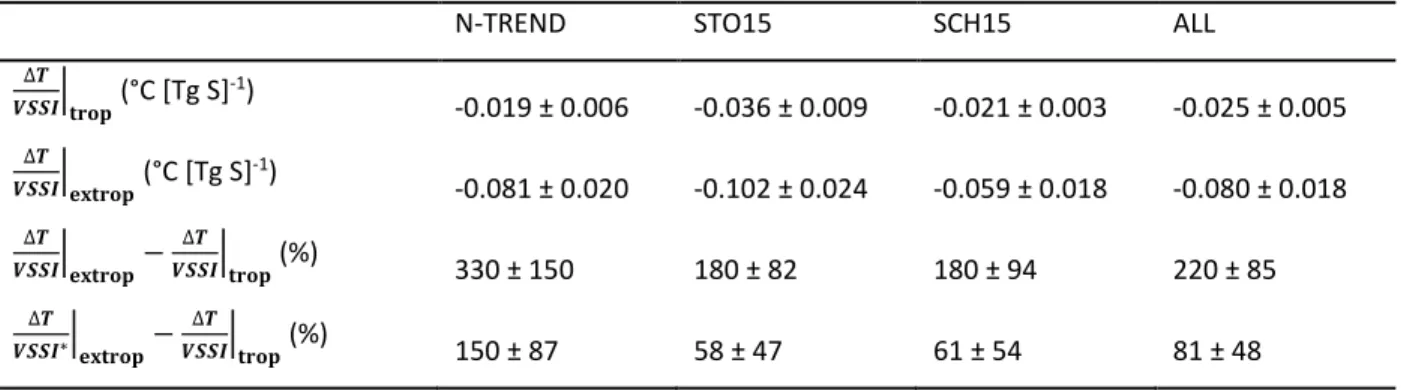
apparent cooling. On average, tropical and extratropical eruptions lead to ∆𝑇-to-VSSI ratios of - 85
0.025 ± 0.005 °C (Tg S)-1 and -0.080 ± 0.018 °C (Tg S)-1 respectively (Table 1). The difference 86
between the ∆𝑇-to-VSSI ratios for extratropical and tropical eruptions is significant at the 99%
87
level (p=0.006): a factor of roughly 2-4 difference is consistent across the three NH temperature 88
reconstructions (Table 1, Supplementary Fig. 1).
89
The stronger temperature response per unit VSSI to extratropical eruptions is based on a 90
sample of extratropical eruptions with VSSI mostly limited to values less than 7 Tg S 91
(Supplementary Table 5). While this limits the comparability of the temperature responses to 92
extratropical and tropical eruptions, we note that the mean ∆𝑇-to-VSSI ratios for tropical 93
eruptions are consistent between eruptions less than and greater than 7 Tg S (Fig. 1 inset), 94
suggesting that the stronger ∆𝑇-to-VSSI ratios seen for extratropical eruptions are likely 95
representative. The ∆𝑇-to-VSSI ratio for extratropical eruptions after 750 CE is consistent with 96
the strong cooling estimated for the 536 CE eruption, albeit from a single reconstruction (Fig. 1, 97
Supplementary Table 6). On the other hand, the extratropical eruptions of 626 and 1180 CE 98
produce ∆𝑇-to-VSSI ratios on par with tropical eruptions.
99
6 One pertinent issue in the calculation of ∆𝑇-to-VSSI ratios is uncertainty in the methods used to 100
calculate VSSI, which apply a smaller transfer function for extratropical eruptions than tropical 101
eruptions in the estimation of volcanic aerosol from ice core sulfate22,23. Nonetheless, if VSSI 102
values for extratropical eruptions were calculated as for tropical eruptions, extratropical 103
eruptions would still produce an 81% stronger average ∆𝑇-to-VSSI ratio than tropical eruptions 104
(Table 1).
105
Since aerosol from extratropical eruptions is largely contained within the hemisphere of the 106
eruption24, while that from tropical eruptions spreads globally, a factor of two difference 107
between ∆𝑇-to-VSSI ratios for extratropical and tropical eruptions could be explained by a 108
relatively equal temperature response to hemispheric aerosol loading, irrespective of latitude 109
of injection. This explanation however seemingly contradicts the expectation of a significantly 110
reduced stratospheric aerosol lifetime for extratropical eruptions.
111
The lifetime of volcanic stratospheric sulfur 112
To investigate the impact of eruption latitude on the volcanic stratospheric sulfate aerosol 113
evolution we performed ensemble simulations with the coupled aerosol-atmospheric general 114
circulation model MAECHAM5-HAM (see Methods). All simulations include a stratospheric 115
injection of 8.5 Tg S, consistent with satellite-based estimates of the 1991 Pinatubo eruption25, 116
with eruptions in both January and July to include the effect of season20,26,27. A set of four 117
eruption latitudes were chosen based on maxima in the latitudinal distribution of identified 118
eruptions within the Volcanoes of the World database28 (Supplementary Fig. 2), and simulations 119
(Supplementary Table 1) were performed with SO2 injected at each latitude and 30 hPa (~24 120
km), consistent with the 1991 Pinatubo eruption. Eruptions at 56°N were also performed with 121
7 injections into the lower stratosphere at 100 hPa (~16 km) and 150 hPa (~13 km), roughly 122
consistent with the range of estimates7 of the injection heights of recent minor (VSSI < 1 Tg S) 123
extratropical eruptions including Kasatochi (2008, 52°N) and Sarychev (2009, 48°N).
124
The simulated spatiotemporal evolution of volcanic aerosol burden (Fig. 2a-d, Supplementary 125
Fig. 3) shows global spread of aerosol following tropical eruptions and hemispheric 126
containment of aerosol for extratropical eruptions. These patterns of aerosol spread are 127
consistent with prior simulations24, comparisons of tropical vs. extratropical temperature 128
reconstructions29 and understanding of the general features of large-scale circulation within the 129
stratosphere30. 130
For sulfur injections at a fixed height of 30 hPa, global mean sulfate mass burdens show 131
sensitivity to both the injection latitude and season (Fig. 2e, f). For January (i.e., NH winter) 132
eruptions, extratropical eruptions produce sulfate burdens which are similar to tropical 133
eruptions, with stratospheric e-folding lifetimes only ~10% smaller (Fig. 2g). For July (i.e., NH 134
summer) eruptions, global sulfate burdens from extratropical eruptions reach maxima similar 135
to those from tropical eruptions, but decay faster, with lifetimes 24-44% shorter.
136
Simulations of sulfur injections at 56°N with varying injection heights show that injection height 137
within the stratosphere plays an important role in controlling the lifetime of stratospheric 138
sulfate. The lifetimes of stratospheric sulfur for extratropical injections at 100 hPa and 150 hPa 139
are 63-88% shorter than tropical, 30 hPa injections (Fig. 2g). These results can be understood as 140
arising from differences in transport processes between the lowermost stratosphere (LMS) and 141
“overworld”31. In the LMS, defined as the region between the tropopause and the 380 K 142
8 potential temperature surface, large-scale two-way transport along potential temperature 143
isentropes exchanges air between the tropopause and stratosphere, while in the overworld, 144
isentropes do not cross the tropopause and therefore transport simply redistributes mass 145
within the stratosphere. Sulfate aerosol resulting from simulated sulfur injection into the LMS 146
are transported into the troposphere and deposited to the surface rapidly after the injection 147
(Supplementary Fig. 4), whereas cross-tropopause transport of sulfur injected into the 148
extratropical stratospheric overworld only proceeds after aerosol has descended into the LMS, 149
which prolongs the aerosol lifetime.
150
Global mean aerosol properties and radiative forcing 151
The radiative impact of stratospheric aerosol depends not only on its mass, but also on its size 152
distribution32, since stratospheric sulfate aerosol has maximum scattering efficiency at effective 153
radius of ~0.2 μm, with decreasing efficiency for the larger effective radii observed after major 154
eruptions33,34. Sulfate-mass-weighted mean effective radius (〈𝑟eff〉, see Methods) and global 155
mean stratospheric aerosol optical depth (SAOD) are shown in Fig. 3 as a function of injection 156
location. Simulated effective radius shows sensitivity to eruption latitude, season and injection 157
height (Fig. 3a, b). For January 30 hPa injections, the evolution of 〈𝑟eff〉 is similar for 158
extratropical and tropical eruptions, with a peak 〈𝑟eff〉 of around 0.4 μm. For July 30 hPa 159
injections, simulated 〈𝑟eff〉 for extratropical eruptions reaches much larger values (>0.6 μm) 160
than comparable tropical eruptions (~0.4 μm). Sulfur injections into the extratropical lower 161
stratosphere (100 and 150 hPa) result in lower 〈𝑟eff〉 compared to 30 hPa injections, with again, 162
July eruptions leading to larger 〈𝑟eff〉 than January eruptions. The sensitivity of 〈𝑟eff〉 to eruption 163
latitude, season and injection height can be understood to be primarily controlled by the 164
9 availability of hydroxyl radical (OH), which controls the rate of SO2-to-H2SO4 conversion. Higher 165
OH values, which occur in the high-latitude stratosphere during summer (Supplementary Fig. 5), 166
lead to faster H2SO4 production. When H2SO4 production is fast compared to stratospheric 167
mixing and transport processes, H2SO4 concentrations are relatively enhanced at a local to 168
regional scale, promoting aerosol growth through condensation and coagulation.
169
SAOD at 550 nm quantifies the attenuation of solar radiation by aerosol, and is a function of the 170
sulfate burden as well as effective radius. January extratropical 30 hPa injections lead to a 171
global mean SAOD (Fig. 3c) very similar to tropical 30 hPa eruptions, reflecting similar global 172
sulfate burdens and 〈𝑟eff〉. July extratropical 30 hPa injections lead to a much weaker global 173
mean SAOD than tropical 30 hPa eruptions (Fig. 3d), due to both the faster decay of the sulfate 174
burden and larger 〈𝑟eff〉. In terms of three-year cumulative SAOD (Fig 3e), extratropical 30 hPa 175
injections in January produce only ~10% less global mean SAOD than comparable tropical 176
eruptions, while extratropical 30 hPa eruptions in July produce 30% (36°N) to 53% (56°N) less 177
SAOD compared to tropical counterparts. Injections into the extratropical lower stratosphere in 178
general lead to smaller SAOD than injections to 30 hPa, although due to the smaller 〈𝑟eff〉 for 179
lower injection heights, the impact of injection height is weaker on SAOD than on sulfate 180
burden lifetime. The importance of 𝑟eff is especially apparent for July eruptions at 56°N, where 181
the simulated peak and cumulative SAOD resulting from an 100 hPa injection is similar to that 182
from a 30 hPa injection, despite a smaller sulfate burden.
183
Post-volcanic surface temperature anomalies result from the impact of aerosol on atmospheric 184
radiative transfer, which is often quantified as radiative forcing (W m-2). The radiative impact of 185
10 the simulated eruptions is quantified through the top-of-atmosphere net radiative anomalies:
186
since the simulations are performed with fixed sea surface temperatures (SST) and sea ice, this 187
is equivalent to the “fixed SST” version of effective radiative forcing (ERF)35,36. Simulated global 188
mean ERF anomalies for extratropical eruptions (Supplementary Fig. 6) at 30 hPa are smaller 189
than that of corresponding tropical eruptions in the ensemble mean, although this difference is 190
as small as 15%, and in many cases the ensemble range for extratropical eruptions overlaps 191
with that of tropical eruptions. Global mean ERF anomalies for extratropical LMS injections 192
range from 57-91% smaller than for tropical eruptions.
193
Impact of volcanic radiative forcing in the NH extratropics 194
Modelling studies suggest that regional surface temperature responses to external radiative 195
forcing depend on the structure of the forcing, and that NH extratropical temperatures respond 196
predominantly to extratropical forcing37. Since the NH tree ring-based temperature 197
reconstructions explored above are based on samples collected in the mid-to high latitudes, we 198
examine the simulated radiative forcing in the NH extratropics (NHext = 30-90°N).
199
Aerosol from extratropical eruptions is heavily concentrated within the NH (Fig. 2), and 200
particularly within the NHext where SAOD resulting from extratropical 30 hPa eruptions peak at 201
values up to 2-3 times larger than those of tropical 30 hPa injections (Fig. 4a,b). As a result, 202
NHext-averaged ERF (Fig 4c,d) from extratropical 30 hPa injections is stronger than that from 203
tropical 30 hPa injections. Three-year cumulative NHext-averaged ERF (Fig 4e) from 204
extratropical 30 hPa January injections are 70-80% stronger than the average of tropical 30 hPa 205
injections. Extratropical 30 hPa July injections, in contrast, produce cumulative NHext-averaged 206
ERF of -3 to +34% compared to tropical eruptions, indicating a strong sensitivity to eruption 207
11 season. Differences between tropical and extratropical injections are also apparent in the time 208
evolution of ERF: for January eruptions (Fig. 4c), peak ERF values for tropical 30 hPa and 209
extratropical lower stratosphere injections occur within the first four months, while ERF for 210
extratropical 30 hPa injections peaks 6 months after the eruption during NH summer. For July 211
eruptions (Fig. 4b), the peak forcing from extratropical injections occurs within the summer of 212
eruption, while that of tropical 30 hPa injections occurs 6-9 months later, during NH winter and 213
spring.
214
Results described above challenge the perception that extratropical eruptions are less 215
climatically important than tropical eruptions. While simulated SAOD and ERF are weaker for 216
NH extratropical eruptions than for tropical eruptions in the global mean, the hemispheric 217
confinement of aerosol results in stronger radiative anomalies over the NH, with NHext ERF for 218
extratropical eruptions up to 80% stronger than tropical eruptions. This result is consistent with 219
the stronger ∆𝑇-to-VSSI ratio for extratropical eruptions in tree ring based NH temperature 220
reconstructions. While the tree rings imply a stronger difference between ∆𝑇-to-VSSI ratios for 221
extratropical and tropical eruptions than model-based differences in radiative forcing, an 80%
222
stronger response to extratropical eruptions lies within the 2σ uncertainty range of the percent 223
differences in ∆𝑇-to-VSSI ratio between extratropical and tropical eruptions. Furthermore, 224
quantitative differences between tree ring-based ∆𝑇-to-VSSI ratios and model-based radiative 225
forcing may reflect non-linearity in temperature sensitivity to spatially inhomogeneous 226
radiative forcing38, and uncertainties in proxy-based estimates. We note particularly that 227
quantitative agreement between ∆𝑇-to-VSSI ratios and modeled radiative forcing is much 228
12 closer if VSSI values for extratropical eruptions were calculated using the same transfer function 229
as for tropical eruptions (Table 1).
230
Implications for past and future extratropical eruptions 231
Past reconstructions of volcanic forcing have assumed short stratospheric lifetimes and weak 232
radiative forcing of aerosol from extratropical eruptions. Our modeling experiments confirm a 233
shorter aerosol lifetime for extratropical injections, however, for a constant injection height in 234
the stratospheric overworld, the effect is as little as 10%. Our simulations demonstrate that the 235
lifetime of stratospheric aerosol from extratropical injections is strongly connected to the 236
injection height within the stratosphere. The assumption of a short lifetime for extratropical 237
eruptions in previous work4 is likely tied to an implicit assumption of lower injection heights.
238
However, volcanic plume models suggest that plume heights have weak dependence on 239
eruption latitude39,40, and estimated maximum plume heights for the 1912 Katmai (58°N) 240
eruption based on estimated mass eruption rates and tephra dispersal reach 28 km41, 241
comparable to that of Pinatubo. Prior reconstructions of volcanic forcing, for example those5,42 242
used in simulations of the Last Millennium as part of the fifth phase of the Coupled Model 243
Intercomparison Project43, appear to underestimate the climate impact of extratropical 244
eruptions relative to tropical eruptions (Supplementary Fig. 7). More accurate reconstruction of 245
the magnitude and timing of past extratropical eruptions, and the optical properties of the 246
associated stratospheric aerosol, may increase the proportion of temperature variability 247
attributable to external forcing.
248
Strong sensitivity of simulated radiative forcing to the season and injection height of 249
extratropical eruptions—resulting from impacts on stratospheric lifetime, aerosol effective 250
13 radius and phasing between SAOD and incoming solar radiation27—is consistent with the
251
scatter in the relationship between tree ring-derived cooling and VSSI for extratropical 252
eruptions. Reconstructions of volcanic forcing could therefore benefit from information of 253
season and injection height. Information on eruption season has been obtained in some cases 254
from high resolution analysis of ice cores44, historical records20,45, and geochemical analysis of 255
volcanic tephra in ice cores46–48. Analysis of the isotopic composition of ice core sulfate has 256
been suggested as indicative of the height reached by the sulfate aerosol49–51, although this 257
approach has been criticized on the basis that isotopic sulfur fractionation is related to the 258
height of aerosol with respect to the peak in the vertical profile of extratropical ozone 259
concentration rather than with respect to the tropopause9. Our model results suggest that 260
aerosol lifetime varies throughout the extratropical lower stratosphere, with an important 261
threshold being the interface between the LMS and overworld, which is comparable to the level 262
of peak ozone concentration. Thus, our results support the utility of sulfur isotope analysis for 263
providing valuable information on volcanic radiative forcing.
264
Volcanic eruptions with large VSSI have been less frequent in the extratropics than in the 265
tropics over recent centuries (Fig. 1). Many of the largest ice core sulfate signals from 266
extratropical eruptions originate from eruptions like Laki (1783/84 CE) that were at least partly 267
effusive52. In other cases, extratropical eruptions with large erupted mass like Changbaishan 268
(946 CE)53 appear to have had a small VSSI. A clear example of an extratropical explosive 269
eruption with strong VSSI is that of the ca. 536 CE eruption, which produced solar dimming 270
lasting over a year54, leading to some of the coldest NH temperatures of the Common Era. The 271
Common Era is however a short sample in geological terms, and the (admittedly incomplete55) 272
14 Holocene volcanic record28 suggests major (VEI ≥ 5) eruptions are just as common in the NH 273
extratropics as in the tropics. Extratropical volcanic eruptions with large sulfur injections into 274
the stratospheric overworld have occurred in the past, and they will in the future. Our results 275
suggest that rather than reducing the radiative forcing and climate impact of such major 276
eruptions, the extratropical eruption latitude acts primarily to focus the radiative impacts 277
within the NH, strengthening its hemispheric climate impact.
278
References
279
1. Robock, A. Volcanic Eruptions and Climate. Rev. Geophys. 38, 191–219 (2000).
280
2. Kirtman, B. et al. in Climate Change 2013: The Physical Science Basis. Contribution of 281
Working Group I to the Fifth Assessment Report of the Intergovernmental Panel on 282
Climate Change (eds. Stocker, T. F. et al.) 953–1028 (Cambridge University Press, 2013).
283
3. Myhre, G. et al. in Climate Change 2013: The Physical Science Basis. Contribution of 284
Working Group I to the Fifth Assessment Report of the Intergovernmental Panel on 285
Climate Change (eds. Stocker, T. F. et al.) 658–740 (Cambridge University Press, 2013).
286
4. Schneider, D. P., Ammann, C. M., Otto-Bliesner, B. L. & Kaufman, D. S. Climate response 287
to large, high-latitude and low-latitude volcanic eruptions in the Community Climate 288
System Model. J. Geophys. Res. 114, D15101 (2009).
289
5. Gao, C., Robock, A. & Ammann, C. Volcanic forcing of climate over the past 1500 years:
290
An improved ice core-based index for climate models. J. Geophys. Res. 113, D23111 291
(2008).
292
6. Ammann, C. M., Meehl, G. A., Washington, W. M. & Zender, C. S. A monthly and 293
latitudinally varying volcanic forcing dataset in simulations of 20th century climate.
294
Geophys. Res. Lett. 30, 59–1 (2003).
295
7. Carn, S. A., Clarisse, L. & Prata, A. J. Multi-decadal satellite measurements of global 296
volcanic degassing. J. Volcanol. Geotherm. Res. 311, 99–134 (2016).
297
8. Sigl, M. et al. Timing and climate forcing of volcanic eruptions for the past 2,500 years.
298
Nature 523, 543–549 (2015).
299
9. Schmidt, A., Thordarson, T., Oman, L. D., Robock, A. & Self, S. Climatic impact of the long- 300
lasting 1783 Laki eruption: Inapplicability of mass-independent sulfur isotopic 301
composition measurements. J. Geophys. Res. 117, D23116 (2012).
302
10. Santer, B. D. et al. Volcanic contribution to decadal changes in tropospheric temperature.
303
Nat. Geosci. 7, 185–189 (2014).
304
15 11. Solomon, S. et al. The Persistently Variable ‘Background’ Stratospheric Aerosol Layer and 305
Global Climate Change. Science 333, 866–70 (2011).
306
12. Haywood, J. M., Jones, A., Bellouin, N. & Stephenson, D. Asymmetric forcing from 307
stratospheric aerosols impacts Sahelian rainfall. Nat. Clim. Chang. 3, 660–665 (2013).
308
13. Colose, C. M., LeGrande, A. N. & Vuille, M. The influence of volcanic eruptions on the 309
climate of tropical South America during the last millennium in an isotope-enabled 310
general circulation model. Clim. Past 12, 961–979 (2016).
311
14. Pausata, F. S. R., Chafik, L., Caballero, R. & Battisti, D. S. Impacts of high-latitude volcanic 312
eruptions on ENSO and AMOC. Proc. Natl. Acad. Sci. 112, 13784–13788 (2015).
313
15. Stevenson, S., Fasullo, J. T., Otto-Bliesner, B. L., Tomas, R. A. & Gao, C. Role of eruption 314
season in reconciling model and proxy responses to tropical volcanism. Proc. Natl. Acad.
315
Sci. U. S. A. 114, 1822–1826 (2017).
316
16. Toohey, M., Krüger, K., Sigl, M., Stordal, F. & Svensen, H. Climatic and societal impacts of 317
a volcanic double event at the dawn of the Middle Ages. Clim. Change 136, 401–412 318
(2016).
319
17. Büntgen, U. et al. Cooling and societal change during the Late Antique Little Ice Age from 320
536 to around 660 AD. Nat. Geosci. 9, 231–236 (2016).
321
18. Briffa, K. R., Jones, P. D., Schweingruber, F. H. & Osborn, T. J. Influence of volcanic 322
eruptions on Northern Hemisphere summer temperature over the past 600 years.
323
Nature 393, 450–455 (1998).
324
19. Wilson, R. et al. Last millennium northern hemisphere summer temperatures from tree 325
rings: Part I: The long term context. Quat. Sci. Rev. 134, 1–18 (2016).
326
20. Stoffel, M. et al. Estimates of volcanic-induced cooling in the Northern Hemisphere over 327
the past 1,500 years. Nat. Geosci. 8, 784–788 (2015).
328
21. Schneider, L. et al. Revising midlatitude summer temperatures back to A.D. 600 based on 329
a wood density network. Geophys. Res. Lett. 42, 4556–4562 (2015).
330
22. Toohey, M. & Sigl, M. Volcanic stratospheric sulfur injections and aerosol optical depth 331
from 500 BCE to 1900 CE. Earth Syst. Sci. Data 9, 809–831 (2017).
332
23. Gao, C., Oman, L., Robock, A. & Stenchikov, G. L. Atmospheric volcanic loading derived 333
from bipolar ice cores: Accounting for the spatial distribution of volcanic deposition. J.
334
Geophys. Res. 112, D09109 (2007).
335
24. Oman, L. et al. Modeling the distribution of the volcanic aerosol cloud from the 1783–
336
1784 Laki eruption. J. Geophys. Res. 111, D12209 (2006).
337
25. Guo, S., Bluth, G. J. S., Rose, W. I., Watson, I. M. & Prata, A. J. Re-evaluation of SO 2 338
release of the 15 June 1991 Pinatubo eruption using ultraviolet and infrared satellite 339
sensors. Geochemistry Geophys. Geosystems 5, Q04001 (2004).
340
26. Toohey, M., Krüger, K., Niemeier, U. & Timmreck, C. The influence of eruption season on 341
the global aerosol evolution and radiative impact of tropical volcanic eruptions. Atmos.
342
16 Chem. Phys. 11, 12351–12367 (2011).
343
27. Kravitz, B. & Robock, A. Climate effects of high-latitude volcanic eruptions: Role of the 344
time of year. J. Geophys. Res. 116, D01105 (2011).
345
28. Global Volcanism Program. in Smithsonian Institution (ed. Venzke, E.) (2013).
346
29. D’Arrigo, R., Wilson, R. & Tudhope, A. The impact of volcanic forcing on tropical 347
temperatures during the past four centuries. Nat. Geosci. 2, 51–56 (2008).
348
30. Plumb, R. A. Stratospheric Transport. J. Meteorol. Soc. Japan 80, 793–809 (2002).
349
31. Holton, J. R. et al. Stratosphere-Troposphere Exchange. Rev. Geophys. 33, 403–439 350
(1995).
351
32. Timmreck, C. et al. Aerosol size confines climate response to volcanic super-eruptions.
352
Geophys. Res. Lett. 37, L24705 (2010).
353
33. Lacis, A. Volcanic aerosol radiative properties. PAGES Newsl. 23, 50–51 (2015).
354
34. Stenchikov, G. L. et al. Radiative forcing from the 1991 Mount Pinatubo volcanic 355
eruption. J. Geophys. Res. 103, 13837–13857 (1998).
356
35. Forster, P. M. et al. Recommendations for diagnosing effective radiative forcing from 357
climate models for CMIP6. J. Geophys. Res. Atmos. 121, 12,460-12,475 (2016).
358
36. Hansen, J. et al. Efficacy of climate forcings. J. Geophys. Res. 110, D18104 (2005).
359
37. Shindell, D. & Faluvegi, G. Climate response to regional radiative forcing during the 360
twentieth century. Nat. Geosci. 2, 294–300 (2009).
361
38. Shindell, D. T., Faluvegi, G., Rotstayn, L. & Milly, G. Spatial patterns of radiative forcing 362
and surface temperature response. J. Geophys. Res. Atmos. 120, 5385–5403 (2015).
363
39. Glaze, L. S. & Baloga, S. M. Sensitivity of buoyant plume heights to ambient atmospheric 364
conditions: Implications for volcanic eruption columns. J. Geophys. Res. 101, 1529–1540 365
(1996).
366
40. Sparks, R. S. J. The dimensions and dynamics of volcanic eruption columns. Bull. Volcanol.
367
48, 3–15 (1986).
368
41. Hildreth, W. & Fierstein, J. The Novarupta-Katmai eruption of 1912--largest eruption of 369
the twentieth century: centennial perspectives. U.S. Geological Survey Professional Paper 370
1791, 259 p., available at https://pubs.usgs.gov/pp/1791/, (2012).
371
42. Crowley, T. J. & Unterman, M. B. Technical details concerning development of a 1200 yr 372
proxy index for global volcanism. Earth Syst. Sci. Data 5, 187–197 (2013).
373
43. Schmidt, G. A. et al. Climate forcing reconstructions for use in PMIP simulations of the 374
last millennium (v1.0). Geosci. Model Dev. 4, 33–45 (2011).
375
44. Cole-Dai, J. et al. Cold decade (AD 1810–1819) caused by Tambora (1815) and another 376
(1809) stratospheric volcanic eruption. Geophys. Res. Lett. 36, L22703 (2009).
377
45. Guillet, S. et al. Climate response to the Samalas volcanic eruption in 1257 revealed by 378
proxy records. Nat. Geosci 10, 123–128 (2017).
379
46. Jensen, B. J. L. et al. Transatlantic distribution of the Alaskan White River Ash. Geology 380
17 42, 875–878 (2014).
381
47. Sun, C. et al. Ash from Changbaishan Millennium eruption recorded in Greenland ice:
382
Implications for determining the eruption’s timing and impact. Geophys. Res. Lett. 41, 383
694–701 (2014).
384
48. Oppenheimer, C. et al. The Eldgjá eruption: timing, long-range impacts and influence on 385
the Christianisation of Iceland. Clim. Change 147, 369–381 (2018).
386
49. Baroni, M., Savarino, J., Cole-Dai, J., Rai, V. K. & Thiemens, M. H. Anomalous sulfur 387
isotope compositions of volcanic sulfate over the last millennium in Antarctic ice cores. J.
388
Geophys. Res. 113, D20112 (2008).
389
50. Savarino, J., Romero, A., Cole‐Dai, J., Bekki, S. & Thiemens, M. H. UV induced mass- 390
independent sulfur isotope fractionation in stratospheric volcanic sulfate. Geophys. Res.
391
Lett. 30, 2131 (2003).
392
51. Lanciki, A., Cole-Dai, J., Thiemens, M. H. & Savarino, J. Sulfur isotope evidence of little or 393
no stratospheric impact by the 1783 Laki volcanic eruption. Geophys. Res. Lett. 39, 394
L01806 (2012).
395
52. Thordarson, T. & Larsen, G. Volcanism in Iceland in historical time: Volcano types, 396
eruption styles and eruptive history. J. Geodyn. 43, 118–152 (2007).
397
53. Oppenheimer, C. et al. Multi-proxy dating the ‘Millennium Eruption’ of Changbaishan to 398
late 946 CE. Quat. Sci. Rev. 158, 164–171 (2017).
399
54. Stothers, R. B. Mystery cloud of AD 536. Nature 307, 344–345 (1984).
400
55. Watt, S. F. L., Pyle, D. M. & Mather, T. A. The volcanic response to deglaciation: Evidence 401
from glaciated arcs and a reassessment of global eruption records. Earth-Science Rev.
402
122, 77–102 (2013).
403
18
Acknowledgements
404
This work was supported by the Federal Ministry for Education and Research in Germany 405
(BMBF) through the research program “MiKlip” (FKZ:01LP130B, 01LP1130A and 01LP1517B).
406
MT additionally acknowledges support by the Deutsche Forschungsgemeinschaft (DFG) in the 407
framework of the priority programme “Antarctic Research with comparative investigations in 408
Arctic ice areas” through grant TO 967/1-1. KK and M. Sigl acknowledge support through the 409
NFR project “VIKINGS” (Project No. 275191). CT additionally acknowledges support from 410
supported by the European Union project StratoClim (FP7-ENV.2013.6.1-2). Computations were 411
performed at the German Climate Computer Center (DKRZ). The authors thank Lea Schneider 412
and coworkers for making their NH temperature reconstruction publically available. This paper 413
is a product of the Volcanic Impacts on Climate and Society (VICS) working group, as part of the 414
Past Global Changes (PAGES) project, which in turn received support from the US National 415
Science Foundation and the Swiss Academy of Sciences.
416
Author Contributions
417
M.T., K.K., C.T. and H.S. designed the model experiments. M.T. performed the model 418
simulations and analysis with input from K.K., C.T., and H.S. M.T. performed the analysis of tree- 419
ring temperature reconstructions and volcanic stratospheric sulfur injections with input from 420
M. Sigl, M. Stoffel and R.W. M.T. led the manuscript writing with input from all coauthors.
421
Competing Financial Interests statement
422
The authors declare no competing financial interests.
423
19
Tables
424
Table 1: Post-eruption Northern Hemisphere 3-year mean temperature anomalies to 425
estimated volcanic stratospheric sulfur injection (VSSI) ratios for tropical and NH extratropical 426
explosive eruptions. Mean ∆𝑇 𝑉𝑆𝑆𝐼⁄ values over the tropical (“trop”) and extratropical 427
(“extrop”) events listed in Supplementary Tables 4 and 5, with 1σ standard error of the mean 428
are listed for the N-TREND19, STO1520, SCH1521 and NH temperature reconstructions, along with 429
that from the composite mean of the three reconstructions (ALL). Percent differences between 430
mean extratropical and tropical ∆𝑇 𝑉𝑆𝑆𝐼⁄ values are listed with 1σ uncertainties. Percent 431
differences between mean extratropical and tropical ∆𝑇 𝑉𝑆𝑆𝐼⁄ values are repeated in the final 432
row with VSSI for extratropical eruptions adjusted (𝑉𝑆𝑆𝐼∗= 𝑉𝑆𝑆𝐼 0.57⁄ ) such that the scaling 433
from ice core sulfate flux to VSSI is the same for both tropical and extratropical eruptions.
434
N-TREND STO15 SCH15 ALL
∆𝑻 𝑽𝑺𝑺𝑰|
𝐭𝐫𝐨𝐩 (°C [Tg S]-1)
-0.019 ± 0.006 -0.036 ± 0.009 -0.021 ± 0.003 -0.025 ± 0.005
∆𝑻 𝑽𝑺𝑺𝑰|
𝐞𝐱𝐭𝐫𝐨𝐩 (°C [Tg S]-1) -0.081 ± 0.020 -0.102 ± 0.024 -0.059 ± 0.018 -0.080 ± 0.018
∆𝑻 𝑽𝑺𝑺𝑰|
𝐞𝐱𝐭𝐫𝐨𝐩− ∆𝑻
𝑽𝑺𝑺𝑰|
𝐭𝐫𝐨𝐩 (%)
330 ± 150 180 ± 82 180 ± 94 220 ± 85
∆𝑻 𝑽𝑺𝑺𝑰∗|
𝐞𝐱𝐭𝐫𝐨𝐩− ∆𝑻
𝑽𝑺𝑺𝑰|
𝐭𝐫𝐨𝐩 (%) 150 ± 87 58 ± 47 61 ± 54 81 ± 48
435
20
Figure captions
436
Figure 1: Reconstructed post-volcanic NH temperature response to NH extratropical and 437
tropical eruptions in relation to volcanic stratospheric sulfur injection. Three-year mean 438
temperature anomalies (∆𝑇3𝑦𝑟𝐴𝐿𝐿) are plotted versus estimated volcanic stratospheric sulfur 439
injection (VSSI, Tg [S]) for (blue) tropical and (orange) extratropical explosive eruptions.
440
Numbers in the boxes indicate eruption years. Vertical and horizontal error bars represent ±1σ 441
uncertainties. The 1257 Samalas eruption (see Supplementary Table 4), lies outside the chosen 442
limits of the plot. Colored lines indicate the mean ∆𝑇-to-VSSI ratio for both tropical and 443
extratropical eruptions after 750 CE. Temperature anomalies for NH extratropical events before 444
750 CE are shown with orange-filled markers. Inset panel shows boxplots of the distribution of 445
three-year mean NH temperature anomalies per unit VSSI. Boxplots are shown separately for 446
eruptions with VSSI less than 7 Tg S (gray shading on both plots) and the eruptions with VSSI 447
greater than 7 Tg S. Crosses denote the distribution mean, horizontal line the median, box the 448
25-75% interquantile range, whiskers the 1-99% interquantile range, and outliers are marked 449
with circles. For extratropical eruptions with VSSI>7 Tg S, markers show cooling-to-VSSI ratios 450
for individual eruptions in orange (post-750 CE) and black (pre-750 CE).
451
Figure 2: Simulated volcanic stratospheric aerosol burdens and lifetimes for varying eruption 452
latitude, season and injection height. Ensemble mean zonal mean aerosol burdens (in kg [S]
453
km-2) are shown for (a, b) tropical (15°N) and (c, d) extratropical (56°N) eruptions of 8.5 Tg S in 454
(a, c) January and (b, d) July. Ensemble mean global sulfur burden (Tg [S]) time series are shown 455
(e, f) for the six simulated injection locations. Line colors denote injection latitude and heights 456
as listed in legend of panel (e). In panel (g) stratospheric sulfur e-folding lifetimes are shown for 457
each eruption latitude and injection height, with black whiskers indicating the full ensemble 458
spread. For the extratropical injection cases, text labels show the percent difference of sulfur e- 459
folding lifetime with respect to the mean of the tropical (4°S and 15°N, 30 hPa) injection 460
eruption simulations.
461 462 463
21 Figure 3: Simulated global mean volcanic aerosol properties for varying eruption latitude, 464
season and injection height. Panels show (a, b) ensemble mean sulfate-weighted effective 465
radius (〈𝑟eff〉), and (c,d) ensemble mean stratospheric aerosol optical depth (SAOD), from 466
simulated eruptions of 8.5 Tg S in (left) January and (right) July. Line colors denote injection 467
latitude and heights as listed in legend of panel (c). Three-year cumulative SAOD is shown in 468
panel (e) as a function of injection latitude and height, with black whiskers indicating the full 469
ensemble spread. For the extratropical injection cases, text labels show the percent difference 470
of cumulative SAOD with respect to the mean of the tropical (4°S and 15°N, 30 hPa) injection 471
eruption simulations.
472
Figure 4: Simulated volcanic SAOD and effective radiative forcing over the NH extratropics 473
(30-90°N) for varying eruption latitude, season and injection height. Shown are (a,b) SAOD 474
and (d,e) effective radiative forcing (ERF) for simulated eruptions of 8.5 Tg S in (left) January 475
and (right) July. Line colors denote injection latitude and heights as listed in legend of panel (a).
476
Three-year cumulative NHext ERF is shown in panel (e) as a function of injection latitude and 477
height, with black lines indicating the full ensemble spread. For the extratropical injection 478
cases, text labels show the percent difference of cumulative ERF with respect to the mean of 479
the tropical (4°S and 15°N, 30 hPa) injection eruption simulations.
480 481
22 Methods
482
Volcanic stratospheric sulfur injections 483
Volcanic stratospheric sulfur injection (VSSI) estimates before 1900 CE are taken from the 484
eVolv2k database22, based on analysis of bipolar ice core arrays. For the 20th Century, satellite 485
observations7 are used for estimates of VSSI for Pinatubo (1991) and El Chichón (1982). For 486
eruptions between 1900 and the start of the satellite era, we used Antarctic and Greenland ice 487
core sulfate fluxes from the ICI reconstruction of Ref 42, and applied the scaling methodology 488
used in the construction of eVolv2k. Categorization of eruptions as tropical or extratropical is 489
provided by the eVolv2k reconstruction based on the presence or lack of bipolar ice core sulfate 490
signals, or from observations for 20th Century eruptions. Eruption years for unidentified tropical 491
eruptions are adjusted one year earlier than listed in the eVolv2k database, to account for the 492
typical 1-year lag between eruption and ice sheet deposition. All unidentified eruptions are 493
thereafter assumed to have a dating uncertainty of ±1 year for 1750-1900 CE and ±2 years from 494
500-1750 CE.
495
Post eruption Northern Hemisphere temperature anomalies 496
Based on the compiled VSSI record, we first select tropical and NH extratropical volcanic events 497
between 500-2000 CE with estimated VSSI greater than 2 Tg S. From this list, in order to 498
exclude events in which cooling from the eruption in question may be superimposed on the 499
return to normal conditions after a preceding eruption, we exclude events for which an 500
eruption of magnitude greater than 2 Tg S occurred within the preceding 6 years, and also 501
those for which an event greater than 10 Tg S occurred within the preceding 10 years. This 502
process excluded 17 eruptions (Supplementary Table 2), including well known examples such as 503
23 Tambora (1815) and an unidentified eruption of ca. 1457 CE. Extratropical eruptions which are 504
known or suspected to have been characterized by some degree of effusive eruption style, 505
including the strong Icelandic “fire” eruptions of Laki (1783-84) and Eldgjá (939) have also been 506
excluded (Supplementary Table 3): the remaining extratropical events are assumed to 507
represent extratropical explosive events although it should be clear that this list likely includes 508
signals from additional Icelandic effusive events.
509
For each volcanic event, NH summer temperature anomalies are constructed using three recent 510
reconstructions 19–21. First, based on a simple mean of the three reconstructions, eruption dates 511
for unidentified eruptions are adjusted within the dating uncertainty to maximize the post- 512
eruption 3 year mean cooling anomaly. This adjustment aims to take into account uncertainty 513
in the dating of the ice core signals, but also the possible shift related to eruptions occurring 514
before or after summer of any calendar year. Temperature anomalies for each event and each 515
temperature reconstruction are then calculated with respect to the preceding 5 years. Given an 516
estimated eruption at year y0, NH 3 year mean temperature anomalies (∆𝑇3yr) are calculated as 517
follows for tropical and NH extratropical eruptions:
518
Tropical eruption NH extratropical eruption
∆𝑇3yr: Three year mean anomaly
1
3∑ 𝑇𝑦0+𝑖
3
𝑖=1
−1
5 ∑ 𝑇𝑦0+𝑖
−1
𝑖=−5
1
3∑ 𝑇𝑦0+𝑖
2
𝑖=0
−1
5 ∑ 𝑇𝑦0+𝑖
−1
𝑖=−5
519
Uncertainties (𝜎) in the tree ring-based temperature reconstructions are taken from the 520
original data sets. Uncertainties in post volcanic three year temperature anomalies and multi- 521
24 reconstruction means are calculated using reported uncertainties and standard rules of error 522
propagation.
523
MAECHAM5-HAM 524
Simulations of volcanic stratospheric sulfur injections are performed with the aerosol-climate 525
model MAECHAM5-HAM 26,56,57. The spatial resolution is ~2.8° by 2.8°, with T42 spectral 526
truncation and 39 vertical levels up to 0.01 hPa (~80 km). The atmospheric component of the 527
model is free running, while sea surface temperatures are prescribed as an annually repeating 528
climatology.
529
Volcanic simulations are initiated by the injection of SO2 into a specified model grid box and 530
height. A sulfur chemistry module converts SO2 to H2SO4 via the reactions:
531
SO2 + OH +M → HSO3 +M (1)
HSO3 +O2 → HO2 + SO3 (2)
SO3 + H2O → H2SO4 (3)
532
The rate of SO2 to H2SO4 conversion depends on concentrations of hydroxyl radical (OH) taken 533
from prior chemistry–climate model simulations58. The use of prescribed OH concentrations 534
neglects potential changes in H2SO4 production rates due to local consumption of OH, which is 535
thought to play an important role for extremely large eruptions59. The prescribed monthly 536
mean OH fields contain significant spatial structure (Supplementary Fig. 5), with very low 537
concentrations in polar winter due to the dependence of OH production on solar insolation.
538
There is also a strong vertical gradient in OH concentrations through the lower and middle 539
25 stratosphere, due to changes in solar ultraviolet radiative flux and the availability of H2O, which 540
has a minimum around the level of the tropopause.
541
After oxidation of the volcanic SO2 source gas, H2SO4 condenses with water to form sulfate 542
(SO4) aerosol. Aerosol processes in MAECHAM5-HAM are calculated by the aerosol 543
microphysical module HAM60, and include aerosol formation and growth via nucleation, 544
condensation, accumulation, and coagulation; vertical redistribution via sedimentation; and 545
finally the removal processes wet and dry deposition.
546
Pinatubo-magnitude simulations with MAECHAM5-HAM have resulted in good agreement with 547
observations in terms of the aerosol optical depth (AOD), top of atmosphere short-wave 548
radiation anomalies, and aerosol effective radius26,56. The MAECHAM5-HAM configuration used 549
here has no quasi- biennial oscillation (QBO): winds in the equatorial stratosphere are easterly 550
throughout the year, and therefore variability of stratospheric dynamics61 and aerosol transport 551
related to the QBO are not included in the simulations. The decay of simulated AOD was found 552
to be slightly faster than that observed, which is perhaps related to a slight high-bias in the 553
simulated aerosol effective radius56. On the other hand, consistency in the timing of 554
extratropical AOD peak values suggests the model reproduces well the seasonal variation in 555
aerosol transport26. For tropical eruptions of Pinatubo magnitude and below, the model 556
produces a linear relationship between radiative forcing and VSSI62. 557
Model experiments 558
To isolate the impact of eruption latitude on the aerosol evolution and resulting radiative 559
forcing, we performed ensemble MAECHAM5-HAM simulations with a fixed magnitude of 560
26 volcanic stratospheric sulfur injection at various latitudes, months and injection heights. We 561
choose the estimated VSSI of the 1991 eruption of Pinatubo (17 Tg SO2 or equivalently 8.5 Tg [S]
562
injection), since observations of the Pinatubo aerosol provide the best estimates of sulfur 563
injection, aerosol evolution and radiative forcing of any major volcanic eruption, making it a 564
standard modeling validation experiment. Simulation eruption locations are chosen based on 565
the global distribution of identified volcanic eruptions with Volcanic Explosivity Index equal to 566
or greater than 5 (Supplementary Fig. 2) according to the Volcanoes of the World (VOTW) 567
database28. Four 10-degree latitude ranges contain 57% of all VEI ≥ 5 eruptions in the VOTW 568
database: in order of eruption frequency, these latitude bands are 50-60°N, 30-40°N, 0-10°S, 569
and 10-20°N. For each of these four latitude ranges, we chose a “typical” eruption location, 570
roughly consistent with the highest density of identified eruptions, sampling global eruptions 571
hot spots including Indonesia, Central America, Japan and Alaska (Supplementary Table 1). The 572
chosen eruption locations are spread evenly between the western and eastern coasts of the 573
Pacific Ocean, although model simulations suggest no significant impact of the eruption 574
longitude on the aerosol evolution following explosive tropical eruptions26. To include the 575
potential impacts of eruption season, simulations are performed with eruptions in both January 576
and July. This choice of months is somewhat arbitrary, but is motivated by: (1) the common use 577
of January 1 as a standard eruption date for eruptions on unknown eruption timing in volcanic 578
forcing reconstructions22,42; (2) the rough agreement of July 1 with the actual seasonal timing of 579
the Pinatubo eruption (on June 15, 1991); and (3) the fact that NH radiative anomalies from 580
January and July tropical eruptions nearly span the full range of SAOD and radiative forcing seen 581
in model simulations using a fuller sample of eruption season distribution26. Since the spatial 582
27 spread of aerosol is sensitive to the meteorological conditions at the time of the eruption63, 583
ensembles of simulation were performed. For each of the four eruption locations, we 584
performed ten MAECHAM-HAM eruption simulations with SO2 injection at 30 hPa (~23 km), five 585
simulations each for injections in January and July. To investigate the impact of injection height 586
for extratropical eruptions, simulations at 56°N were repeated with injection heights of 100 hPa 587
(~16 km) and 150 hPa (~13 km), with again, five simulations for January eruptions, and five 588
simulations for July eruptions.
589
A 30 year control run was performed with no stratospheric sulfur injections, with all other 590
boundary conditions and forcings identical to the eruptions simulations.
591
Model output 592
Sulfate aerosol column burdens and stratospheric aerosol optical depth (SAOD) are output 593
directly by the model, and zonal means over the full globe and the NH extratropics were 594
calculated using area-weighted means. Stratospheric sulfur lifetimes are calculated as the time 595
taken for the total sulfur (SO2 + H2SO4) to cross 1/e of the injected amount—this metric is 596
typically longer than lifetimes calculated based on the decay of sulfate after its peak value, but 597
is a better measure of the efficiency of loss processes since the timing of the sulfate peak also 598
depends on the rate of SO2-to-H2SO4 conversion. Sulfate aerosol effective radius (𝑟eff), a 599
function of height, latitude and longitude, was averaged in space using sulfate aerosol mass as a 600
weighting function. The resulting sulfate-mass-weighted, 〈𝑟eff〉, represents the typical 𝑟eff in the 601
region of the most sulfate aerosol, which will dominate the radiative transfer calculations. Net 602
(shortwave + longwave) top of atmosphere (TAO) radiative anomalies were calculated as the 603
28 difference radiative fluxes between each eruption simulation and the control run climatology, 604
corresponding to the “fixed SST” effective radiative forcing (ERF) quantity35,36. 605
Data availability
606
Volcanic stratospheric sulfur injection estimates used in this study are available in the World 607
Data Center for Climate hosted by the German Climate Computing Center (DKRZ) with the 608
identifier doi:10.1594/WDCC/eVolv2k_v1. The NH temperature reconstructions are available 609
from https://www.ncdc.noaa.gov/paleo-search/study/19743, 610
https://www.ncdc.noaa.gov/paleo-search/study/19039, and 611
https://www.ncdc.noaa.gov/paleo-search/study/18875. Output from the ECHAM5-HAM 612
simulations is available from [still to come]
613
References
614
56. Niemeier, U. et al. Initial fate of fine ash and sulfur from large volcanic eruptions. Atmos.
615
Chem. Phys. 9, 9043–9057 (2009).
616
57. Toohey, M., Krüger, K. & Timmreck, C. Volcanic sulfate deposition to Greenland and 617
Antarctica: A modeling sensitivity study. J. Geophys. Res. Atmos. 118, 4788–4800 (2013).
618
58. Timmreck, C., Graf, H.-F. & Steil, B. in Volcanism and the Earth’s Atmosphere (eds.
619
Robock, A. & Oppenheimer, C.) 139, 213–225 (American Geophysical Union, 2003).
620
59. Bekki, S. Oxidation of volcanic SO 2 : A sink for stratospheric OH and H 2 O. Geophys. Res.
621
Lett. 22, 913–916 (1995).
622
60. Stier, P. et al. The aerosol-climate model ECHAM5-HAM. Atmos. Chem. Phys. 5, 1125–
623
1156 (2005).
624
61. Punge, H. J., Konopka, P., Giorgetta, M. A. & Müller, R. Effects of the quasi-biennial 625
oscillation on low-latitude transport in the stratosphere derived from trajectory 626
calculations. J. Geophys. Res. 114, D03102 (2009).
627
62. Metzner, D. et al. Radiative forcing and climate impact resulting from SO2 injections 628
based on a 200,000-year record of Plinian eruptions along the Central American Volcanic 629
Arc. Int. J. Earth Sci. 103, 2063–2079 (2014).
630
63. Jones, A. C., Haywood, J. M., Jones, A. & Aquila, V. Sensitivity of volcanic aerosol 631
29 dispersion to meteorological conditions: A Pinatubo case study. J. Geophys. Res. Atmos.
632
121, 6892–6908 (2016).
633