Impedance Analysis of Epithelial Barrier Function:
New Devices and Assays
DISSERTATION
zur Erlangung des Doktorgrades der Naturwissenschaften (Dr. rer. nat.) der Fakultät für Chemie und Pharmazie der Universität Regensburg
vorgelegt von Kathrin Hajek aus Mitterfelden, 2016
Diese Doktorarbeit entstand in der Zeit von Januar 2013 bis August 2016 am Institut für Analytische Chemie, Chemo- und Biosensorik der Fakultät Chemie und Pharmazie der Universität Regensburg.
Die Arbeit wurde angeleitet von Prof. Dr. Joachim Wegener.
Promotionsgesuch eingereicht am: 18. Oktober 2016
Kolloquiumstermin: 02. Dezember 2016
Prüfungsausschuss:
Vorsitzender: Prof. Dr. Antje J. Baeumner Erstgutachter: Prof. Dr. Joachim Wegener Zweitgutachter: Prof. Dr. Günther Bernhardt Drittprüfer: PD Dr. Miriam Breunig
In loving memory of Eduard Hajek.
Contents
1 Introduction 1
Epithelial barriers... 2
1.1 1.1.1 Architecture of epithelial cell-cell and cell-substrate contacts ... 2
1.1.2 Transport routes across epithelial barriers ... 4
Quantification of epithelial barrier function ... 5
1.2 1.2.1 Water permeability ... 5
1.2.2 Molecular permeability ... 7
1.2.3 Ionic permeability ... 10
2 Objectives 13 3 Theoretical background 15
Impedance spectroscopy ... 153.1 3.1.1 Equivalent circuit modeling ... 17
3.1.2 Data presentation... 18
3.1.3 Transfilter measurements ... 20
3.1.4 Electric cell-substrate impedance sensing (ECIS) ... 24
3.1.5 Impedance spectroscopy in presence of a redox couple ... 26
Permeability assays ... 28
3.2 3.2.1 Permeability coefficient PE ... 29
3.2.2 Calculation protocol ... 31
4 Materials and methods 35
Cell culture techniques ... 354.1 4.1.1 Cell lines ... 35
4.1.2 General cell culture conditions ... 35
4.1.3 Subcultivation ... 36
4.1.4 Particular inoculation protocols ... 37
4.1.5 Cryopreservation... 39
4.1.6 Solution osmolarity ... 40
4.1.7 Buffers and solutions ... 40
Electrode preparation ... 42
4.2 4.2.1 Planar electrodes ... 42
4.2.1.1 Indium tin oxide electrodes ... 44
4.2.1.2 Gold electrodes... 45
4.2.2 Stainless steel electrodes ... 46
4.2.3 Porous gold electrodes ... 47
Impedance measurements ... 48
4.3 4.3.1 Experimental set-up ... 48
4.3.2 Specific assay conditions ... 48
4.3.2.1 Transfilter measurements using stainless steel electrodes ... 49
4.3.2.2 Transfilter measurements including the porous backside electrode ... 49
4.3.2.3 Combined electrochemical determination of substrate permeability and TEER ... 50
4.3.2.4 Transcellular permeability monitoring via whole-cell impedance-based biosensors ... 51
4.3.2.5 ECIS measurements in a 96-well array format ... 52
4.3.3 Equivalent circuit modeling ... 52
Diffusion assays ... 53
4.4 4.4.1 Permeability assay using isotopic tracer molecules ... 54
4.4.2 Optical permeability assays ... 54
5 Porous electrodes as transducer for cell-based assays 57
Preliminary remarks: Resistance contribution of the subepithelial adhesion 5.1 zone ... 57Characterization of porous electrodes and the measurement chamber ... 63
5.2 5.2.1 Characterization of the measurement set-up ... 63
5.2.2 Parasitic impedance contributions: correction methods ... 68
5.2.3 Electrochemical properties of porous electrodes ... 71
Impedance analysis of barrier forming cell types in mono- or co-cultures ... 74 5.3
5.3.1 Homogeneous co-cultures ... 75
5.3.1.1 MDCK-lr co-culture ... 75
5.3.1.2 MDCK-hr co-culture... 84
5.3.2 Heterogeneous co-cultures ... 88
5.3.3 Independent access and readout of both compartments ... 91
5.3.4 Barrier manipulation: Influence of cytochalasin D on co-cultured cell layers ... 94
Porous gold electrodes in combination with the ECIS-technique ... 97
5.4 Summary and conclusion ... 100
5.5
6 Combined electrochemical determination of substrate permeability and TEER 103
Influence of [Fe(CN)6]3-/4- on epithelial barrier function ... 1046.1 6.1.1 Electric cell-substrate impedance sensing (ECIS) ... 104
6.1.2 Transepithelial electrical resistance in presence of [Fe(CN)6]3-/4- ... 106
Impedance based permeability studies ... 107
6.2 6.2.1 Electrode characterization and set-up calibration ... 107
6.2.2 Detecting defects within confluent cell layers ... 112
6.2.3 Impedimetric monitoring of [Fe(CN)6]3-/4- permeation across cell monolayers... 114
6.2.4 Permeability coefficients ... 119
Optical analysis of [Fe(CN)6]3-/4- permeation ... 122
6.3 Summary and outlook ... 124
6.4
7 Monitoring the permeation of endogenous molecules via whole-cell impedance-based biosensors 125
U-373 MG cells as sensory element ... 1267.1 7.1.1 Impact of histamine on epithelial barrier function ... 126
7.1.2 Monitoring histamine diffusion across barrier forming cell layers ... 128
7.1.3 Permeability coefficients of H1R ligands ... 132
BAECs as sensory element ... 136 7.2
Summary, conclusion and outlook ... 138 7.3
8 Impedimetric monitoring of epithelial barrier
function: relevance and perspectives 141
9 Summary 143
10 Zusammenfassung 147
11 References 151
12 Appendix 159
Supplementary information ... 159 12.1
Abbreviations and symbols ... 175 12.2
Curriculum vitae 179
Danksagung 181
1 Introduction
Four basic types of tissues are found in mammalian organisms - nervous, muscle, connective and epithelial tissue. They differ in both structure and function (Patton 2015). The latter is often subdivided into two parts, the membranous (or surface) epithelium and glandular epithelium. Furthermore, surface epithelium is classified by its cell shape and the number of cell layers (simple or stratified structures). Simple, one layered epithelial tissue can be found as blood or lymphatic vessel linings. In this case, the squamous epithelium is called endothelium. Simple cuboidal or columnar epithelial tissue is lining glands and their ducts (e.g. in the kidney) or parts of the digestive system. Depending on the physiological location and the tissue structure, epithelial cell layers execute various functions. Sensory functions, secretory activities as well as the absorption of nutrients or the excretion of metabolic products is rendered by epithelial tissues. In order to allow directional transport processes, epithelial cell sheets exhibit tight cell-cell contacts and an apical/basal membrane polarity.
The molecular composition of lipids and proteins in the apical (luminal) membrane domain differs from the basolateral membrane domain (Balcarova-Staender et al. 1984). This asymmetric distribution and activity of transport proteins, ion channels or pumps is in combination with a tight sealing of the intercellular gaps essential for a directed transcellular substance transport. The connection of neighboring cells via cell-cell contacts prevents the uncontrolled paracellular diffusion of most hydrophilic molecules as well as the lateral diffusion of membrane components, thereby also maintaining the apical/basal polarity.
Additionally, the membrane area of epithelial tissue, which is involved in absorption processes, is often increased due to the formation of microvilli in the apical membrane domain. An increased apical surface area is favorable for rapid and effective transport or absorption processes. Arranged as a sheet of densely packed cells with adjustable intercellular junctions, each cell also exhibits contacts to a basement membrane (cell-substrate junctions). This membrane is a network of extracellular matrix proteins onto which the cells can adhere. The basement membrane allows a mechanical stabilization of the epithelium and separates it from the connective tissue below (Wang et al. 1990).
Epithelial cell layers form tight diffusion barriers to separate two physiologically neighboring compartments (e.g. organs) from each other mainly via tight junctions. These intercellular barriers control the diffusion of proteins, metabolites or ions and allow the formation and preservation of chemical and electrochemical gradients. Hence, epithelial barrier integrity is
essential to maintain a constant chemical milieu (homeostasis) within an organ.
Physiologically important examples for the significance of intact epithelial barriers are the blood-brain-barrier and the blood-cerebrospinal fluid-barrier (Abbott et al. 2006, Weiss et al.
2009). Both barrier systems separate the brain from the circulating blood stream and thereby ensure the homeostasis in brain tissue, which is necessary for neuronal activity and unaffected signal transfer.
The following paragraphs describe the architecture of epithelial cell-cell and cell-matrix contacts. Furthermore, transport pathways across cellular barriers as well as the most common experimental techniques are discussed.
Epithelial barriers 1.1
1.1.1 Architecture of epithelial cell-cell and cell-substrate contacts
Epithelial cells exhibit various connections between adjacent cells and to the basement membrane (Alberts et al. 2015). Besides almost impermeable intercellular contacts (tight junctions), epithelial cell layers are mechanically stabilized by anchoring junctions to the neighboring cells (adherens junctions, desmosomes) and to the basement membrane (actin-linked cell-matrix junctions, hemidesmosomes). Communicating cell junctions are also found in epithelial tissue (gap junctions). These specialized intercellular channels connect the cytosol of two adjacent cells and allow a rapid signal transfer within the epithelium.
Tight junctions are located close to the apical surface of the plasma membrane. By encircling the apical end of the lateral membrane, these junctions seal the intercellular cleft between two neighboring cells (Shin et al. 2006). Thereby, these connections prevent an uncontrolled paracellular diffusion of molecules across the epithelial cell sheet (barrier function) and the lateral diffusion of membrane components from apical to basolateral or vice versa (fence function). Tight junctions consist of transmembrane proteins and peripheral membrane proteins. Transmembrane proteins (occludin, claudins, tricellulin and junctional adhesion molecules) connect the membranes of adjacent cells and seal the intercellular cleft tightly (Staehelin 1973, Furuse et al. 1993, Furuse et al. 1998, Mandell and Parkos 2005, Krug et al.
2014). Several studies indicate that the combination of claudin subtypes determines the tightness of the barrier since they form size and ion selective channels within the tight junctions of cultured epithelial tissue (Van Itallie and Anderson 2006, Furuse 2010). The
intracellular domain of transmembrane proteins is connected via peripheral membrane (scaffold) proteins like zonula occludens proteins (Stevenson et al. 1986, González-Mariscal et al. 2000, Fanning and Anderson 2009), the cingulin protein (Citi et al. 1988) or rab13 (Zahraoui et al. 1994) to the cytoskeleton. Hence, also the cytoskeletons of adjacent cells are connected via tight junctions. The tight junctional network is located apical to adherens and desmosome junctions on the lateral membrane. The assembly of these three parts is called the junctional complex. Cadherin-mediated adhesion molecules are the major components of adherens junctions. Cadherins are homophilic, Ca2+-dependent transmembrane proteins that connect neighboring cells in a clustered, zipper-like structure (Shapiro et al. 1995, Gumbiner 1996, Alpha et al. 1997). The cytoplasmic part of cadherin proteins is connected to the actin cytoskeleton via diverse mediator proteins like catenins (Niessen 2007). Hence, adherens junctions are linked to the contractile bundles of belt-like actin filaments (Harris and Tepass 2010). Desmosomes are located underneath adherens junctions and are also cadherin-based structures. However, desmosomal cadherins are packed more densely (Al-Amoudi et al.
2007). In contrast to adherens junctions, desmosomes are coupled to intermediate filaments via adaptor proteins and desmoplakin (Gallicano et al. 1998).
Additional anchoring junctions connect the basolateral cell membrane to the basement membrane (Alberts et al. 2015). Chiefly, proteins of the integrin superfamily mediate the attachment of epithelial cells to the extracellular matrix (ECM). Integrin molecules are composed of two non-covalently associated glycoprotein subunits (called α and β).
Heterodimers of different combinations span the cell membrane (Burridge et al. 1988). The extracellular domains of integrins bind directly to specific amino acid sequences in extracellular matrix proteins like fibronectin or laminin (Hynes 2002). Within the cytosol, the β-subunit of an active integrin is connected to actin filaments via several mediator proteins (e.g. talin, Zaidel-Bar et al. 2007). Besides actin-linked cell-matrix junctions (focal contacts), integrin or highly specialized transmembrane proteoglycans can also be connected to intermediate filaments (hemidesmosomes). The β-subunit of integrin α4β6 is thereby linked to intracellular keratin filaments via plectin and BP230 as mediator proteins (Borradori and Sonnenberg 1996, Koster et al. 2003, Litjens et al. 2006).
Unlike tight junctions and anchoring junctions, gap junctions do not contribute to the barrier function or mechanical stabilization of epithelial tissue. Gap junctions are adjustable channel-like structures between two adjacent cells, which allow an electrical and metabolic
coupling. The cytoplasm of an epithelial cell is linked to the neighboring cell by channel-forming transmembrane connexin proteins (Beyer et al. 1990). Six connexin proteins form a hemichannel, called connexon. Two connexons can be assembled to a water filled intercellular channel. Among others, intracellular Ca2+ concentration and pH value regulate the permeability of connexons. These pores, with an inner diameter of 1.4 nm, can be opened or closed immediately to adjust the exchange of water, small inorganic ions and other molecules with a molecular mass below 1000 Da like amino acids, glucose or second messengers (Maeda et al. 2009, Nakagawa et al. 2010).
The complex architecture of cell-cell and cell-matrix contacts within an epithelial cell sheet offers several pathways for transepithelial transport or substance diffusion.
1.1.2 Transport routes across epithelial barriers
Compounds can migrate across an epithelial cell layer either on transcellular pathways across the plasma membrane or on the paracellular route between two neighboring cells (Hillgren et al. 1995, Anderson 2001, Wise 2002, Balimane et al. 2006, Komarova and Malik 2010).
Thereby, the physicochemical properties of a compound (e.g. solubility, pKa, molecular weight, lipophilicity) determine the transport pathway. Several transport ways are illustrated in Fig. 1.1. Passive diffusion of a molecule is driven by a concentration (or electrochemical) gradient and can either take place on the transcellular pathway mainly for hydrophobic molecules (Fig. 1.1, (1)) or on the paracellular route across the tight junctions for small hydrophilic molecules and ions (Fig. 1.1, (4)). Transcellular diffusion can be facilitated by specialized membrane channels or transport proteins (Fig. 1.1, (2)). Transport processes can also be performed against a given gradient. In this case, the process requires energy which is provided by a coupled reaction (Fig. 1.1, (3)). Primary active transport is based on an ATP-consuming step, whereas secondary active transport (symport or antiport) needs energy from an electrochemical potential difference. For large, hydrophilic molecules active transport is enabled by transcytosis (Fig. 1.1, (6)). In some cases, the absorbed molecule serves as metabolic substrate, which leads to a reduced transcellular transport process (Fig. 1.1, (5)).
Reduced absorption is also caused by the presence of efflux transporters either on the apical or basolateral membrane domain (Fig. 1.1, (7)).
Transport processes across intact epithelial cell layers are strictly regulated under physiological conditions in order to maintain organ specific functions and homeostasis.
Alterations within the cellular junctions and the resulting effects on the barrier properties of epithelial tissue can induce pathological conditions. In principle, epithelial barrier integrity is essential to maintain the physiological functions of several organs like lung, kidney, liver and the intestine (Fink and Delude 2005). Epithelial or endothelial dysfunction can contribute to respiratory inflammations (Holgate 2007), edema formation (Abbott et al. 2006) or the development of atherosclerotic lesions (Davignon and Ganz 2004). Hence, the investigation of epithelial or endothelial barrier integrity is of wide scientific interest. In order to gain detailed structural of functional information, scientists utilize in vitro assays. Several technical approaches which are commonly used to characterize the regulation and dynamics of epithelial barrier function are discussed in the following section.
Fig. 1.1: Transport routes across epithelial cell layers: 1 passive transcellular diffusion; 2 facilitated diffusion; 3 primary active or secondary active transport; 4 passive paracellular diffusion; 5 metabolic conversion; 6 receptor- mediated transport/transcytosis; 7 absorption limited by efflux transporters.
Quantification of epithelial barrier function 1.2
In vitro assays are commonly performed to quantify epithelial barrier function. Three main aspects are of interest: (i) The permeability of water through epithelial cells is characterized by its hydraulic permeability coefficient Pf. (ii) The permeability of small inorganic ions gives rise to the transepithelial electrical resistance (TEER). (iii) The third parameter is calculated from the permeability of uncharged (macro)-molecular probes across the epithelial barrier which results in the molecular permeability coefficient PE. The following chapter describes the basic concepts and experimental strategies to characterize epithelial permeability.
1.2.1 Water permeability
Water can pass biological barriers either via simple diffusion across the lipid bilayer or through membrane channels (or pores). In absence of any pressure gradient and under steady-state conditions, Fick’s first and second law give rise to the diffusive water flux Jw
across a membrane and to the diffusional permeability coefficient of water Pd [cm/s]:
= − ∆
= − ∆
(1.1)including the diffusion coefficient of water Dw, the water concentration difference Δcw and the membrane thickness δ. The diffusional water permeability is commonly measured by radiolabeled water flux (3HHO, 2H2O, H218
O) or via NMR-techniques (Solomon 1989, Ye and Verkman 1989, Verkman 1995).
Physiologically important water flux across a biological cell membrane is driven by the differences in hydrostatic pressure (ΔP) and/or osmotic pressure (Δπ). The volume flux Jvolume
across a membrane can be described as:
!"#
= $
%(∆ − '
(∆))
(1.2)where Lp is the hydraulic permeability (in cm·s-1atm-1). The solute reflection coefficient σsdisplays the membrane selectivity for a solute in comparison to water. The coefficient σs
can range between 0 (solute permeability is equal to water permeability) and 1 (no solute permeability). Only if σs = 1, the volume flux across a cell membrane is equal to the water flux.
The term (σsΔπ) is often referred to as effective osmotic pressure difference (Schafer et al.
1978, Curry 1985, Maurel 1997, Baumgarten and Feher 2001, Wills et al. 2012, Hamilton and Devor 2016). The proportionality constant Lp (hydraulic permeability, hydraulic conductivity or filtration coefficient) is relating volume flux to hydrostatic pressure as well as to osmotic pressure.
A quantitative description of transmembrane water transport requires the quantification of the hydraulic permeability coefficient Lp and the ratio of osmotic permeability coefficient Pf to diffusional water permeability coefficient Pd (Verkman et al. 1996). Equation 1.2 can be used to measure the hydraulic permeability Lp in absence of a hydrostatic pressure difference (ΔP = 0). Therefore, an osmotic pressure difference (Δπ) is applied by adding an impermeable solute (σs = 1) to one side of the epithelial cell sheet. The change in cell water volume over time (dVcell/dt) can be used to calculate Lp in response to the imposed osmotic pressure difference, with Amem as the membrane area (Kleinhans 1998).
$
%= d4
5#dt 1
7
"#"('
(∆))
(1.3)Several methods are common to study cell volume changes of adherently growing cells, e.g.
via light scattering techniques, total internal reflection or confocal microscopy (Verkman
2000). In addition, cell volume changes can be detected with impedance-based techniques (Kimelberg et al. 1992, Hua and Pennell 2009) or via surface plasmon resonance spectroscopy (Robelek and Wegener 2010). The hydraulic permeability Lp can be converted into the osmotic water permeability coefficient Pf [cm/s] according to:
8
= $
%9:
4
(1.4)with Vw as the partial molar volume of water, R as the gas constant and T as the absolute temperature. The ratio of osmotic to diffusional water permeability is often used as an indicator for a predominantly diffusional or non-diffusional water transport. For a purely diffusional process the ratio Pf/Pd equals unity. In biological membranes, especially in epithelial tissue, high Pf/Pd ratios are reported, giving evidence to the presence of water transporting proteins called AQPs (aquaporins, Preston and Agre 1991, Murata et al. 2000, Verkman and Mitra 2000). Techniques to quantify the diffusional and osmotic permeability coefficients are experimentally very challenging and error prone (e.g. due to unstirred water layers, Korjamo et al. 2009, Whittembury and Reuss 1992, Günzel et al. 2010). Additionally, a differentiation between transcellular, aquaporin-mediated and paracellular water flux across the tight junctional complex is only indirectly accessible (Carpi-Medina and Whittembury 1988, Rosenthal et al. 2010). Blocking the transcellular pathway by inhibition of aquaporin channels with mercury, the only potent AQP blocker, is often not an option since its effective concentration causes cytotoxic effects in many cells and tissues (Knepper 1994). On the other hand, blocking the paracellular pathway with inhibitors such as protamine was unsuccessful due to possible transcellular side effects (Poler and Reuss 1987, Loeschke and Bentzel 1994). Hence, determination of epithelial permeability to ionic species and uncharged molecular probes became the methods of choice to quantify epithelial barrier function.
1.2.2 Molecular permeability
Solute flux across cellular barriers is often studied via simple permeation assays. For these widely used and well-established assays, the cells are cultured on highly permeable filter supports which are needed for mechanical support. The commercially available filter membranes differ in membrane material as well as pore size and density. To avoid any additional restrictive effect of the membrane, pore size and density should be at a maximum.
Cell-covered filter inserts are placed into a standard two-chamber set-up. Thereby, the
epithelial cell sheet acts as diffusion barrier between both fluid filled compartments. The set-up provides independent access to the apical cell surface as well as to the basolateral side and, hence, mimics the physiological conditions of an epithelium. To analyze the barrier function of epithelial cells, a tracer compound is added to one of both compartments (donor side). If the tracer molecule can pass the cellular barrier, its accumulation is detected over time in the receiver compartment. In order to prevent an additional diffusive contribution due to the presence of unstirred water layers (Youdim et al. 2003) the assay should be performed under mild agitation. Furthermore, a strict control of temperature and buffer pH value is necessary. The time-dependent increase in tracer concentration is used to calculate the molecular permeability coefficient PE (denoted in cm/s). A derivation of the equation for PE as well as a detailed calculation protocol is given within the theoretical section (chapter 3.2). The molecular tracer compound should meet several requirements. Highly water-soluble compounds are used if transcellular diffusion via the plasma membrane has to be excluded.
Additionally, information about compound-specific transcellular diffusion pathways via cellular transport systems (active transport or facilitated diffusion) is needed. Typical tracer molecules for these standard in vitro assays are sucrose, mannitol, inulin or high molecular weight probes like dextrans or polyethylene glycols (Sanders et al. 1995, Ghandehari et al. 1997).
These tracer molecules can pass epithelial cell layers only by the paracellular pathway.
Depending on the size of the compound, diffusion across the junctional complex is mediated by two different pathways (Spring 1998, Cohen et al. 1999, Watson et al. 2001, Neuhaus et al. 2006, Van Itallie et al. 2008, Krug et al. 2009a). Diffusion across the tight junctions is mainly mediated by a high number of small pores (diameter ~ 8 Å) located at the bicellular junctions. Larger pores (diameter ~ 100 Å, Staehelin 1973) are supposed to be located at the contact zone of three adjacent cells (tricellular tube, Ikenouchi et al. 2005) and enable the paracellular diffusion of macromolecules (> 20 kDa). Since the number of tricellular tubes is relatively low, their contribution to the overall paracellular diffusion capacity is of around 1 % (Krug et al. 2009a).
The detection of a molecular probe in the receiver compartment depends on the labeling type.
Most often, the tracer compound is linked to a small fluorescent dye (e.g. fluorescein isothiocyanate, FITC) or the molecule is radiolabeled at a specific position. Coupled detection techniques like liquid chromatography are used for unlabeled compounds. At preset time points after addition of the tracer compound, samples of the fluid in the receiver compartment are analyzed. Besides this time and cost consuming step, the coupling of a fluorescent label
can alter the physicochemical properties of a tracer compound significantly. In addition, real-time information of the junctional constitution cannot be provided using a static two-chamber set-up, since the accumulation of the tracer in the receiver compartment usually takes time (Matter and Balda 2003). These permeation assays are performed extensively to monitor and quantify cellular barrier function, but the specific permeability coefficient is an integrated parameter which reflects the permeability of the entire cellular surface area. Small defects within the confluent cell layer (e.g. due to apoptosis) might cause a short-cut to tracer flux and thereby lead to a misinterpretation of cellular barrier function. A lateral resolution of tracer permeability can illustrate the heterogeneities in paracellular barrier function (Sill et al.
1992). Phelps and DePaola used agarose gels instead of a liquid receiver compartment in order to visualize spatial variations in transendothelial macromolecular transport (2000). The labeled tracer compound diffuses across the cell layer directly into the gel underneath the filter membrane. The agarose gel hinders the tracer diffusion and thereby enables a spatial mapping of the macromolecular permeability at a given time point. However, the lateral resolution remained low with this approach. It could be optimized by the use of affinity interactions. For this purpose, the tracer compound is additionally conjugated to e.g. avidin and the cells are cultured on a biotinylated adhesive matrix (gelatin or collagen networks) instead of using permeable membranes (Dubrovskyi et al. 2013). An elegant method to enhance the lateral resolution below cellular dimensions was published by Michaelis et al. in 2012. Instead of using permeable filter membranes as mechanical support, the authors cultured epithelial cells directly on macroporous substrates. The small pores in the substrate are densely packed and only open to the side which is facing the cell layer. A penetrating fluorescent tracer compound accumulates in these femtoliter cavities at the site of permeation and can be visualized by using an upright confocal laser scanning microscope. This set-up can additionally be used to image local defect areas in the cell layer and to discriminate between trans- and paracellular diffusion. Furthermore, Michaelis and colleagues combined the lateral permeability assay with an impedimetric monitoring of the cell layer. But not only fluorescent tracer molecules can be used to image spatially resolved permeation profiles. The diffusion of redox-active compounds (e.g. ferrocene methanol or ruthenium hexamine chloride) across an epithelium has been visualized by means of scanning electrochemical microscopy (SECM) in a non-invasive and time-resolved way. Passive transport of these redox mediators was recorded by using ultramicroelectrodes with sub-cellular resolution (Bergner et al. 2012).
1.2.3 Ionic permeability
The most common measure of epithelial permeability to small inorganic ions is the transepithelial electrical resistance (TEER). The TEER mainly expresses the permeability to Na+, Cl-, K+ and HCO3- ions for a non-selective epithelium (Günzel et al. 2010). The electrical resistance of an epithelium is often measured routinely during in vitro cell culture periods to reflect the state of confluency. For this purpose, the cells are again cultured on permeable filter supports as described previously. Two sets of electrodes are placed into both compartments. One set of electrodes is needed to apply a direct current (DC) across the cell layer. The resulting voltage drop is detected with the second electrode pair. The described arrangement is referred to as ‘chopstick’-electrode set-up. According to Ohm’s law, the resistance can be calculated as the ratio of voltage to current. However, the resistance of a cell-free filter insert (including the buffer resistivity / bulk resistance) must be determined separately and subtracted. Denoted in Ωcm2, TEER is an integral and area-specific measure for ionic permeability of the entire cell layer. Due to its integral nature, TEER is prone to misinterpretation in analogy to the permeability coefficient PE mentioned above. Short-cuts to current flow result in a highly decreased resistance value. Since the permeable inserts are often not optically transparent, the absence of single cells within an otherwise confluent cell layer is difficult to detect in advance. Additionally, TEER determined with these handheld devices is strongly dependent on the position of the probing electrodes (Jovov et al. 1991).
Reliable results can be obtained by using Ussing chambers, where the four electrodes are fixed in position (Ussing 1949, Kottra et al. 1989). Modern devices no longer work under DC conditions. In order to avoid polarization effects to the electrodes or the cell layer, low-frequency AC (alternating current) conditions are used (± 10 µA, 12.5 Hz).
However, the content of information remains low by using DC or ‘near DC’ conditions. The transepithelial electrical resistance can be calculated via reciprocal addition of transcellular (due to the resistance of open ion channels) and paracellular resistance (Powell 1981). Most state-of-the-art approaches enable a more detailed analysis of the epithelial cell layer by applying an alternating current or voltage. The cell-covered filter insert is therefore placed in between two electrodes which are fixed in position to guarantee homogeneous electric field conditions (Wegener et al. 2004). Instead of analyzing the signal at a single fixed frequency, impedance spectroscopy (IS, chapter 3.1) can be carried out in an automated manner and over a broad frequency range (typically 1 – 106 Hz). The amplitude and the phase of an AC
current are measured while the frequency of the applied voltage is swept. The resulting total AC impedance contains information about the transepithelial electrical resistance.
Additionally, IS allows a reliable determination of both, the TEER and the bulk resistance in one experiment. Information about the cell membrane capacitance is also available as the dielectric core of the lipid bilayer acts as electrical capacitor. All three parameters (TEER, bulk resistance, membrane capacitance) can be extracted at any time point from the complex impedance spectra by means of equivalent circuit modeling. However, this approach does not allow a differentiation between trans- and paracellular resistance. Krug et al. published a technique based on impedance spectroscopy, that allows to differentiate between paracellular and transcellular ion transport pathways (2009). Krug and colleagues combined IS and flux measurements of paracellular marker compounds. Provided that the marker is exclusively transported across the cell layer on the paracellular pathway and that the resistance of this pathway can be modulated without affecting transcellular resistance, the contribution of the transcellular resistance to the overall TEER can be calculated. As trans- and paracellular pathways get analyzed, the authors entitled this technique as two-path impedance spectroscopy (2PI, Günzel et al. 2010, Günzel et al. 2012). Even if the integral transepithelial electrical resistance can be broken down into its trans- and paracellular contributions, paracellular resistance does not reflect the resistance due to the tight junctional complex only.
The paracellular resistance determined via impedance spectroscopy still includes the lateral intercellular resistance and the resistive contribution due to the cell-substrate adhesion zone (Lo et al. 1999). The latter can be quantified by another impedance-based technique referred to as electric cell-substrate impedance sensing (ECIS). Instead of using porous filter membranes, the cells are directly cultured on the measurement electrodes. The lack of a basolateral compartment excludes the application for transport studies. However, the ECIS technique offers the possibility to determine the resistance contribution arising from the cell-substrate contacts (Giaever and Keese 1984, Giaever and Keese 1991, Giaever and Keese 1993). Both techniques, impedance spectroscopy for filter grown cells and the ECIS method are discussed in detail in the theoretical section (chapter 3.1.3 and 3.1.4). Electrical resistance measurements are valuable tools to study and quantify cellular barrier properties.
These non-invasive techniques can be used to monitor epithelial or endothelial barrier function in an automated set-up. However, a combination of at least two of the above mentioned techniques is required in order to determine all cell-specific parameters (Tab. 1.1).
Neither impedance recordings of filter grown cells nor ECIS measurements take account for
local heterogeneities in cellular barrier function. In 1997 Gitter et al. used impedance measurements in standard Ussing chambers and combined the technique with mobile-scanning microelectrodes to image local differences in transepithelial resistance (Gitter et al. 1997, Gitter et al. 2001). The microelectrodes are adjusted directly above the cell surface. A heterogeneous clamp current is applied across the epithelium while the microelectrodes are detecting the local and confined potential. These conductance or voltage scanning techniques provide distinct local conductivity data. Conductance scanning can be used to detect local defects within the cell layer and the lateral resolution can be enhanced such that differentiation between para- and transcellular resistance becomes possible.
Besides the resistance measurements summarized above, various other methods are performed to determine epithelial ion permeabilities. Among other techniques, ion flux measurements are used to study the permeability of radioactive isotopes (Bijvelds et al. 1997) similar to the molecular permeability measurements described above (chapter 1.2.2). Dilution potential or bionic potential experiments can also be performed to determine the relative permeability of chloride ions to sodium ions or other monovalent cations (Sugiharto et al.
2008, Günzel et al. 2010). In order to discriminate between trans- and paracellular ion movement, permeability measurements are often performed at low temperature. Active membrane-mediated transport mechanisms are temperature-dependent, whereas passive paracellular diffusion is much less affected. Furthermore, the paracellular permeability of ions should be independent of the direction, so that diffusion studies can be carried out in both directions (apical ↔ basolateral) to provide further insights.
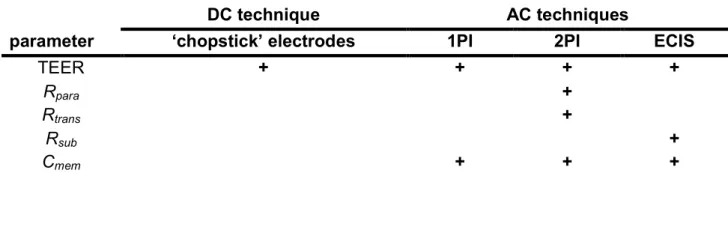
Tab. 1.1: Resistance measurements and the accessible cell-related parameter (DC: direct current, AC:
alternating current, 1PI: conventional impedance spectroscopy IS, 2PI: two-path impedance spectroscopy, ECIS:
electric cell-substrate impedance sensing, TEER: transepithelial electrical resistance, Rpara: paracellular resistance, Rtrans: transcellular resistance, Rsub: resistance contribution due to cell-substrate adhesion, Cmem: membrane capacitance).
DC technique AC techniques
parameter ‘chopstick’ electrodes 1PI 2PI ECIS
TEER + + + +
Rpara +
Rtrans +
Rsub +
Cmem + + +
2 Objectives
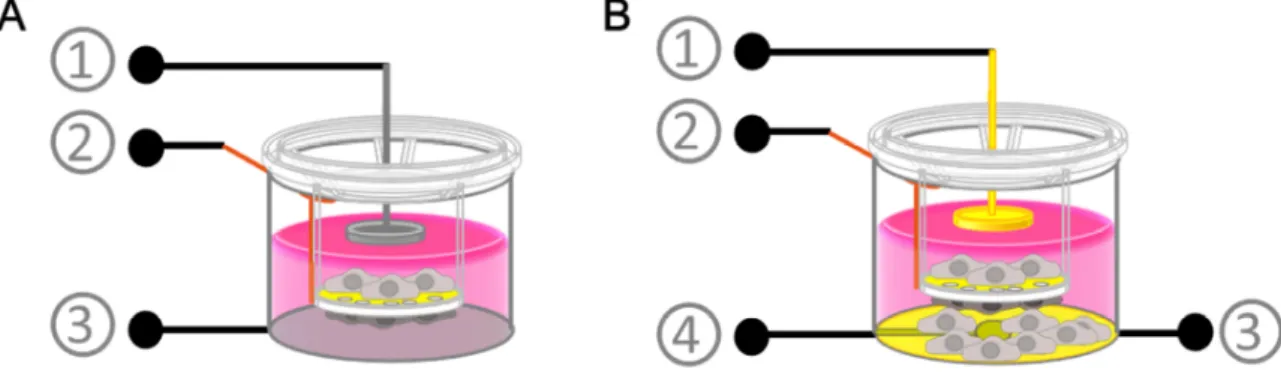
Epithelial or endothelial barrier dysfunction is significantly involved in various diseases (Fink and Delude 2005, Holgate 2007, Weiss et al. 2009, Komarova and Malik 2010). Great efforts have been made to investigate the dynamics and alterations of epithelial barriers under physiological and pathological conditions. In vitro models are designed to mimic in vivo like conditions and to study changes in response to certain stimuli. The transepithelial or -endothelial electrical resistance (TEER) serves as a measure for barrier function of filter grown cell layers. TEER can be recorded routinely in a non-invasive way under physiological conditions. However, TEER is not only determined for single cell layers but also for co-culture systems where cells are cultured on either side of a porous filter device. When physiologically neighboring cell types are probed, the measured overall transcellular resistance is influenced by both cell layers to an unknown extend. It was the aim of this thesis to develop a device that can be used to monitor the integrated overall transcellular resistance of co-cultured cell layers together with the individual monolayer contributions. The new device should fit into the standard transfilter measurement systems and it should be compatible with other impedance-based assay formats like the ECIS system. Furthermore, the new device should be evaluated in studies regarding cell attachment and spreading as well as barrier disintegration.
Due to the non-invasive nature of TEER measurements and their outstanding temporal resolution, the transcellular resistance is often favored over permeability assays to ensure barrier integrity. In vitro permeability assays are highly relevant to study the permeation of certain endogenous compounds or novel drug candidates across intact interfacial tissues.
The permeation of the target compound across the barrier is commonly followed via a fluorescence or radio-labeling. So far, the compound detection is generally performed discontinuously and both assay types, TEER measurement and permeability assay, are executed consecutively. Thus, the second project in this thesis addressed an impedance-based device for a combined TEER and permeation assay. A simultaneous and automated permeability monitoring should be enabled by using a redox active tracer compound which provides a concentration-dependent impedance readout. After having confirmed no cytotoxic or barrier altering effects of the redox tracer, the device should be used to determine the compound and cell specific permeability coefficients. Additionally, several sensing electrodes at different sites underneath the filter should enable a spatially
resolved permeability determination to detect existing barrier heterogeneities within the confluent cell layer.
Most standardized in vitro permeability assays are based on labeled tracer molecule. Since the technical effort is a lot smaller, fluorescent probes are often preferred over radiolabeled marker compounds. However, the covalent coupling of fluorophores to the tracer compound consequently alters the physicochemical properties of the tracer. Thus, in vitro results must be interpreted with caution regarding its transfer to in vivo like conditions. The situation is even more pronounced when the permeation of endogenous molecules, like neurotransmitters (like dopamine, histamine or glutamate) or inflammatory mediators, across the blood brain barrier are under investigation (Abbott 2000, Abbott et al. 2006). Until now, the detection of unlabeled compounds is only possible by using a subsequent detection technique like liquid chromatography.
Hence, the aim of the third project within this thesis was to overcome this limitation. Integrated into the receiver compartment, a whole-cell impedance based biosensor should enable a fast and continuous detection of unlabeled, endogenous compounds (ligand) of interest via a specific ligand-receptor-interaction in the sensory cells. The set-up should be evaluated by proof-of-concept studies. Furthermore, the permeability of a specific ligand across an intact epithelial barrier as returned by the response of the biosensor-based assay should be compared to standard permeability measurements using isotopic tracer compounds.
3 Theoretical background
The theoretical section provides basic information about all methods and assay techniques important for this thesis. The chapter is mainly focused on the field of impedance spectroscopy (IS). This method is a highly versatile tool to investigate electric properties of a variety of solid materials and electrochemical systems (Macdonald 1992, Lasia 2002). The complex impedance Z of a system depends on the frequency of a sinusoidal alternating current signal which is used for excitation and provides detailed information about resistive and capacitive components of the studied system. Since applying small amplitudes of exciting alternating current (AC) or voltage enables a damage-free investigation, IS became a very appropriate method to analyze biological samples in a non-invasive way.
Besides this electrochemical method, the second part of this chapter describes a special assay technique which is used to quantify endothelial or epithelial barrier function. In addition to the permeability of water or small inorganic ions, the permeability of molecular probes across a cell layer is a widely studied parameter to describe barrier function efficiency (Wegener and Seebach 2014). Permeability assays are performed to determine the specific permeability coefficient PE of a tracer molecule. The theoretical section about permeability assays addresses the fundamental equations and boundary conditions for the calculation of PE.
Impedance spectroscopy 3.1
According to Ohm’s law, the resistance R of an electric system in a DC (direct current) circuit is defined as the ratio of applied voltage U to resulting current I.
9 = ?
@
(3.1)However, IS applies a sinusoidal AC voltage as excitation signal. Thus, the AC voltage U(t) is described as a function of frequency w and time t:
?(B) = ?
Csin(FB)
(3.2)where w = 2)H is the angular frequency and H is the AC frequency. The resulting current I(t)
has a sinusoidal form of the same frequency as the exciting voltage with the amplitude I0and is shifted in phase ϕ if the studied system is not perfectly resistive. I(t) can be mathematically expressed as:
@(B) = @ sin(FB − I)
(3.3)Euler’s formula is used to express AC voltage and current as complex quantities:
?(B) = ?
CJ
K( L) (3.4)and
@(B) = @
CJ
K( LMN) (3.5)where O = √−1.
According to Ohm’s law, the complex impedance Z of an AC circuit is given by the ratio of complex voltage (eq. 3.4) to complex current (eq. 3.5):
Q = ?(B)
@(B) = ?
CJ
K( L)@
CJ
K( LMN)= ?
C@
CJ
KN= |Q| J
KN(3.6)
In the complex Gaussian plane (imaginary part plotted as a function of the real part) the complex impedance is displayed as a vector (Fig. 3.1). The length of this vector corresponds to the impedance magnitude |Z|. The angle between |Z| and the real axis determines the phase shift I between voltage and current. The real part R of the complex impedance Z arises from current which is in-phase with the applied alternating voltage. Besides the resistance R, capacitive and inductive impedance contributions induce a phase shift between voltage and current and are represented by the imaginary part reactance X.
Using Cartesian coordinates, Z can be expressed as the sum of its real and imaginary part:
Q = 9J(Q) + O @U(Q) = 9 + O V = |Q| cos I + O |Q| sin I
(3.7)Resistance R and reactance X can be converted into the polar coordinates impedance magnitude |Z| and phase angle I:
X
Q
X=
Y9
2+ V
2 (3.8)and
I = arctan V
9
(3.9)Fig. 3.1: Representation of the impedance Z in the complex Gaussian plane. The x-axis is the real part of the complex impedance Re(Z), whereas the ordinate displays the imaginary part Im(Z). Z can be described in polar coordinates by the vector length |Z| (impedance magnitude) and the angle I (phase shift between voltage and current).
3.1.1 Equivalent circuit modeling
In order to identify the impedance contribution of different electrochemical components in a given system, electric equivalent circuits with a similar frequency-dependent response are constructed. Therefore, several electric elements are commonly arranged to a network.
Besides ideal electric elements (resistor R, capacitor C and inductor L), non-ideal empirical elements (e.g. constant phase element, CPE) can be introduced (Tab. 3.1), since ideal elements are not always suited for the description of electrochemical systems. Empirical circuit elements are used to characterize systems where charge transporting ions show a different behavior in comparison to electrons in common electric elements (Lasia 2002). The CPE represents the non-ideal capacitive behavior of solid electrodes which are in contact to an electrolyte. While the observed phase angle is constant, the double-layer capacitance of the electrodes is frequency-dependent. The CPE can be described by the two parameters ACPE and nCPE. With nCPE = 1, the element behaves like an ideal capacitor (ACPE = C). When nCPE equals a value of 0, the CPE acts as a pure resistor (ACPE-1
= R). Any value for nCPE
between 0 and 1 leads to resistive and capacitive properties of this empirical circuit element.
The frequency-dependence of the electrodes’ capacitance is often explained as a consequence of surface roughness (inhomogeneities) and ion adsorption (Raistrick and
Macdonald 2005). Thus, CPE is used to describe the impedance contribution of an electrode-electrolyte interface, with its’ double layer exhibiting non-ideal capacitive behavior (Pajkossy 1994). °
Tab. 3.1: Impedance contribution and phase shift of equivalent circuit elements.
equivalent circuit element parameter impedance Z phase shift I
Ohmic resistor R R 0
capacitor C (iwC)-1 - π/2
inductor L iwL + π/2
constant phase element CPE A, n (0<n<1) (iw)-nA-1 -nπ/2
The parameters R, L, C and CPE are sufficient for the description of an electrochemical system. However, in the presence of redox species in solution, an electrochemical process involving the transfer of electrons across the electrode interface may occur. A detailed discussion for an electric circuit containing a faradaic reaction is presented in chapter 3.1.5.
Complex circuit models must be correctly simplified in order to avoid an over-parameterized (redundant) system. Since the same data may be exactly described by different equivalent circuit models, additional information is often necessary to decide which circuit fits best to the electrochemical system. Once an adequate equivalent circuit is constructed, the corresponding transfer function can be calculated according to Ohm’s and Kirchhoff’s laws.
The transfer function is the mathematical expression of the equivalent circuit. To identify the impedance contribution of the individual elements involved in a system under study, the calculated impedance of the equivalent circuit is compared to the experimental data (chapter 4.3.3).
3.1.2 Data presentation
There are two ways to present impedance data in a graphical manner. Complex plane plots (Argand diagrams or Nyquist plots) visualize impedance data by plotting the imaginary part of the impedance against the real part. Since the imaginary part is usually negative, - Im(Z) is plotted versus Re(Z). However, these complex plane plots do not contain information about the frequency domain. Therefore, some frequencies are often added to better visualize the frequency domain. Bode plots represent the second graphical impedance plot. The logarithm of the impedance magnitude (log |Z|) and the phase angle (I) are plotted against the logarithm of the frequency (log f). The following paragraph demonstrates the interpretation of
a Bode plot for a simple electric circuit.
The equivalent circuit describing an electrode, which is in contact to an electrolyte, is shown in Fig. 3.2. Herein, the electrical circuit is represented by a serial combination of a resistor (Rbulk, electrolyte resistance) and a constant phase element (CPE).
The CPE combines the sum of the capacitance of the working electrode (CPEWE) and the counter electrode (CPECE) when the impedance is measured in a two-electrode-cell.
^ _ 1
`a`BJU= 1 ^ _
b_+ 1 ^ _
^_ (3.10)If only the impedance of the working electrode is of interest, the surface area of the counter electrode must be increased so that the second term in equation 3.10 can be neglected.
According to Ohm’s and Kirchhoff’s laws (chapter 3.1.1), the transfer function of the Rbulk-CPE circuit is:
Q (F) = 9
c! d+ 1
(OF)
e7
(3.11)Fig. 3.2: Equivalent circuit and calculated Bode plot for an Rbulk-CPE connection in series. The Bode plot includes information about the impedance magnitude |Z| and the phase angle I. Parameters: Rbulk = 100 Ω, ACPE = 30 µFs(n-1)/cm2, nCPE = 0.95.
The Bode plot in Fig. 3.2 clearly shows that the Ohmic resistance of the electrolyte dominates the impedance in the high frequency range (horizontal line). This frequency-independent behavior is represented by a horizontal line of the impedance magnitude running parallel to the x-axis in the Bode plot. The phase shift in this frequency range is 0° (horizontal line). With decreasing frequency, the capacitance characteristics of the constant phase element influence the impedance signal progressively. The impedance magnitude increases while the phase angle decreases from 0° to a minimum of around - 85° when nCPE is 0.95.
3.1.3 Transfilter measurements
Impedance spectroscopy is applied heavily to investigate biological systems like mammalian cell layers or even tissue. Therefore, permeable filter supports are often used as culture substrates for endothelial or epithelial cells to mimic the physiological situation of interfacial tissues between two compartments. The cell layer resistance is measured by placing two measurement electrodes on either side of the cell-covered filter membrane. Resistance measurements are performed by two slightly different techniques, regarding the electrode arrangement and measurement conditions. As afore mentioned (chapter 1.2.3), chop-stick electrodes can be placed on each side of the filter membrane. With this set-up the measured cell layer resistance is determined at a specific frequency and the result is strongly dependent on the electrode positioning. An inherent inhomogenous electric field across the cell layer often leads to an overestimation of the measured resistance (Jovov et al. 1991). In order to increase accuracy, information content and throughput of transfilter measurements, a device published by Wegener et al. (2004) is often preferred. Instead of placing the cell-covered filter membrane in between error-prone chop-stick electrodes, two disk shaped stainless steel electrodes are used. One of these electrodes is integrated in the bottom of the measurement chamber underneath the cell layer, whereas the second stamp-like electrode is dipping into the upper filter compartment. The filter support is fixed in its position. Since the cell layer is sandwiched between these two disk electrodes, a homogeneous electric field across the entire surface of the cell layer is guaranteed. Transcellular resistance measurements can be performed accurately and automated in a standard cell culture incubator. Moreover, the device records the impedance not at a single fixed frequency but over a broad frequency range. The cell layer resistance Rcl (or transepithelial /-endothelial electrical resistance, TEER) is then extracted from the impedance spectra by means of equivalent circuit modelling (chapter 3.1.1).
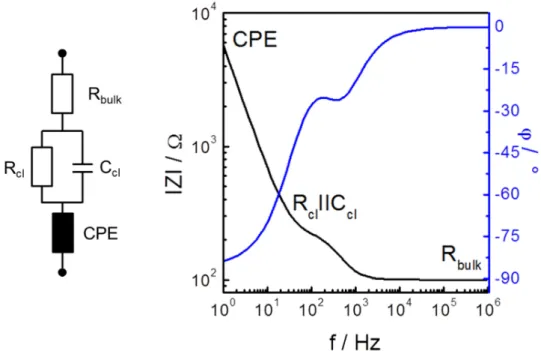
To describe the dielectric properties of the transfilter measurement set-up, the equivalent electrical circuit shown in Fig. 3.2 needs to be expanded by a parallel combination of a resistor and a capacitor (Rcl||Ccl), expressing the electrical properties of the cell layer. Herein, Rcl is equivalent to the transcellular resistance (TEER). The parameter Ccl describes the dielectric properties of the cellular plasma membrane and Ccl includes the serial combination of the apical and basolateral membrane capacitance. The transfer function of this Rbulk-(Rcl||Ccl)-CPE circuit according to Wegener et al. (2000) is presented in Fig. 3.3 and can be expressed as:
Q (F) = 9
c! d+ 1 9 1
5+ OF^
5+ 1
(OF)
e7
(3.12)As described in chapter 3.1.2 (Fig. 3.2), the impedance magnitude is again dominated by the Ohmic resistance of the electrolyte Rbulk in the high frequency range (phase angle = 0°). The electrode-electrolyte interface for both electrodes is represented by the empirical impedance element CPE, which dominates the impedance magnitude in the low frequency range (phase angle - 85° for nCPE = 0.95). In the mid frequency range, impedance magnitude and phase
Fig. 3.3: Equivalent circuit and calculated Bode plot for an Rbulk-(Rcl||Ccl)-CPE circuit. The impedance contribution of the cell layer is affecting |Z| and I in the mid frequency range. Parameters: Rbulk = 100 Ω, Rcl = 100 Ωcm2, Ccl = 5 µF/cm2, ACPE = 30 µFs(n-1)/cm2, nCPE = 0.95.
shift are influenced by the impedance contribution of the cell layer, resulting in a plateau region. The height of this plateau depends on the resistance of the cell layer, whereas the width is influenced by its capacitance. In this particular frequency range, the current is forced to flow through the pores of the filter support, into the narrow gap between filter and basolateral cell membrane and around the cell bodies in between two neighboring cells to escape in the bulk electrolyte. For this paracellular pathway, cell-cell-contacts display a restriction (Rcl, TEER).
Fitting this equivalent circuit to the recorded experimental data offers the possibility to determine two specific, but integrated, cell related parameters. The parameter Rcl quantifies the cellular barrier function and is usually calculated with respect to the cell covered area (expressed in Ωcm2). Ccl represents the cell layer capacitance for a given area as the reciprocal of the sum of the reciprocals of basolateral and apical membrane capacitance (denoted in µF/cm2). However, the calculated resistance (TEER or Rcl) reflects the resistance of the paracellular pathway only for moderately tight epithelial or -endothelial cell layers. In case extremely tight or very leaky cell layers are probed, the calculated TEER is affected by other resistive contributions. When impedance measurements on very tight cell layers are performed, a distribution of current flow can occur. If the resistance of the paracellular pathway is similar to the cell membrane resistance, the current can either follow the paracellular pathway across the cell junctions or the transcellular pathway through the cell membranes. Both contributions are then included in the measured resistance. With the parallel connection of both resistance elements, a differentiation is not possible without further experiments (e.g. two-path impedance spectroscopy, chapter 1.2.3). Lo et al. mentioned a second resistive parameter which must be considered when TEER measurements are discussed (1999). The width of the narrow cleft between the filter surface and the lower cell membrane is only 50 to 200 nm. The length of this cleft depends on the filter porosity (pore diameter, pore density) and on the specific cell diameter. Paracellular current has to flow from the pores underneath the cell layer through the cell-substrate adhesion region before it reaches the cell periphery. This resistive contribution (Rsub) due to the cell-substrate adhesion zone increases with the cellular diameter and the reduction of the cleft height. Since this additional resistive element is arranged in series to the junctional resistance, an independent determination of both parameters is not possible. However, Lo et al. modeled the impact of this resistance contribution. Depending on the filter insert porosity, they introduced two
models which can be used to estimate the (maximum or minimum) contribution of this resistive element to the measured transcellular resistance. Model 1 uses the assumption, that there is only one large pore underneath the center of a cell. The pore size is calculated as the sum of all pores which are covered by a single cell. The resistance contribution arising from the cell adhesion zone can be calculated as a function of cell-substrate distance (dsub), cell radius (rc) as well as pore radius (rpore) and solution resistivity (ρsub):
9
(!c= πg
5hi
(!c2)j
(!cln k g
5g
% l#m
(3.13)Since a cell covers in fact more than one pore located underneath the center of the cell, the calculated resistance will be clearly overestimated. Hence, the authors introduced a second model, which can be used to estimate the minimal resistive effect. Model 2 assumes that the resistance of the pores of the filter membrane is evenly distributed underneath the cells. The calculation is based on the ECIS model (chapter 3.1.4). Another model to calculate the seal resistance between cell and substrate was introduced by Weis and Fromherz in 1997. The authors described a calculation model for the junctional resistance of a neuron transistor which is based on the assumption that the contact between cell and the solid substrate is concentrated in a ring of a defined radius (point-contact model). The radius of this contact ring is the averaged radius obtained for all possible cell-substrate contacts. The point-contact model was adopted form Wegener et al. (1999) to estimate Rsub underneath a cell according to:
9
(!c≈ πg
5hi
(!c5)j
(!c (3.14)with the specific resistivity of the electrolyte in the subcellular cleft ρsub, the cell-substrate distance dsub, and the cell radius rc.
This model can be adapted to the situation of cells cultured on permeable membranes (adapted point-contact model). Therefore, the area of all filter membrane pores is addeded and this area is evenly distributed around the junctional contact ring. Hence, the averaged radius of the contact ring is enlarged by the area of the filter pores.
The value of the cell-substrate resistance, according to the various models, depends on the cell type and the filter properties and can only serve as a rough estimation. The resistance contribution of the adhesion zone might be neglected if the paracellular resistance of (moderately) tight cell layers is investigated. But it influences the integrated parameter Rcl for