Expanding the Scope of Impedance Analysis of Epithelial Barrier Function:
Novel Assays and Devices
DISSERTATION
zur Erlangung des Doktorgrades der Naturwissenschaften (Dr. rer. nat.) der Fakultät für Chemie und Pharmazie
der Universität Regensburg
vorgelegt von Florian Urban aus Waldmünchen, 2019
Diese Doktorarbeit entstand in der Zeit von März 2016 bis September 2019 am Institut für Analytische Chemie, Chemo- und Biosensorik der Fakultät Chemie und Pharmazie der Universität Regensburg.
Die Arbeit wurde angeleitet von Prof. Dr. Joachim Wegener.
Promotionsgesuch eingereicht am: 12.09.2019 Kolloquiumstermin:
Prüfungsausschuss:
Vorsitzender:
Erstgutachter: Prof. Dr. Joachim Wegener
Zweitgutachterin: PD Dr. Miriam Breunig
Drittprüferin: Prof. Dr. Antje Bäumner
Für meine Familie und Carina
I
1 Introduction ... 1
1.1 Epithelial barriers ... 1
1.1.1 Classification of cell-cell and cell-matrix contacts ... 2
1.1.2 Pathways of transepithelial transport ... 5
1.1.3 Quantification of epithelial barrier function ... 6
1.1.3.1 Ionic permeability ... 7
1.1.3.2 Molecular permeability ... 11
1.1.3.3 Water permeability ... 14
1.1.4 Diseases associated with dysfunctional epithelial barrier function ... 17
1.2 Aquaporins (AQPs) ... 18
1.2.1 Physiological relevance of water-selective channels ... 20
1.2.2 Molecular architecture of aquaporins ... 20
1.2.3 Inhibitors of aquaporins ... 22
1.2.4 Diseases associated with dysfunction of aquaporins ... 23
2 Objectives ... 24
3 Theoretical background ... 26
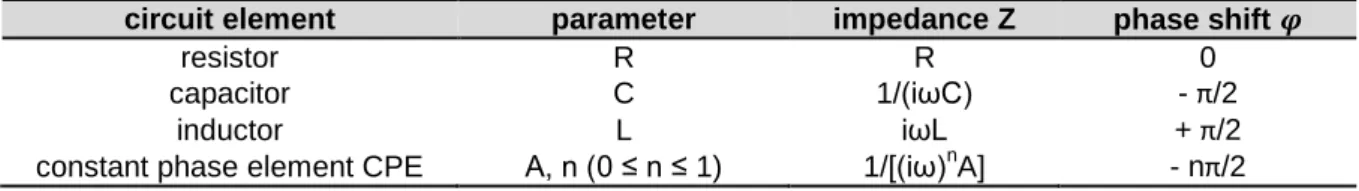
3.1 Electrochemical impedance spectroscopy (EIS) ... 26
3.1.1 Data presentation and analysis ... 29
3.1.2 TER-measurements ... 31
3.1.3 Impedance spectroscopy in presence of a redox-active species ... 37
3.1.4 Electric cell-substrate impedance sensing (ECIS) ... 39
3.2 Transepithelial permeability assays ... 43
3.2.1 Molecular permeability coefficient P
E... 44
3.2.2 Osmotic water permeability coefficient P
OS... 47
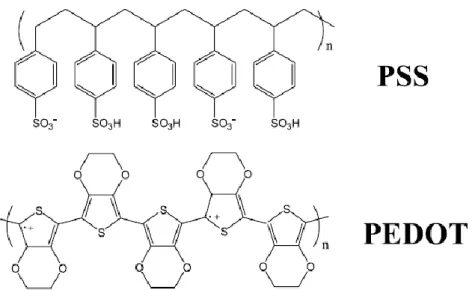
3.3 Poly-3,4-ethylenedioxythiophene (PEDOT) as electrode material for impedance-based analysis of epithelial barrier function ... 51
3.3.1 General and electrical properties of PEDOT ... 52
II
3.3.2 Conductivity enhancement by post-treatments... 54
4 Material and methods ... 56
4.1 Cell culture techniques ... 56
4.1.1 Cell lines ... 56
4.1.2 General cell culture conditions ... 56
4.1.3 Subcultivation ... 57
4.1.4 Inocculation protocols ... 58
4.1.5 Buffers and solutions ... 60
4.2 Electrode fabrication ... 63
4.2.1 Gold electrodes ... 63
4.2.2 Stainless steel electrodes ... 67
4.2.3 PEDOT-film electrodes ... 68
4.3 Multi-mode impedance analysis ... 69
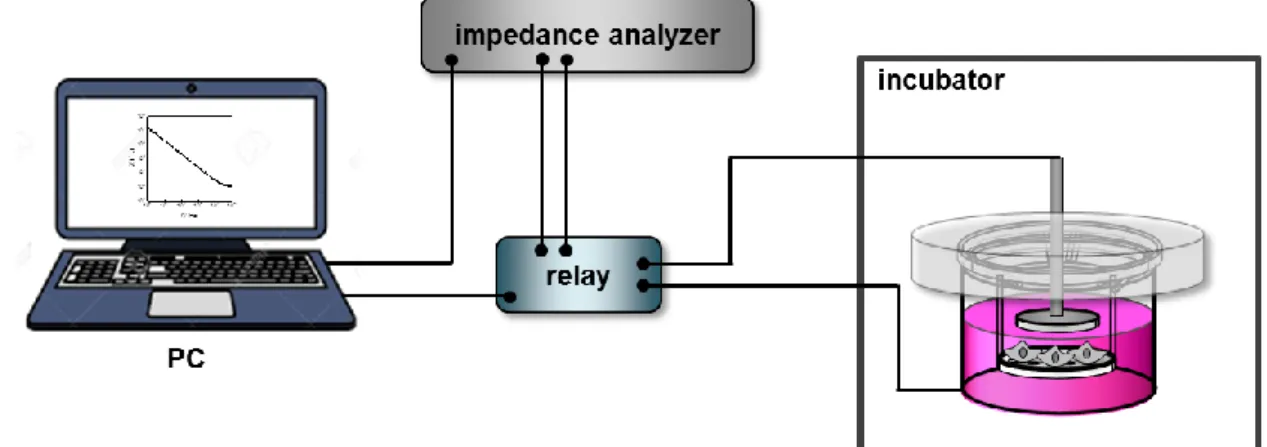
4.3.1 Experimental setup ... 69
4.3.2 Assay conditions ... 70
4.3.2.1 Combined electrochemical detection of P
Eand TER (P
ETER-assay) ... 70
4.3.2.2 Determination of osmotically induced transepithelial water flux ... 73
4.3.2.3 Combined electrochemical detection of P
OSand TER (P
OSTER-assay) ... 75
4.3.2.4 TER-studies with stainless steel electrodes ... 76
4.3.2.5 TER-studies with PEDOT electrodes ... 76
4.3.2.6 ECIS-cytotoxicity studies ... 77
4.3.3 Equivalent circuit modeling ... 77
4.4 Fluorophore dilution method ... 78
4.5 PrestoBlue
®-assay ... 79
5 Combined electrochemical determination of molecular and ionic permeability (P E TER-assay) ... 81
5.1 P
ETER-assay with integral readout ... 82
III
5.1.1 Characterization and calibration of the P
ETER-device ... 82
5.1.2 Investigation of epithelial monolayers expressing a broad range of barrier tightness ... 89
5.1.3 Calculation of P
Evalues ... 97
5.2 P
ETER-assay with spatially resolved readout ... 101
5.2.1 Characterization of the spatially resolved P
ETER-device ... 102
5.2.2 Investigation of epithelial monolayers expressing a broad range of barrier tightness ... 107
5.2.3 Investigation of mixed but segregated epithelial layers ... 113
5.3 Cytotoxicity studies of the redox tracers [Fe(CN)
6]
3-/4-and FcMeOH ... 116
5.4 Advantages and limitations of the P
ETER-assay in comparison to conventional permeability assays ... 121
5.4.1 Automated and time-resolved monitoring of tracer permeation ... 121
5.4.2 Determination of P
Evalues with internal TER control ... 122
5.4.3 Laterally resolved recording of tracer permeation ... 123
5.5 Summary and outlook ... 123
6 Impedance-based monitoring of osmotically induced water flux across epithelial cell layers ... 125
6.1 Central water flux measurements ... 126
6.1.1 Characterization of the electrode ... 126
6.1.2 Hypertonic stimulations of different epithelial cell layers ... 129
6.1.3 Hypotonic stimulations of MDCK-II monolayers ... 132
6.1.4 Analysis of transepithelial water flux kinetics ... 134
6.1.5 Hypertonic stimulations of MDCK-I-AQP1 monolayers ... 138
6.1.6 AQP-inhibition study with the AQP1-inhibitor HAuCl
4∙3H
2O ... 141
6.2 Spatially resolved monitoring of transepithelial water flux ... 143
6.2.1 Hypertonic stimulations of MDCK-I and MDCK-I-AQP1 monolayers ... 143
6.2.2 Hypertonic stimulation of mixed but segregated cell layers ... 145
IV
6.3 Combined impedance-based monitoring of osmotically induced transepithelial
water flux and TER (P
OSTER-assay) ... 147
6.3.1 Characterization of the electrode ... 148
6.3.2 Hypertonic stimulations of different epithelial monolayers ... 151
6.3.3 Hypotonic stimulations of MDCK-II monolayers ... 155
6.3.4 Calculation of P
OSvalues ... 157
6.3.5 AQP-inhibition study with the AQP1-inhibitor HAuCl
4∙3H
2O ... 162
6.4 Water flux measurements using the established fluorophore dilution method as an independent reference ... 164
6.5 Evaluation of the cytotoxic potential of the AQP1-inhibitor HAuCl
4∙3H
2O ... 166
6.6 Advantages and limitations of the impedance-based water flux assay in comparison to established methods ... 170
6.6.1 Automated monitoring of water flux with excellent time-resolution ... 170
6.6.2 Determination of P
OSvalues with internal TER-control ... 173
6.6.3 Laterally resolved recording of transepithelial water permeation ... 173
6.7 Summary and outlook ... 173
7 Transepithelial impedance analysis using PEDOT- electrodes ... 175
7.1 Comparative TER-studies of MDCK cells using PEDOT and stainless steel electrodes ... 175
7.2 Simulated impedance spectra of Caco-2 monolayers for PEDOT and stainless steel as electrode material ... 185
7.3 Long-term stability measurements ... 189
7.3.1 Stability study of the PEDOT-electrodes in absence of epithelial cells ... 189
7.3.2 Manipulation of barrier function of MDCK cells... 191
7.4 Summary and outlook ... 195
V
8 Summary ... 197
9 Zusammenfassung ... 200
10 References ... 203
11 Appendix ... 216
11.1 Supplementary information ... 216
11.2 Abbreviations and symbols ... 232
11.3 Eidesstaatliche Erklärung ... 236
11.4 Curriculum vitae ... 237
11.5 Danksagung ... 238
1
1 Introduction
1.1 Epithelial barriers
There are four major groups of tissues in mammalian bodies: (I) the connective, (II) the muscle, (III) the nervous and (IV) the epithelial tissue (Patton 2015). Epithelial cells are barrier-forming cells acting as an interface tissue and exhibiting several physiological functions. They cover and protect all inner and outer surfaces of the body. Epithelial layers play an important role in the highly regulated transport of solutes and ions between the underlying tissues and a body cavity (Torras et al. 2018). Besides, they are involved in glandular activity and control the secretion of hormones, sweat, mucus and enzymes (Patton 2015). Epithelia appear at numerous locations in the body, e.g. the outermost layer of the skin is formed by them. The lining of blood and lymphatic vessels represents a special case.
This kind of cells is known as endothelial cells (Wegener and Seebach 2014).
Epithelial tissues are classified by the number of their layers and by the morphology of their cells. Basically, the different cell shapes lead to a discrimination between the (I) squamous, (II) cuboidal and (III) columnar epithelium (Eurell et al. 2006). The number of cell layers can vary in different epithelium types. The simple epithelium is composed of a monolayer. In that case, every cell has direct contact to the basement membrane separating it from the underlying tissue. Simple epithelial monolayers are especially found at places where absorption and filtration takes place. Supposedly, the one-layer structure of the simple epithelium facilitates these processes. Another class of epithelia is constituted by the stratified epithelium which is made up of multilayers. Such multilayered structures are found where body linings have to face enhanced mechanical and chemical pressure (Platzer and Spitzer 2009).
In the following chapters a brief overview of cell-cell and cell-matrix contacts which are the
structural basis for epithelial barrier function as well as possible routes for transepithelial
transport is given. Since epithelial barrier function is in the focus of this thesis established
assays for its quantification are addressed separately. Additionally, a correlation between a
defective barrier function and the development of diseases is highlighted emphasizing the
fundamental importance of developing new devices and assays for the analysis of epithelial
barrier properties.
2
1.1.1 Classification of cell-cell and cell-matrix contacts
Epithelial cells form a variety of junctions between two neighboring cells (cell-cell contacts) and to the basement membrane (cell-matrix contacts). These junctions are subdivided into three major classes: (I) tight junctions, (II) anchoring junctions and (III) gap junctions (Alberts 2017). The unique barrier properties of epithelial tissues are mainly due to the tight junctions which are sealing the paracellular gap. Anchoring junctions are also involved in establishing the epithelial barrier by mechanically stabilizing the connection between adjacent cells (adherens junctions, desmosomes) and their connection to the basement membrane (focal contacts, hemidesmosomes). The third subgroup of cell junctions is crucial in terms of cell communication and allows an exchange of nutrients and solutes within the epithelium.
There are two main tasks of tight junctions. First, uncontrolled diffusion between compartments with different chemical composition that are separated by an epithelial cell layer is prevented by sealing the intercellular space between adjacent cells (barrier function).
Second, tight junctions also ensure the cell polarity of epithelial layers by building up a barrier to the intramembrane diffusion of proteins and lipids (fence function). Cell polarity is a basic requirement for an active and regulated transepithelial solute and water transport. Even more complex biological processes like gene transcription, tumor suppression and cell proliferation are indirectly associated with the tight junctional complex (Schneeberger and Lynch 2004).
Tight junctions are localized in the apical region of epithelial cells (Shin et al. 2006). They are composed of a network of sealing strands which are formed from a row of opposing transmembrane proteins embedded in the plasma membranes of the adjacent cells. The extracellular domains of these proteins are interacting with each other resulting in the occlusion of the paracellular cleft. A multitude of different proteins – transmembrane and intracellular - are involved in the formation of the tight junctional complex. So far, three major types of transmembrane proteins are known: (I) occludin, (II) claudins and (III) junction adhesion molecule (JAM) proteins (Anderson and van Itallie 2009). Occludin was the first transmembrane protein which was identified. It is a 65 kDa protein with a tetraspan membrane topology consisting of two extracellular loops and a large C-terminal cytoplasmic domain (Wolburg et al. 2006). The participation of occludin in the tightness of epithelial barriers was clearly demonstrated by overexpression that led to an increase of the transepithelial electrical resistance in mammalian cells (Balda et al. 1996; McCarthy et al.
1996). A special case is formed by tricellulin which seals contact points of three neighboring
cells (Ikenouchi et al. 2005). Such triple contacting points are supposed to constitute weak
3
points within the epithelium. The biggest fraction of tight junctional transmembrane proteins is constituted by the family of claudins. In mammals 27 different claudins have been identified (Krug et al. 2012; Tsukita et al. 2019). They show a similar membrane topology as occludin with two extracellular loops even though they are significantly smaller (20-27 kDa). Claudins possess several physiological functions, but they are primarily involved in forming transcellular contacts required to seal the intercellular gap (Mitic et al. 2000). The in vivo expression of claudins is diverse, e.g. claudin-3 and claudin-5 are predominantly expressed in brain endothelial cells contributing to the integrity of the BBB. JAMs are the third class of tight junctional transmembrane proteins. They differ from occludin and claudins in their topological structure possessing only a single transmembrane domain with a protein mass in the range of 40 kDa. So far, four different isoforms of JAMs have been observed. Their physiological relevance lies in facilitating the assembly of the tight junctional complex and in maintaining the cell polarity. In addition to transmembrane proteins a second class of proteins is crucial for the forming of tight junctions. These so-called tight junctional adapter proteins are localized within the cytoplasm (Luissint et al. 2012). Among them, membrane-associated guanylate kinase (MAGUK) family members have been largely documented: zonula occludens-1 (ZO-1, 225 kDa) (Stevenson et al. 1986), ZO-2 (160 kDa) (Gumbiner et al. 1991) and ZO-3 (130 kDa) (Haskins et al. 1998). It is well known that the ZO proteins connect the transmembrane tight junctional proteins with the actin cytoskeleton. All adapter proteins have in common that they exhibit at least one PDZ domain. PDZ is an initialism combining the first letters of the first three proteins discovered to possess the domain – post synaptic density protein (PSD95), drosophila disc large tumor suppressor (Dig1), and ZO-1 (Kennedy 1995).
ZO proteins interact with the C-terminal domain of claudins via their first PDZ domain (Itoh et al. 1999), to JAMs by their third PDZ domain (Bazzoni et al. 2000) and to occludin via their GUK (guanylate kinase) domains (Fanning et al. 1998; Furuse et al. 1994). PDZ domains are a sequence of 80-90 amino acids folding to form a hydrophobic groove to which the C- terminal T/SXV (Ser/Thr-X-Val-COOH with X as an arbitrary amino acid) motif of the transmembrane protein bind (González-Mariscal et al. 2005). At present, it is known that many other types of tight junctional adapter proteins exist like for example membrane-associated guanylyl kinase inverted proteins MAGI-1, MAGI-2 and MAGI-3 (Schneeberger and Lynch 2004).
Anchoring junctions are important in the structural cohesion of tissues connecting the
cytoskeleton of neighboring cells or establishing a linkage between the cytoskeleton and
4
basement membrane proteins (Johnson and Harley 2011). The best known type of anchoring junctions is represented by the adherens junctions. They are mainly involved in initiating cell-cell contacts and in promoting their maturation and maintenance. Adherens junctions are localized in a more basolateral region of the lateral plasma membrane relative to tight junctions. Although the molecular components of tight junctions and adherens junctions are different, they exhibit common features. In both junction types cell adhesion is moderated by transmembrane proteins which promote hydrophobic interactions between their extracellular domains and form a pericellular zipper-like structure. In case of adherens junctions, the family of cadherins takes this role. Cadherins are single-span, Ca
2+dependent transmembrane proteins. The cytoplasmic part of cadherins is connected to the actin cytoskeleton via different mediator proteins like catenins. Desmosomes appear underneath adherens junctions and belong also to the family of cadherin-based junctions. In contrast to adherens junctions desmosomes link the intermediate filaments of adjacent cells via adapter proteins and desmoplakin (Gallicano et al. 1998). Additionally, anchoring junctions can be found in the connection between the cytoskeleton and the basement membrane. In that context the superfamily of integrins are of particular interest. Integrins are composed of heterodimers with non-covalently associated α-and β-subunits (Harburger and Calderwood 2009). The extracellular face of integrins binds directly to specific amino acid motifs of diverse extracellular matrix (ECM) proteins like fibronectin or laminin (Hynes 2002). The linkage between the cytoskeleton and the integrins is accomplished by several mediator proteins like talin (Zaidel-Bar et al. 2007). The participating cytoskeletal structure defines the name of the cell-matrix junction: (I) focal contacts (actin cytoskeleton), (II) hemidesmosomes (intermediate filaments) (Borradori and Sonnenberg 1996; Litjens et al. 2006).
Gap junctions do not contribute to the establishment of a barrier or to the mechanical
stability, but regulate a rapid exchange of nutrients, water, ions or other important solutes
within the epithelium (Beyer et al. 1990). Besides, the coupling between epithelial cells via
electrical signals is mediated by gap junctions (Pereda et al. 2013). They build an adjustable
channel-like structure between two neighboring cells which is formed by channel-forming
transmembrane connexin proteins. Six connexins associate to build a connexon which
resembles a hemichannel. Two opposing connexons interact to create an intercellular,
water-filled channel linking the cytoplasm of adjacent cells. The permeability of these
connexons is mainly controlled by intracellular Ca
2+concentration and pH value. The inner
5
diameter of these pores is 1.4 nm. Moreover, they can be opened and closed instantly to react on external stimuli (Maeda et al. 2009; Nakagawa et al. 2010).
1.1.2 Pathways of transepithelial transport
Epithelial barriers play an important role in the context of drug development and drug targeting. There are numerous epithelial and endothelial barriers in the human body mediating and also limiting the uptake of certain compounds. A certain drug is able to cross such barriers on different paracellular and transcellular pathways which are summarized in Fig. 1.1. The preferred route of a molecule relies on its physicochemical properties (size / charge / lipophilicity / hydrogen binding potential / solution conformation) (Anderson 2001; Balimane et al. 2006; Hillgren et al. 1995).
Passive paracellular diffusion (Fig. 1.1 (1)) is minimal in moderately tight and tight epithelia due to the presence of tight junctions. Only small hydrophilic molecules are able to overcome the paracellular seal, unless particular modulators of tight junctions are administered at the same time. For example, it is possible to reduce the tightness of an epithelium by the presence of the tight junction modulator ephrin-A2 which directly phosphorylates claudin-4 (Matsuhisa et al. 2009). In case of transcellular pathways several mechanisms have to be considered. Passive transcellular diffusion (Fig. 1.1 (2)) across the phospholipid bilayer can take place for sufficiently hydrophobic or very small molecules. Transcellular diffusion can also be facilitated by particular membrane channels or transport proteins (Fig. 1.1 (3)). It is also possible that a substance is actively transported transcellularly against a concentration gradient by the help of specialized transporter systems (Fig. 1 1 (4)). In this case, the process requires energy which is obtained from a coupled reaction. In humans, there are two possibilities for the gain of energy which are denoted as (I) primary active transport and (II) secondary active transport. Primary active transport is based on an ATP-consuming step, whereas secondary active transport takes the energy from an electrochemical gradient of a different species. For large, hydrophilic compounds active transport is realized by receptor-mediated transcytosis (Fig. 1.1 (7)). A huge challenge in drug absorption appears in presence of apically or basolaterally localized efflux transporters (Fig. 1.1 (5)) like P-glycoprotein transporting compounds from inside the cell back into the intestinal lumen.
Thus, the presence of efflux proteins results in a serious reduction of drug uptake. Reduced
6
drug absorption can also be caused when the absorbed molecule serves as a metabolic substrate (Fig. 1.1 (6)).
1.1.3 Quantification of epithelial barrier function
In general, three parameters are established for a comprehensive description of epithelial barrier properties: (I) the permeability of small inorganic ions is described by the transepithelial or -endothelial electrical resistance (TER); (II) the permeability of (macro-) molecular tracers across an epithelial barrier gives rise to the molecular permeability coefficient (P
E); (III) the permeability of water through epithelial cells is quantified by the hydraulic conductivity L
pand the osmotic water permeability coefficient (P
OS) (Wegener and Seebach 2014).
These three barrier-describing parameters are preferably measured via in vitro methods. In that context epithelial assays are of particular interest. Here, epithelial monolayers are cultivated on highly permeable filter supports. These so-called Transwell
®filters consist of a plastic scaffold which is needed for the mounting of the support into specialized measurement chambers and of a porous membrane acting as a mechanical support and growth substrate for cells. The commercially available filter membranes differ in membrane material (polycarbonate / polyester) as well as in porosity (pore size and pore density).
Tab. 1.1 shows an overview about different commercially available Transwell
®filter inserts.
Small pore sizes are recommended for drug transport studies whereas large pore sizes are basically used for cell migration assays. In this thesis polycarbonate membranes with small pores (0.4 µm pore diameter) and high pore density (10
8pores/cm
2) are used providing a percental pore area of 12 % related to the overall membrane area of 1.12 cm
2. In epithelial assays, a cell-covered Transwell
®filter is placed into a two chamber setup and thereby the cell layer is serving as a diffusion barrier between two fluid-filled compartments. Thus, two
Fig. 1.1: Pathways of transepithelial transport: (1) passive paracellular diffusion, (2) passive transcellular diffusion, (3) facilitated diffusion, (4) primary active or secondary active transport, (5) efflux transporter, (6) metabolic conversion, (7) receptor-mediated transcytosis.
7
independent compartments are created mimicking the physiological situation of an epithelium with an apical and basolateral area.
The following chapters give a description of the three parameters and summarize the most important corresponding in vitro assays. Special attention is directed to the problems and limitations of the established techniques.
nominal pore density / pores/cm2
pore size / µm polycarbonate membrane polyester membrane
0.4 1 ∙ 108 4 ∙ 106
1.0 - 1.6 ∙ 106
3.0 2 ∙ 106 2 ∙ 106
5.0 4 ∙ 105 -
8.0 1 ∙ 105 1 ∙ 105
1.1.3.1 Ionic permeability
The permeability of small inorganic ions like Na
+, Cl
-, K
+and HCO
3-across an epithelial barrier is quantified by the transepithelial electrical resistance (TER) (Günzel et al. 2010). The TER can be determined via both, direct current (DC) and alternating current (AC) methods.
For both approaches, barrier-forming monolayers are cultivated on permeable filter membranes as described above. In DC-TER-readings a four electrode arrangement has to be applied with two electrodes on each side. One electrode pair injects a direct current through the cell layer, whereas the second electrode pair is responsible for measuring the associated voltage drop across the cell layer. Application of Ohm’s Law (R = U/I) reveals a resistance value (in Ω) that has to be multiplied with the area of the filter surface (in cm
2) and the result is then referred to as the TER (in Ωcm
2). The resistance value of a cell-free filter insert has to be measured separately and subtracted to avoid an overestimation of the TER.
Two different DC-based methods to determine the transepithelial electrical resistance are established and illustrated in Fig. 1.2:
(I) In the first approach each compartment is equipped with a pair of point-like Ag/AgCl electrodes (Fig. 1.2A). The electrodes are referred to as “chopsticks”
because they look like a two-armed fork with one current injecting electrode and one voltage sensing electrode on either arm. The two arms are dipped into the apical and basolateral compartment measuring the resistance of the monolayer.
However, due to the random placement of the electrodes at the periphery of the
Tab. 1.1:Commercially available Transwell® filter inserts consisting of different membrane materials, pore sizes and pore densities. The information is obtained from www.corning.com/lifesciences.
8
cell layer and due to the electrode geometry, the electric field is inhomogeneous leading to systemically overestimated TER values (Günzel et al. 2010; Jovov et al.
1991; Sheller et al. 2017).
(II) The second DC method provides more reliable TER-readings (Fig. 1.2B). So-called Endohm
TMchambers consist of planar current-injecting electrodes and point-like voltage sensing electrodes resulting in a more uniform current density across the cell layer (Sheller et al. 2017; Wegener and Seebach 2014). Thereby, the complete cell layer is taken into account. Additionally the position of the electrodes is fixed leading to more reproducible measurements.
Modern devices no longer rely on DC measurements due to a constant concern about membrane polarization and net charge displacement. Instead, electrochemical impedance spectroscopy (EIS, chapter 3.1) has gained increasing impact in terms of analyzing the transepithelial electrical resistance. EIS applies AC currents and AC voltages which are significantly less invasive and provide more information (Wegener et al. 2004). Fig. 1.3 displays a schematic of the experimental setup for AC-based TER measurements. A cell-covered filter is sandwiched between two fixed, planar electrodes in order to guarantee a homogenous electric field. Impedance measurements are carried out over a broad frequency range (usually 1 – 10
6Hz). The amplitude and the phase shift of an AC current are determined for a given set of discrete frequencies. One of the benefits of this technique is that the total AC impedance contains a higher level of information and returns next to the TER three further parameters:
Fig. 1.2: Schematic of the DC-based methods to determine the transepithelial electrical resistance: (A)
“Chopstick” electrode setup, (B) EndohmTM chamber.
9
(I) The capacitance of the cell layer (C
cl) reflects predominantly the surface area of the plasma membrane and provides a measure for the degree of membrane foldings.
Knowledge of the true membrane area is important, for example, when active transepithelial transport processes are examined (Kottra et al. 1993).
(II) An additional parameter which can be retrieved from such experiments is the bulk resistance (R
bulk). The online monitoring of R
bulkshows even small changes in the medium conductivity which may be linked to temperature effects.
(III) The stationarity of the electrodes is monitored by the measurement as well since in a two-electrode setup the impedance of the electrodes is always an integral part of the system and reported in the data. The parameter that describes the electrode stationarity is denoted as constant phase element (CPE) and is explained in a more detailed way in chapter 3.1.1.
All four parameters (TER, C
cl, R
bulk, CPE) can be extracted at any time point from the raw data by equivalent circuit modeling. Using two electrodes is justified as long as there is no significant faradaic current across the electrode/electrolyte interface. With the typical applied voltage amplitudes (10 – 50 mV) the two electrode arrangement is valid (Wegener et al.
2004).
Although the impedance-based detection of the ionic permeability across epithelial layers possesses numerous advantages over other means to quantify TER, some pitfalls have to be considered that are common to all these devices and are not improved by using AC. All TER recording techniques represent integral readouts and are therefore prone to artefacts
Fig. 1.3:Schematic of the experimental setup for AC-based TER measurements.
10
(Klusmeier et al. 2019; Wegener and Seebach 2014). Small defect areas within the monolayer lead to a drastic underestimation of the measured TER. Even single missing cells are suspected to cause misinterpretations (Fromm et al. 2009; Wegener and Seebach 2014).
Due to the non-transparent character of most Transwell
®filters, a concomitant microscopic tracing of such defect spots is not possible. Such heterogeneities within cell layers can only be visualized by an increased experimental effort:
(I) Defect areas have been located by conductance scanning using microelectrodes (Gitter et al. 1997; Gitter et al. 2001). The microelectrodes are placed directly above the cell surface. A heterogeneous clamp current is then induced across the barrier while the microelectrodes are scanning the local and confined potential.
Unfortunately, this experimental handling is elaborate and consequently not relevant for high-throughput studies.
(II) Another limitation is that the impedimetric determination of TER alone is not sufficient to discriminate between the paracellular resistance (R
para) and the transcellular resistance (R
trans) (Wegener and Seebach 2014). In most types of epithelia, changes in TER reflect primarily changes in R
paradue to the extremely high values of R
trans. But in case of very tight cell layers, R
paracan reach the same order of magnitude than R
trans. Hence, the contributions of the transcellular currents have to be taken into account for tight cell layers. In this regard, a novel impedance-based technique has been developed which allows the determination of R
paraand R
transindividually (Günzel et al. 2012; Krug et al. 2009b). Briefly, EIS and permeability measurements of paracellular probes are combined. Provided that the probe is exclusively transported via paracellular diffusion, the contribution of R
paracan be extracted from the total TER. This method is referred to as two-path impedance spectroscopy and is explained in a more detailed way in chapter 3.1.2.
(III) An additional phenomenon comes into play when very leaky cell layers are investigated. Here, the paracellular resistance is not just determined by the strength of the tight junctions, but also from the lateral intercellular resistance and the resistive contribution arising in the cell-substrate adhesion zone (R
adh) (Lo et al.
1999). Up to now, there is no possibility to measure R
adhfor cells grown on filter
supports. When cells are grown on impermeable, but conductive surfaces such as
11
gold-film electrodes, the additional impedance contribution from the cell-substrate adhesion zone is assessable from impedance spectroscopy (Giaever 1993;
Giaever and Keese 1984; Giaever and Keese 1991). This well-established technique is referred to as electric cell-substrate impedance sensing (ECIS, chapter 3.1.4).
1.1.3.2 Molecular permeability
Solute flux across epithelial cell layers is among others studied via in vitro permeability assays. Epithelial cell sheets cultivated on porous filter membranes are acting as a diffusion barrier between two different compartments, as it was described above. A schematic of the experimental setup for typical permeability measurements is given in Fig. 1.4. To analyze molecular barrier function, a permeability probe is added to one of the two compartments (donor compartment). If the permeability probe is able to cross the barrier, a time-dependent increase of the tracer concentration is observed in the other compartment (receiver compartment). The rate of tracer accumulation in the receiver compartment gives rise to the molecular permeability coefficient (P
E, denoted in cm/s). High permeability coefficients indicate leaky cell layers. To determine correct permeability coefficients, the impact of a cell-free filter insert on the measurement has to be investigated separately and subtracted, as it is necessary for TER-measurements. The physical background of P
Eand a detailed calculation protocol are given elsewhere (chapter 3.2.1). Mild agitation is recommended for such permeability measurements to avoid additional diffusive contributions due to an unstirred water layer next to the cell sheet. Furthermore, a strict control of temperature and pH value is necessary (Youdim et al. 2003). The choice of the permeability probe depends on the transepithelial transport pathway which is to be examined. Highly water-soluble tracers are taken for the analysis of paracellular permeation, whereas transcellular mechanisms are studied by lipophilic molecules or by tracers for which particular carrier-systems are present in the plasma membrane. Typical paracellular permeability tracers for these standard in vitro assays are sucrose, mannitol, inulin or high molecular weight probes like dextrans or polyethylene glycols (PEG) (Ghandehari et al. 1997; Sanders et al. 1995). The paracellular permeation of larger compounds has initiated a great debate about the composition of tight junctions (Cohen et al. 1999; Neuhaus et al. 2006; Spring 1998; van Itallie et al. 2008;
Watson et al. 2001). Originally, only small hydrophilic molecules have been regarded to be
able to cross the tight junctional complex. Most of the TJs exhibit very small pores (diameter
12
~ 8 Å) located at the bicellular contact points. There are also larger pores (diameter ~ 100 Å) at the contact zone of three adjacent cells. These tricellular junctions are supposed to facilitate paracellular diffusion of even high molecular weight probes to a small extent. The contribution of these larger pores to the overall tight junctions is estimated to be in the range of 1 % (Krug et al. 2009a). The readout of tracer accumulation depends on the type of label.
In general, two kinds of labels are used for permeability measurements: (I) Most often the tracers are linked to small fluorescent dyes (Sanders et al. 1995), e.g. fluorescein isothiocyanate (FITC). (II) The second approach operates with radiolabels which are introduced to the molecule at specific positions (Ghandehari et al. 1997). For the detection of unlabeled tracers usually liquid chromatography techniques are applied.
Several problems of the established permeability assays impede the determination of permeability coefficients and render the calculated values prone to errors:
(I) An especially critical issue is related to the sampling. A sample has to be taken from the receiver compartment for every single time-point causing a continuous disturbance of the cellular system. The experimental procedure of such assays is both, time-consuming and expensive. This sequential sampling results also in a rather poor time-resolution and provides no online information about the tracer accumulation.
(II) Furthermore, the coupling of a fluorescent label may alter the physicochemical properties of a tracer compound drastically.
(III) Standard permeability assays should additionally be combined with separate TER-measurements prior to the actual permeability experiment to ensure barrier integrity. This creates again work load and cost.
Fig. 1.4:Schematic of the experimental setup for in vitro permeability measurements to determine PE values. In this example the basolateral compartment serves as the receiver compartment.
13
(IV) Similar to TER-readings, the established permeability assays offer an integral readout and hence, permeability coefficients are affected by defects within the epithelial layer. Such leaks in epithelial barriers may cause severe misinterpretations. Therefore, a spatially resolved determination of permeability coefficients creates a considerable advantage and progress.
Several strategies to enable laterally resolved permeability monitoring have already been reported and are summarized in the next paragraphs:
(I) The first approach was described by Phelps and DePaola who exchanged a liquid receiver compartment against an agarose gel in order to visualize the local distribution of a 70 kDa FITC-dextran after permeation across endothelial barriers (Phelps and DePaola 2000). The fluorescent-labeled dextran diffuses across the cell layer directly into the agarose gel underneath the filter membrane, where its diffusional spread is retarded. Thereby, a spatial mapping of tracer permeability at a given time-point is accessible. However, the lateral resolution of this method was low and far beyond the size of a single cell.
(II) A better spatial resolution was achieved by the use of high-affinity interactions (Dubrovskyi et al. 2013). In that case, the permeability probe is conjugated with avidin and the cells are cultured on a biotinylated gelatin network instead of a filter membrane.
(III) Another approach of spatial mapping was published by Michaelis et al. in 2012.
The assay uses mesoporous silicon as a growth substrate for epithelial cells. The pores in the substrate are densely packed and only open to the side facing the barrier-forming cells. Consequently, the pores serve as the receiver compartment and a lateral diffusion of the fluorescence-labeled permeability probe is impossible due to the walls of the pores. Imaging the filling of the pores with a confocal microscope uncovers the spatial permeability of the cell layer at subcellular level.
Thus, the approach not only discovers defect areas, but also enables
discrimination between para- and transcellular pathways (Michaelis et al. 2012).
14
(IV) Besides the permeation of fluorescently labeled compounds, also the permeability of redox-active tracers has been studied locally resolved. For example, the diffusion of ferrocenemethanol (FcMeOH) or ruthenium hexamine chloride ([Ru(NH
3)
6]Cl
3) across MDCK-II layers was detected with spatial resolution by means of scanning electrochemical microscopy (SECM). Passive transport of these redox mediators was recorded with subcellular resolution by scanning the epithelial surface with ultramicroelectrodes (Bergner et al. 2012).
The bottom line is that a pool of different approaches for the detection of molecular permeability with spatial resolution exists. However, all of the methods have one common drawback. They are challenging from the experimental point of view and hence, they are not suitable for high-throughput studies. Furthermore, most of the described methods do not offer time-resolved data, but have to be classified as typical end-point assays.
1.1.3.3 Water permeability
For a comprehensive characterization of epithelial water permeability, several parameters are commonly used:
(I) The hydraulic conductivity (L
P, in cm∙s
-1∙atm
-1) reflects the permeability of an epithelial barrier for water and relates volume flux to hydrostatic pressure as well as to osmotic pressure.
(II) Often the impact of hydrostatic pressure is negligible and in those cases, the hydraulic conductivity is converted into the osmotic water permeability coefficient (P
OS, in µm/s).
(III) In absence of any pressure gradients and under steady-state conditions, still a mere diffusional water flux occurs which is quantified by the diffusional water permeability coefficient (P
D, in µm/s). The diffusional water permeability coefficient is usually measured by radiolabeled water flux experiments (
3HHO,
2H
2O, H
218O)
or by NMR-based techniques (Solomon 1989; Verkman 1995; Ye and Verkman
2002).
15
A detailed derivation of these three parameters (L
P, P
OS, P
D) and the exact calculation protocol for P
OSare shown elsewhere (chapter 3.2.2). Furthermore, discrimination between water flux across the entire cell layer (transepithelial) or through only one plasma membrane (transmembrane) is important. For quantification of transepithelial water permeability, standard in vitro assays using Transwell
®filters (as described above) are performed. Fig. 1.5 shows a schematic of the experimental setup of typical epithelial water flux measurements. In the standardized procedure, an osmotic gradient across the cell layer is induced. One of two compartments is either filled with a hyper- or hypotonic solution leading to a water flux between the two fluid-filled sides. So far, two different readout techniques exist:
(I) A fluorescent, membrane-impermeable dye with low permeation rate across the cell layer is added into one of the compartments (Levin et al. 2006). Due to the water flux between the apical and basolateral region and the associated concentration change, the fluorescence intensity is either decreasing or increasing time-dependently. This approach is also referred to as fluorophore dilution method.
This technique has similar disadvantages as the standard permeability assays for P
E-determination. Samples have to be taken for every single time-point which means a high level of disturbance for the cells. Additionally, this method is also time-consuming and provides only a low time-resolution. The readout principle is highly prone to errors as there is a serious mixing problem in the fluorophore carrying compartment.
(II) The second approach makes use of special capillary tubes connected to one of the compartments (Dorr et al. 1997). By monitoring the fluid height in the capillary tube, transepithelial water flux can be quantified time-resolved and with good precision.
However, the preparation of the experimental setup is difficult and time-consuming.
Thus, this technique is not appropriate for high-throughput studies. Another drawback for both approaches is that additional TER control measurements have to be performed to guarantee barrier integrity.
Up to now, no technique has been pubslihed that allows for transepithelial water flux
detection in a spatially resolved manner. Due to possible heterogeneities of water
permeability properties within a cell layer, water flux monitoring with a lateral resolution is
worthwhile. Besides, diverse assays are established for detecting transmembrane water
transport. Many of them utilize the correlation between cell volume changes (cell
16
shrinking, cell swelling) and optical properties, such as light transmission (Farinas et al.
1997; Farinas and Verkman 1996), absorbance (Levin et al. 2007) or scattering (Soveral et al. 1997; Soveral et al. 2008), and fluorescence (Hamann et al. 2002; Solenov et al.
2004; Soveral et al. 2007). In addition, water flux through the plasma membrane has been measured via impedance spectroscopy (Hua and Pennell 2009; Kimelberg et al. 1992) or surface plasmon resonance spectroscopy (Baumgarten and Robelek 2011; Robelek and Wegener 2010; Vala et al. 2013).
The question how water molecules are transported across an epithelium has been discussed for a long time. The literature to that issue reveals a high diversity of answers that are obviously dependent on the cell types (Fischbarg et al. 2006; Fischbarg 2010; Tripathi and Boulpaep 1989). In principle, three different routes are relevant:
(I) Water molecules may migrate across the phospholipid bilayer by simple passive diffusion. Due to the polar character of H
2O and the rather lipophilic properties of the plasma membrane, this kind of transcellular route requires a high level of activation energy and the plasma membrane to be in physiological, fluid-like phase.
(II) In certain epithelial tissues, e.g. barrier-forming cells in the kidney, particularly high rates of water transport are needed to meet the physiological requirements. In that kind of tissues, a second transcellular pathway plays the prevailing role (Verkman 2003; Verkman 2006). Special water-selective channels integrated into the plasma membrane facilitate the diffusion of water across the epithelial barrier by significantly reducing the activation energy of the process. These channels are also
Fig. 1.5:Schematic of the experimental setup for osmotically induced transepithelial water flux measurements to determine POS values. The illustration refers to the addition of a hyperosmotic solution such as sucrose into the apical compartment. Two different readout principles are established: (1) fluorophore dilution method, (2) the use of a capillary tube that is connected to one of the two compartments.
17
referred to as aquaporins (AQPs). A detailed description of aquaporins is provided elsewhere (chapter 1.2).
(III) The third pathway is still highly controversial. For a long time a paracellular route was basically excluded due to the watertight character of tight junctions. Recently it was shown that claudin-2, a component of the tight junctional complex, forms a paracellular water channel (Günzel and Yu 2013; Krug et al. 2012; Rosenthal et al.
2010). The study demonstrated that an overexpression of claudin-2 in MDCK C7 cells significantly enhanced the paracellular water permeability. Otherwise, no other compound of the tight junctions has been identified to form water channels up to now which indicates a very small paracellular contribution to the overall transepithelial water transport.
So far, a differentiation between a diffusive pathway across the plasma membrane, a transcellular AQP-mediated transport or a paracellular route through the tight junctions is not possible by single measurements and is only indirectly accessible (Carpi-Medina and Whittembury 1988; Rosenthal et al. 2010).
1.1.4 Diseases associated with dysfunctional epithelial barrier function
A crucial function of epithelial and endothelial cell layers is the separation of two
physiologically adjacent chemical environments from each other. As mentioned above,
epithelial barrier function is mainly due to the formation of tight junctions. These intercellular
seals regulate the diffusion of solutes or ions and allow the development of chemical and
electrochemical gradients. Thus, epithelial barrier integrity is essential to maintain a constant
and steady chemical milieu (homeostasis) within a compartment surrounded by epithelial
tissues (e.g. lung, kidney, liver, brain, intestine). Alterations in molecular composition of
cell-cell and cell-matrix contacts and the following impacts on barrier properties may provoke
serious pathological conditions and subvert homeostasis. This chapter provides a brief
overview about diseases caused by dysfunctional barrier properties without focusing on the
very complex and still not totally resolved molecular mechanisms. Nevertheless, the
importance and the number of pathological conditions associated with impaired epithelial
barrier function emphasize the relevance of epithelial and endothelial physiology and the
strong need to study it on all levels.
18
A big family of barrier-interfering ailments is constituted by allergic diseases (Schleimer and Berdnikovs 2017). When the mucus or other biological barriers are predisposed to disruption, microorganisms and antigens may invade the body by getting into the underlying connective tissue. Penetration of microbes may trigger strong immune responses. In atopic dermatitis, a loss of dermal barrier function is observed leading to the formation of skin lesions (Thyssen and Kezic 2014). An intact mucosal barrier is crucial for the preservation of airway homeostasis (Heijink et al. 2007; Ordoñez et al. 2001; Sweerus et al. 2017). The latter is disturbed in most forms of asthma due to an impaired barrier function of the airway epithelium. Disruption of tight and adherens junctions with a significant loss of E-cadherin and claudin-18 is typical for asthmatic epithelium. Dysfunctional mucosal epithelial barrier causes allergic rhinitis (Lee et al. 2016; Runswick et al. 2007; Wan et al. 1999). Allergens may contain proteases and have been proven to destroy epithelial tight junctions. Reduced levels of the barrier proteins E-cadherin and ZO-1 were determined in nasal mucosal tissue from allergic rhinitis patients. The esophagus consists of a stratified squamous epithelium similar to the structure of skin (Ravelli et al. 2006). In eosinophilic esophagitis, the intercellular gaps are dilated resulting in a disturbed barrier function. Endothelial dysfunction is also supposed to be an early marker for atherosclerosis (Davignon and Ganz 2004).
1.2 Aquaporins (AQPs)
Water is the major component of cells throughout all forms of life. Bidirectional transport of
water and solutes across cell membranes is essential for osmoregulation and energy
homeostasis which are a prerequisite for survival and adaption of living cells and tissues
(Madeira et al. 2016). For many years it was assumed that biological membranes are freely
permeable to water. However, particular membranes are more water permeable and have
certain biophysical features, such as weakly temperature-dependent water transport and an
enhanced osmotic compared to diffusional water permeability, which suggested a pore-like
transepithelial water flux. In that context, specific water channels, also known as aquaporins
(AQPs), located within the plasma membrane have been identified. Cells expressing AQPs
exhibit a 5- to 50-fold higher osmotic water permeability than cells that do not (Verkman
2011). Compared to lipid bilayer diffusion, lower activation energy for water transport is a
typical property of AQP-mediated diffusion. Hence, in epithelial tissues which rely on fast and
efficient water movements, the route across aquaporins is the prevailing pathway, whereas
19
simple diffusion across lipid bilayers and paracellular flux under participation of claudin-2 only play a minor role. The most remarkable feature of AQPs is their high selectivity and efficiency on water and glycerol permeation, excluding ions and protons (Murata et al. 2000).
Nevertheless, a number of other permeants such as urea, ammonia, hydrogen peroxide, carbon dioxide, metalloids and nitric oxide have been reported to be transported via aquaporins (Wu and Beitz 2007).
AQPs belong to a highly conserved family of membrane proteins (major intrinsic proteins) comprising more than 1700 integral membrane proteins (Madeira et al. 2016). In mammals, 13 different isoforms of AQPs are known (AQP0 – AQP12). These isoforms are found differentially expressed in body regions which are involved in fluid absorption and excretion, but also in other tissues like brain, fat, skin and liver. Generally, aquaporins are divided into three subgroups:
(I) The classical or orthodox AQPs are primarily permeable to water, such as AQP1, AQP2, AQP4, AQP5 and AQP8.
(II) A second class of AQPs is also selective for glycerol and is referred to aquaglyceroporins. AQP3, AQP7, AQP9 and AQP10 belong to this group.
(III) The physiological relevance of S-aquaporins, also unorthodox AQPs, still remains obscure (Verkman 2005). This subfamily is only present in animals but not in plants, fungi and bacteria. AQP0, AQP11 and AQP12 form the family of S-aquaporins appearing in the eye lens, kidney, liver and pancreas (Ishibashi et al.
2009; Ishibashi et al. 2014).
In most cell types, AQPs remain constitutively in the plasma membrane. A striking exception is AQP2 of kidney tissue which undergoes vasopressin-regulated exo- and endocytosis (Verkman 2011). To assess AQP-function, typical in vitro water flux assays are performed (chapter 1.1.3.3).
In the following chapters, the physiological function of aquaporins as well as their molecular
architecture are briefly described. Moreover, an overview about potential AQP-inhibitors is
given. The last chapter deals with several pathophysiological conditions that are due to
defective function or expression of aquaporins.
20
1.2.1 Physiological relevance of water-selective channels
AQPs are involved in the regulation of transepithelial fluid permeation and mediate processes like urine concentration or the secretion of gland fluids (Verkman 2011). However, their physiological impact goes far beyond this obvious task. For instance, AQPs are expressed in electrically excitable tissues in supportive cells adjacent to excitable cells, e.g. in astrocytes but not neurons of the brain. Impaired vision (Li et al. 2002), hearing (Li and Verkman 2001) and olfaction (Lu et al. 2008) were observed in AQP4-null mice via electrophysiological measurements. Besides the contribution of aquaporins to neural signaling, they have also a share in cell migration. Various cell types which were transfected with AQPs featured an increased cell migration (Verkman 2011). Regardless of the exact biological mechanism, AQP-facilitated cell migration is a general phenomenon involved not only in angiogenesis but also in tumor spread, wound healing and immune cell chemotaxis. Many types of tumor cells suffer from AQP-overexpression. It is supposed that the raised level of aquaporins enhance the ability of tumor cells to spread across blood vessels and to invade locally (Hu and Verkman 2006). Furthermore, aquaglyceroporins participate in important physiological processes. AQP3 plays a crucial role in skin hydration (Hara et al. 2002; Ma et al. 2002).
Reduced epidermal glycerol permeability in AQP3-lacking mice led to reduced skin hydration and elasticity. AQP7, also an aquaglyceroporin, is directly involved in fat metabolism (Hara- Chikuma et al. 2005; Hibuse et al. 2005). It was shown that AQP7-null mice reveal a notably progressive increase in fat mass and adipocyte hypertrophy, accumulating glycerol in their adipocytes. Consequently, the correlation between AQPs and numerous biological activities makes them very attractive as potential drug targets which could be exploited for future clinical benefits. For example, treatments modulating AQP-expression or -function could act as diuretics, and in therapies for brain swelling, glaucoma, epilepsy, obesity and even cancer.
This enormous potential of AQP-based drug development highlights the great importance of engineering new assays for the analysis of transepithelial water flux in order to assess AQP-function and thus, to find novel and better AQP-modulators.
1.2.2 Molecular architecture of aquaporins
AQPs are a family of small (~ 30kDa/monomer), integral membrane proteins consisting of
four monomers which assemble to form tetramers. Each monomer is made up of six
membrane-spanning helical domains and two short segments surrounding cytoplasmic and
extracellular vestibules, respectively. These vestibules are decorated by a narrow aqueous
21
pore of 25 Å in length. Fig. 1.6 shows the structure of the well-studied AQP1. Several molecular dynamics simulations suggest that a single-file transport of water occurs through a narrow pore in each monomer. Thus, there is biophysical limitation on the efficiency with which AQPs can transport water, so that aquaporins have to be present in the plasma membrane at a high density to improve membrane water permeability in a significant way.
Therefore, AQP-expressing cells contain at least several thousands of water channels per µm
2of membrane, whereas ion channels only appear with a density not exceeding ten channels per µm
2of membrane (Verkman 2005; Verkman 2011; Verkman and Mitra 2000).
In virtually all organisms, proton gradients across epithelial barriers act as the primary energy source for the synthesis of ATP. For this reason, electrochemical gradients have to be strictly preserved. It is crucial that transepithelial water flux through AQPs is not coupled to proton transport. The stringent selectivity of aquaporins is due to two important regions within the channel:
(I) The first stage of selectivity filter is located in the central part of the channel and is referred to as the NPA region. Two conserved Asn-Pro-Ala (NPA) motifs reside on opposite sides of the AQP-monomer spanning a strong electrostatic field along this region. Electrostatic interactions are the prevailing mechanism of proton exclusion in AQPs (Groot and Grubmüller 2005).
Fig. 1.6:The structure of AQP1. All AQPs are homotetramers made up of four monomeric channels, as shown in (A) top view and (B) side view. (C) The monomeric channels consist of six transmembrane helices connected by five loops which are referred to as A to E in AQP1. Loops B and E contain the highly conserved NPA motifs, which fold back into the channel and meet at the center. The ar/R constriction region which is the narrowest part of the channel is located approximately 7 Å extracellular to the NPA region. The image is taken from literature (Groot and Grubmüller 2005).
22
(II) The second stage is formed by the aromatic/arginine (ar/R) constriction region and is located on the extracellular face of the channel. The ar/R constriction site serves both, as a steric and electrostatic filter. This region is the narrowest part of AQPs with a pore size of 2.8 Å. Aquaglyceroporins have a less-constricted ar/R region with a size of 3.4 Å (Verkman 2005; Verkman 2011). Due to its narrow character, the ar/R selectivity filter hinders larger molecules from passing through the channel. Additionally, it serves as a barrier for small hydrophobic solutes (Hub and Groot 2008).
AQPs achieve their water permeability through a fine-tuned choreography of hydrogen bonds. By that, the activation barrier is lowered to a large extent and hence, high permeability rates for water molecules are generated, despite the hydrophobic character of the pore (Groot and Grubmüller 2005).
1.2.3 Inhibitors of aquaporins
The identification of AQP-modulators has turned out to be unexpectedly challenging.
Although a pool of AQP influencing compounds is known, their clinical applicability is low due to several side effects and a lack of selectivity. So far, no relevant inhibitors for aquaglyceroporins have been discovered, whereas most compounds target classical aquaporins (Almeida et al. 2014). The first potent AQP-inhibitor was found to be HgCl
2(Preston et al. 1992; Preston et al. 1993; Yukutake et al. 2008). The inhibition of mercury has been attributed to the formation of a mercaptide bond with cysteine residue 189 located in the pore-forming region. Some inorganic salts (ZnCl
2, NiCl
2, CuSO
4) have been reported to affect the efficiency of certain aquaporins (Yukutake et al. 2009; Zelenina et al. 2004). Furthermore, quaternary ammonium salts like tetraethylammonium (TEA) are supposed to interact with AQP1 (Brooks et al. 2000; Detmers et al. 2006). Silver (AgNO
3) and gold (HAuCl
4) compounds are powerful AQP-blockers. Their inhibitory effect is comparable to that of HgCl
2(Niemietz and Tyerman 2002). As for mercury, the mechanisms of silver and gold inhibition
are most likely due to their ability to interact with sulfhydryl groups within the channel. In
recent years a new class of potential AQP-modulators has been described. Coordination gold
complexes are predicted to exhibit improved selectivity combined with less cytotoxicity. The
exploration of such gold complexes as possible AQP-modulators may open the gate to novel
approaches for targeting AQP-function and to new drug families (Almeida et al. 2014).
23