Supplementary Information 1
Response of the North Atlantic surface and intermediate ocean structure to climate warming
2
of MIS 11
3
4
Evgenia S. Kandiano1,2*, Marcel T. J. van der Meer1, Stefan Schouten1,3 Kirsten Fahl4, Jaap
5
S. Sinninghe Damsté1,3, and Henning A. Bauch2,4
6
7
1Department of Marine Microbiology and Biogeochemistry, NIOZ Netherlands Institute for
8
Sea Research, and Utrecht University, Den Burg, NL-1790 AB, the Netherlands
9
2Department of Paleoceanography, GEOMAR Helmholtz Centre for Ocean Research Kiel,
10
Kiel, D-24148, Germany
11
3Faculty of Geosciences, Utrecht University, Utrecht, NL-3584 CD, the Netherlands
12
4Department of Marine Geology, Alfred Wegener Institute Helmholtz Centre for Polar and
13
Marine Research, Bremerhaven, D-27568, Germany
14
15
*To whom correspondence should be addressed. Email: ekandiano@geomar.de
16
17
Core sampling
18
The core section covering the full interglacial period of MIS 11ss was sampled continuously
19
as 0.5 cm slabs while the section covering Termination V was samples as 1 cm slabs. All
20
samples were freeze dried. For organic and inorganic analyses different sets of samples
21
were used. All inorganic analyses were produced with 1-cm resolution while GDGT-based
22
TEX86 SST reconstructions were performed in 2 cm resolution and increased to 1 cm
23
resolution where necessary. Alkenone distributions and hydrogen isotope compositions were
24
measured on the same sample set as GDGT, but only in those samples where sufficient
25
amounts of alkenones were found. For comparison, all organic analyses have also been
26
performed on the core top sample (Fig. S1A, B; See also section Methods).
27
1
28 29 30 31 32 33 34 35 36 37 38 39 40 41 42
Sample preparation for inorganic analyses
43
Freeze dried samples were washed over 63 µm mesh-sized sieve in deionized water, dried
44
in an oven under 40 °C. Fraction >150 µm was used.
45 46
Sample preparation for organic analyses
47
Total lipid extracts from freeze-dried samples were generated using Accelerated Solvent
48
Extractor (DIONEX AS E350, 100 °C) with a mixture of dichloromethane (DCM): methanol
49
(MeOH, 9:1 v/v). The extracts were separated into apolar, alkenone and polar fractions using
50
Al2O3 columns with hexane: DCM (9:1 v/v), hexane:DCM (1:1 v/v), and DCM:MeOH (1:1 v/v),
51
respectively.
52 53
Age model
54
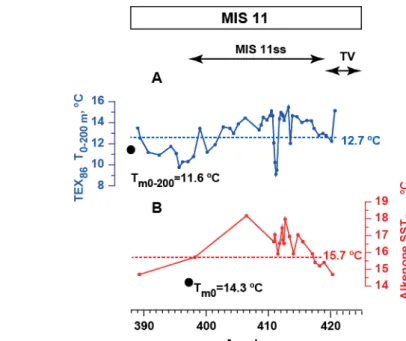
Figure S1.Temperature reconstructions during MIS 11 in comparison with modern values and temperature reconstructions in the core top sample. A:
TEX
86L temperaturereconstructions for 0-200 m water depth along with modern summer temperature of the same depth indicated by black dot (11.6 °C26), dashed line indicates the result of the
TEX
86L (0-200 m) temperature reconstruction from the core top sample (12.7 °C). B:𝑈
37𝐾′ SST reconstructions for 0 m water depth along with modern summer temperature of the same depth indicated by black dot (14.3 °C26). Dashed line indicates the result of the𝑈
37𝐾′reconstruction from the core top sample (15.7 °C). MIS 11, MIS 11ss and Termination V (TV) are indicated on the top panel.2
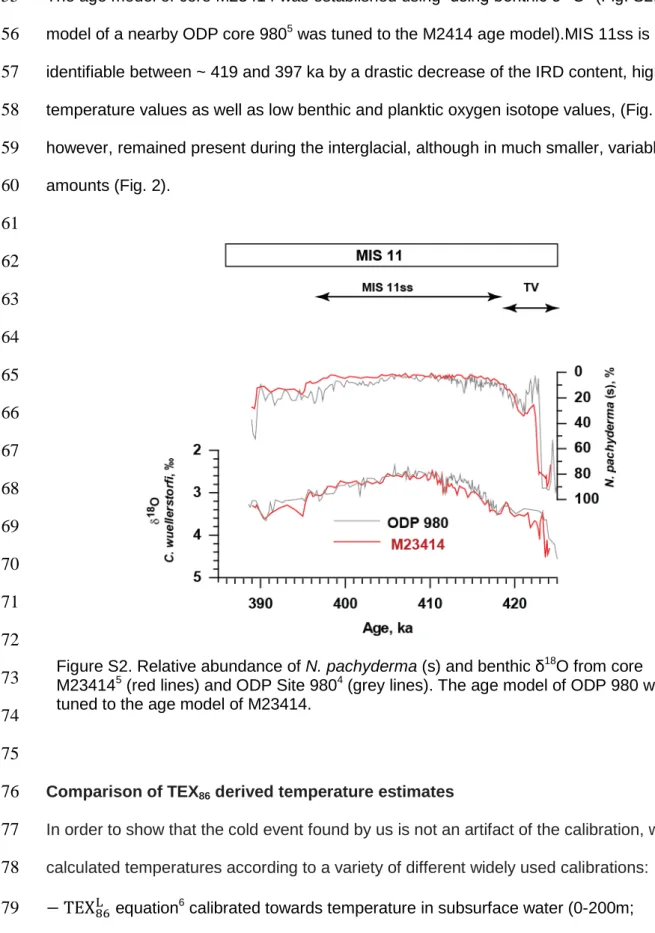
The age model of core M23414 was established using using benthic δ18O4 (Fig. S2; The age
55
model of a nearby ODP core 9805 was tuned to the M2414 age model).MIS 11ss is
56
identifiable between ~ 419 and 397 ka by a drastic decrease of the IRD content, high
57
temperature values as well as low benthic and planktic oxygen isotope values, (Fig. 2). IRD,
58
however, remained present during the interglacial, although in much smaller, variable
59
amounts (Fig. 2).
60 61 62 63 64 65 66 67 68 69 70 71 72 73 74 75
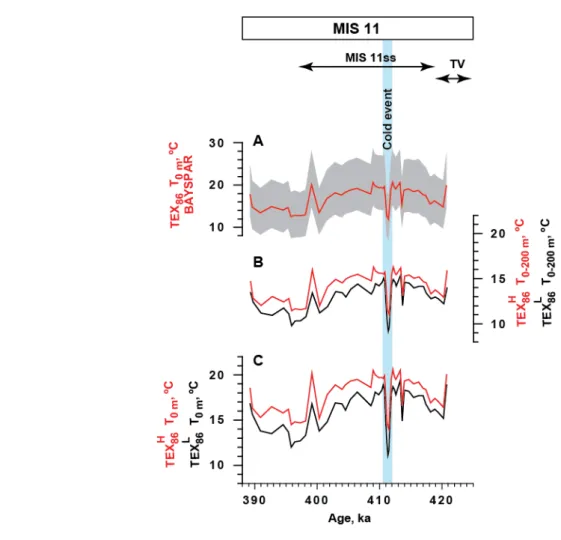
Comparison of TEX86 derived temperature estimates
76
In order to show that the cold event found by us is not an artifact of the calibration, we have
77
calculated temperatures according to a variety of different widely used calibrations:
78
− TEX
86L equation6 calibrated towards temperature in subsurface water (0-200m;79
T=50.8*log
TEX
86L +36.1, where T is temperature). This record is used in the main text;80
Figure S2. Relative abundance of N. pachyderma (s) and benthic δ18O from core M234145 (red lines) and ODP Site 9804 (grey lines). The age model of ODP 980 was tuned to the age model of M23414.
3
− TEX
86H equation7 calibrated towards temperature in subsurface water (0-200m;81
T
=54.7*logTEX86H +30.7, where T is temperature);82
− TEX
86H equation8 calibrated to SST (0 m; SST=68.4*logTEX
86H +38.69);83
− TEX
86L equation8 calibrated to SST (0 m; (SST=67.5*logTEX
86L +46.9);84
−
Bayspar calibration9 forTEX
86 calibrated to SST (0 m).85
Application of all calibrations yielded the same temperature trends but differed in absolute
86
values (Fig. S3).
87 88 89 90 91 92 93 94 95 96 97 98 99 100 101 102 103 104 105 106 107
Figure S3. Comparison of TEX86 temperature reconstructions derived from different calibrations. Blue bar indicates cold event. MIS 11 and Termination V (TV) are indicated on the top panel. A: Bayspar surface temperature reconstructions according to ref. 9.
Mean values are shown by the line while shaded area includes 90 % confidence interval;
B:
TEX
86L(black line) and TEX
86H (red line) temperature reconstructions for 0-200 m water depth layer according to ref. 6, 8; C:TEX
86L(black line) and TEX
86H(red line)
temperature reconstructions for 0 m water depth according to ref. 8.4
BIT index
108
The TEX86 proxy is known to be affected by terrestrial input which in this region will be mainly
109
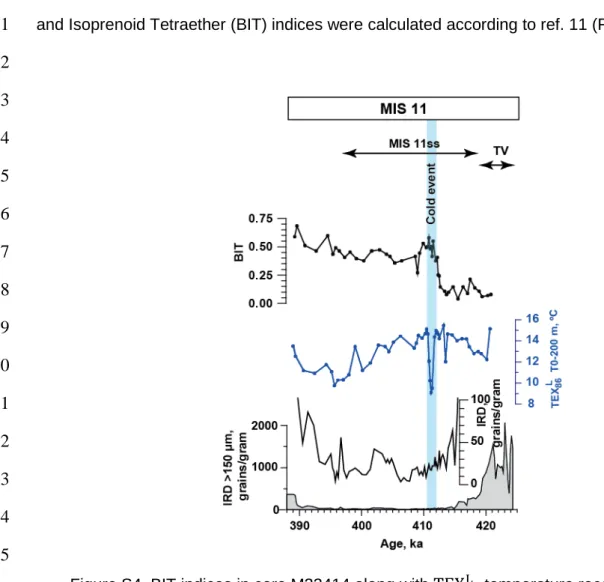
transported by ice rafted debris10. To constrain the effect of terrestrial input, the Branched
110
and Isoprenoid Tetraether (BIT) indices were calculated according to ref. 11 (Fig. S4).
111 112 113 114 115 116 117 118 119 120 121 122 123 124 125 126 127 128 129
The BIT index shows relatively high values for most of MIS 11, possibly due to IRD input10.
130
Alternatively, the organic matter in the sediments were exposed to oxygen and thus oxidized.
131
Oxic degradation is known to increase the BIT index due to the better preservation of
132
terrestrial GDGTs12. However, the impact of allochtonous organic matter input on the
133
obtained temperature reconstruction is likely relatively small as we found only a low
134
correlation between BIT and
TEX
86 0−200m L temperature estimates for the total MIS 11 period135
Figure S4. BIT indices in core M23414 along with
TEX
86L temperature reconstructions for 0-200 m water depth layer and IRD5 (note different scales for IRD on the left and right panels) across MIS 11. Blue bar indicates cold event. MIS 11 and Termination V (TV) are indicated on the top panel.5
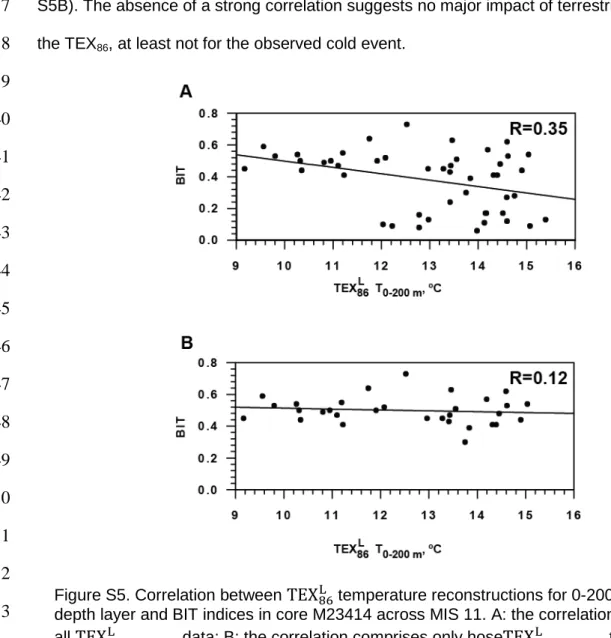
(Fig. S5A) as well as for its later part, where the BIT exceed the cut off value of 0.313 (Fig.
136
S5B). The absence of a strong correlation suggests no major impact of terrestrial GDGTs on
137
the TEX86, at least not for the observed cold event.
138 139 140 141 142 143 144 145 146 147 148 149 150 151 152 153 154 155
Comparison of the two alkenone
𝑼
𝟑𝟕𝑲′ SST records156
Comparison between our new results and those of a previously published
𝑈
37𝐾′ SST record of157
the same core3 ( Fig. 2, black line) displays a temperature difference of on average 2°C. This
158
difference is likely due to the slight differences between the extraction method and
159
instrumental conditions used in the different laboratories, in combination with very low
160
alkenone concentrations (< 300ng/g sed). These interlaboratory differences have already
161
Figure S5. Correlation between
TEX
86L temperature reconstructions for 0-200 m water depth layer and BIT indices in core M23414 across MIS 11. A: the correlation includes allTEX
86L 0−200m data; B: the correlation comprises only hoseTEX
86L 0−200mtemperature estimates in which BIT indices exceed the critical value of 0.313.6
been discussed14. However, since we mainly focus on the trends in the temperature record,
162
this offset is not affecting our interpretations.
163 164
Salinity reconstructions derived from δD analysis of alkenones
165
Culture experiments have shown that the δD value of alkenones is mainly dependent on
166
salinity and the hydrogen isotopic composition of growth water which is also related to
167
salinity and in a minor degree on a growth rate of alkenone producers15,16. A change of 4-5 ‰
168
in alkenone δD corresponds to a change of one salinity unit and combines both the biological
169
response to salinity and a 1.7 ‰ δD change of the water15,17. In natural environments the
170
relation between salinity and δD of water is not constant in space and time and can change
171
with global ice volume changes due to its effect on a δD water composition18, but also with
172
changes in evaporation and precipitation balances. The observed intra-interglacial MIS 11ss
173
cold event occurred at the very end of the global ice volume decrease and, therefore, the
174
effect of ice volume changes on alkenone δD composition is most likely negligible. According
175
to the modern distribution of δD values in the North Atlantic, the waters of the NAC have up
176
to 6 ‰ higher δD values in comparison to the adjacent SPG waters19. If, by analogy to the
177
modern state, we assume that the maximum δD depletion in surface waters at the site of
178
M23414 associated with the MIS 11ss cold event might reach 6 ‰ due to the expansion of
179
the western waters to the east, this would agree well with the 15 ‰ drop of alkenone δD
180
observed during the cold event as based on the relation described in ref. 15.
181
182
Another cause of a sharp change in the alkenone δD values preceding the cold event could
183
be a change in a species composition of alkenone producers. The Mid-Pleistocene species
184
composition of coccolithophores at Site 980, in the close vicinity to site M23414, revealed
185
only one dominant species Gephyrocapsa oceanica which produces alkenones20. However, it
186
was also shown that during cold episodes the cold water indicative species Coccolithus
187
pelagicus can occur in this region in relatively large amounts. Therefore this species
188
potentially could compete with G. oceanica during the MIS 11ss cold event21,21. Although it is
189
7
thought that C. pelagicus does not produce alkenones, a correlation between the abundance
190
of this species and alkenone amounts has been reported22. Therefore, a contribution of
191
another species to changes in alkenone δD cannot completely be ruled out.
192 193
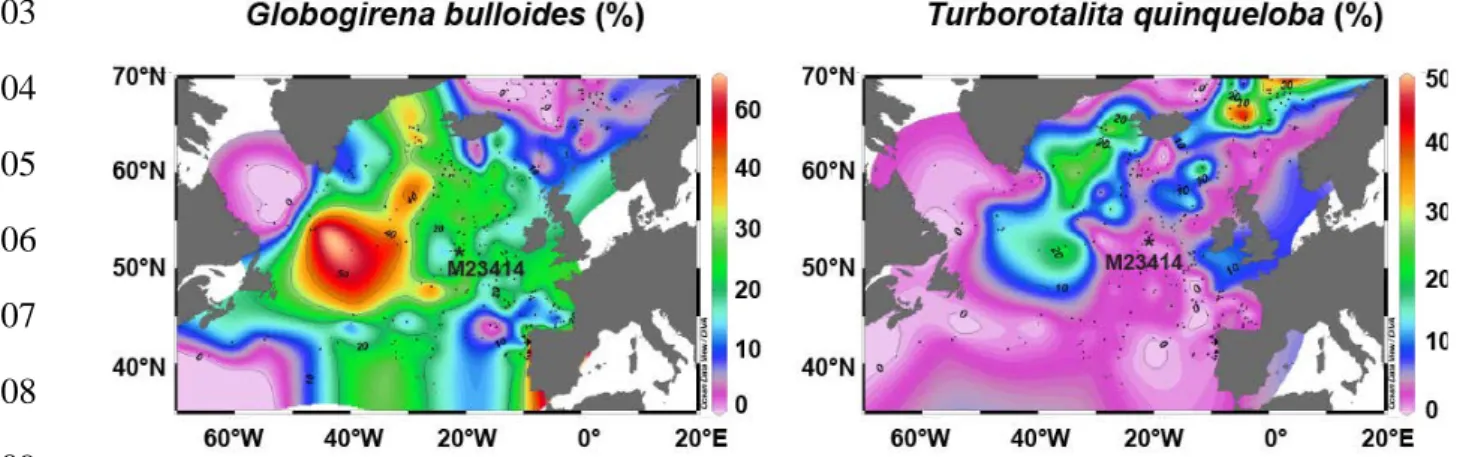
Ecological preferences of planktic foraminiferal species G. bulloides and T.
194
quinqueloba
195
For this study two species with certain ecological preferences were selected: G. bulloides
196
and T. quinqueloba. Geographical distributions of both species are given in Fig. S6.
197
According to core top samples foraminiferal data base, both species have elevated
198
abundances in relatively cold and fresh productive waters of the SPG situated westward from
199
site M2341423. Their elevated abundances were also found at frontal zones in the Nordic
200
seas both in surface sediments24 and water column25.
201
202 203 204 205 206 207 208 209 210 211 212
References
213
1 Helmke, J. P. & Bauch, H. A. Glacial-interglacial relationship between carbonate
214
components and sediment reflectance in the North Atlantic. Geo-Marine Letters 21, 16-
215
22 (2001).
216
Figure S6. Geographical distribution of planktic foraminiferal species T. quinqueloba and G.
bulloides. Map was created using the free program Ocean Data View, Version ODV 4.7.2 (available at web site odv.awi.de) and distribution of planktic foraminifera in core top samples according to ref. 23.
8
2 Helmke, J. P., Schulz, M. & Bauch, H. A. Sediment color record reveals patterns of
217
millennial-scale climate variability over the last 500,000 years. Quat. Res. 57, 16-22
218
(2002).
219
3 Kandiano, E. S. et al. The meridional temperature gradient in the eastern North Atlantic
220
during MIS 11 and its link to the ocean-atmosphere system. Palaeogeography
221
Palaeoclimatology Palaeoecology 333, 24-39 (2012).
222
4 Kandiano, E. S. & Bauch, H. A. Phase relationship and surface water mass change in
223
the northeast Atlantic during marine isotope stage 11 (MIS 11). Quat. Res. 68, 445-45
224
(2007).
225
5 Oppo, D. W., McManus, J. F. & Cullen, J. L. Abrupt climatic events 500,000 to 340,000
226
years ago: Evidence from subpolar North Atlantic sediments. Science 279, 1335-1338
227
(1998).
228
6 Kim, J.-H. et al. Holocene subsurface temperature variability in the eastern Antarctic
229
continental margin. Geophysical Research Letters 39, 10.1029/2012gl051157 (2012).
230
7 Kim, J.-H. et al. Pronounced subsurface cooling of North Atlantic waters off Northwest
231
Africa during Dansgaard–Oeschger interstadials. Earth and Planetary Science Letters
232
339, 95-102 (2012).
233
8 Kim, J.-H. et al. New indices and calibrations derived from the distribution of
234
crenarchaeal isoprenoid tetraether lipids: Implications for past sea surface temperature
235
reconstructions. Geochimica et Cosmochimica Acta 74, 4639-4654 (2010).
236
9 Tierney, J. E. & Tingley, M. P. A Bayesian, spatially-varying calibration model for the
237
TEX86 proxy. Geochimica et Cosmochimica Acta 127, 83-106 (2014).
238
10 Schouten, S., Ossebaar, J., Brummer, G. J., Elderfield, H. & Damsté, J. S. S. Transport
239
of terrestrial organic matter to the deep North Atlantic Ocean by ice rafting. Organic
240
Geochemistry 38, 1161-1168 (2007).
241
11 Hopmans, E. C. et al. A novel proxy for terrestrial organic matter in sediments based
242
on branched and isoprenoid tetraether lipids. Earth and Planetary Science Letters 224,
243
107-116 (2004).
244
9
12 Huguet, C. et al. Selective preservation of soil organic matter in oxidized marine
245
sediments (Madeira Abyssal Plain). Geochimica Et Cosmochimica Acta 72, 6061-6068
246
(2008).
247
13 Weijers, J. W. H., Schouten, S., Spaargaren, O. C. & Damsté, J. S. S. Occurrence and
248
distribution of tetraether membrane lipids in soils: Implications for the use of the TEX86
249
proxy and the BIT index. Organic Geochemistry 37, 1680-1693 (2006).
250
14 Rosell-Melé, A. et al. Precision of the current methods to measure the alkenone proxy
251
U-37(K ') and absolute alkenone abundance in sediments: Results of an interlaboratory
252
comparison study. Geochemistry Geophysics Geosystems 2, 1046 (2001).
253
15 Schouten, S. et al. The effect of temperature, salinity and growth rate on the stable
254
hydrogen isotopic composition of long chain alkenones produced by Emiliania huxleyi
255
and Gephyrocapsa oceanica. Biogeosciences 3, 113-119 (2006).
256
16 M'Boule, D. et al. Salinity dependent hydrogen isotope fractionation in alkenones
257
produced by coastal and open ocean haptophyte algae. Geochimica Et Cosmochimica
258
Acta 130, 126-135 (2014).
259
17 van der Meer, M. T. J., Benthien, A., Bijma, J., Schouten, S. & Damsté, J. S. S.
260
Alkenone distribution impacts the hydrogen isotopic composition of the C-37:2 and C-
261
37:3 alkan-2-ones in Emiliania huxleyi. Geochimica Et Cosmochimica Acta 111, 162-
262
166 (2013).
263
18 Rohling, E. J. Paleosalinity: confidence limits and future applications. Marine Geology
264
163, 1-11 (2000).
265
19 Englebrecht, A. C. & Sachs, J. P. Determination of sediment provenance at drift sites
266
using hydrogen isotopes and unsaturation ratios in alkenones. Geochimica Et
267
Cosmochimica Acta 69 (2005).
268
20 Marino, M., Maiorano, P. & Flower, B. P. Calcareous nannofossil changes during the
269
Mid-Pleistocene Revolution: Paleoecologic and paleoceanographic evidence from
270
North Atlantic Site 980/981. Palaeogeography Palaeoclimatology Palaeoecology 306,
271
58-69 (2011).
272
10
21 Solignac, S., de Vernal, A. & Giraudeau, J. Comparison of coccolith and dinocyst
273
assemblages in the northern North Atlantic: How well do they relate with surface
274
hydrography? Marine Micropaleontology 68, 115-135 (2008).
275
22 Rosell-Melé, A., Comes, P., Müller, P. J. & Ziveri, P. Alkenone fluxes and anomalous
276
U-37(K)' values during 1989-1990 in the Northeast Atlantic (48 degrees N 21 degrees
277
W). Marine Chemistry 71, 251-264 (2000).
278
23 Kučera M et al. Reconstruction of sea-surface temperatures from assemblages of
279
planktonic foraminifera: multi-technique approach based on geographically constrained
280
calibration data sets and its application to glacial Atlantic and Pacific Oceans.
281
Quaternary Science Reviews 24, 951-998 (2005).
282
24 Johannessen, T., Jansen, E., Flatoy, A. & Ravelo, A. C. in Carbon Cycling in the
283
Glacial Ocean: Constrains of the Oceans's Role in Global Change. (eds R. Zahn, T.F.
284
Pedersen, M.A. Kaminski, & L. Labeyrie) 61-85 (Springer, 1994).
285
25 Carstens, J., Hebbeln, D. & Wefer, G. Distribution of planktic foraminifera at the ice
286
margin in the Arctic (Fram Strait). Marine Micropaleontology 29, 257-269 (1997).
287
26 Locarnini, R.A. et al. World Ocean Atlas 2013 Volume 1 Temperature. eds Levitus S
288
NOAA Atlas NESDIS 73 40 pp. (2013).
289 290 291
11