Magnetooptical study of Zeeman effect in Mn modulation-doped InAs/InGaAs/InAlAs quantum well structures
Ya. V. Terent'ev, S. N. Danilov, H. Plank, J. Loher, D. Schuh, D. Bougeard, D. Weiss, M. V. Durnev, S. A.
Tarasenko, I. V. Rozhansky, S. V. Ivanov, D. R. Yakovlev, and S. D. Ganichev
Citation: Journal of Applied Physics 118, 113906 (2015); doi: 10.1063/1.4931154 View online: http://dx.doi.org/10.1063/1.4931154
View Table of Contents: http://scitation.aip.org/content/aip/journal/jap/118/11?ver=pdfcov Published by the AIP Publishing
Articles you may be interested in
Magneto-photoluminescence of InAs/InGaAs/InAlAs quantum well structures Appl. Phys. Lett. 104, 101111 (2014); 10.1063/1.4868644
Strain effects, electronic parameters, and electronic structures in modulation-doped In x Ga 1−x As/In y Al 1−y As coupled step-rectangular quantum wells
J. Appl. Phys. 94, 7621 (2003); 10.1063/1.1631078
Magneto-optical investigations of single self-assembled InAs/InGaAlAs quantum dashes Appl. Phys. Lett. 82, 2799 (2003); 10.1063/1.1570518
Magnetotransport, magneto-optical, and electronic subband studies in In x Ga 1−x As/In y Al 1−x As modulation- doped strained double quantum wells
J. Appl. Phys. 82, 4388 (1997); 10.1063/1.366165
Identification of room temperature photoluminescence in pseudomorphic modulation-doped AlGaAs/InGaAs/GaAs quantum wells
J. Appl. Phys. 82, 1345 (1997); 10.1063/1.365908
Magnetooptical study of Zeeman effect in Mn modulation-doped InAs/InGaAs/InAlAs quantum well structures
Ya. V.Terent’ev,1,2S. N.Danilov,1H.Plank,1J.Loher,1D.Schuh,1D.Bougeard,1D.Weiss,1 M. V.Durnev,2S. A.Tarasenko,2,3I. V.Rozhansky,2,3S. V.Ivanov,2D. R.Yakovlev,2,4 and S. D.Ganichev1
1Physics Department, University of Regensburg, 93040 Regensburg, Germany
2Ioffe Physical-Technical Institute, 194021 St. Petersburg, Russia
3St. Petersburg State Polytechnic University, 195251 St. Petersburg, Russia
4Experimentelle Physik 2, Technische Universit€at Dortmund, 44227 Dortmund, Germany
(Received 12 May 2015; accepted 6 September 2015; published online 18 September 2015) We report on a magneto-photoluminescence (PL) study of Zeeman effect in Mn modulation-doped InAs/InGaAs/InAlAs quantum wells (QW). Two PL lines corresponding to the radiative recombi- nation of photoelectrons with free and bound-on-Mn holes have been observed. In the presence of a magnetic field applied in the Faraday geometry, both lines split into two circularly polarized com- ponents. While temperature and magnetic field dependence of the splitting are well described by the Brillouin function, providing an evidence for exchange interaction with spin polarized manga- nese ions, the value of the splitting exceeds by two orders of magnitude the value of the giant Zeeman splitting estimated for the average Mn density in QW obtained by the secondary ion mass spectroscopy.VC 2015 AIP Publishing LLC. [http://dx.doi.org/10.1063/1.4931154]
I. INTRODUCTION
Implementation of spintronics concepts requires semi- conductor heterostructures with evident magnetic properties.
To enhance the interaction between carrier spins and a mag- netic field and to achieve ferromagnetic spin ordering doping of materials with magnetic ions is required.1–5Diluted mag- netic semiconductors (DMS) based on narrow-gap III-V compounds, and, in particular, InMnAs, are considered to be promising candidates for application due to a relatively high Curie temperature and the strong spin-orbit interaction.6,7 While InAs-based DMS systems with strong spin-orbit coupling have been realized and show very interesting mag- netotransport8–10 and opto-electronic properties,11–15 direct measurements of the giant Zeeman splitting by means of polarized magneto-photoluminescence (PL) have not been reported so far. This is primary caused by the fact that the doping of III-V compounds by Mn atoms generates numer- ous lattice defects (even if they are partially removed by annealing7) and, consequently, to a drastic decrease of the radiation efficiency.
In this paper, we report on the observation of circularly polarized magneto-PL from high-quality DMS heterostruc- tures InAs/In0.75Ga0.25As/In0.75Al0.25As:Mn and systematic study of the Zeeman effect in this system. Our results show that efficient photoluminescence can be excited in such structures with Mn modulation-doped layer introduced in close proximity to InAs QW. The enhanced magnetic proper- ties come from Mn segregation from modulation-doped bar- rier, which yields high quality DMS structures as confirmed by quantum Hall experiments.9 In zero magnetic field, the low-temperature PL from QW is contributed by two lines separated by 25 meV. The analysis shows that the observed PL lines stem from the recombination of free and bound-on- Mn holes with photoexcited electrons. A magnetic field,
applied in the Faraday geometry, results in the splitting of both PL lines into two circular-polarized components with the opposite helicity, reflecting spin splitting of the energy levels in QW. The splitting is strongly temperature depend- ent and, at low temperatures, saturates with the increase of magnetic field. Both temperature and magnetic field depend- ences are well fitted by the Brillouin function being typical for the magnetization of DMSs controlled by the exchange interaction of carriers with Mn ions. However, the value of the detected line splitting exceeds by two orders of magni- tude the value of the giant Zeeman splitting estimated for the average Mn density in QW obtained by the secondary ion mass spectroscopy. Possible reasons of this striking observa- tion are discussed.
II. SAMPLES
The InAs/In0.75Ga0.25As/In0.75Al0.25As QW heterostruc- tures investigated were fabricated by molecular beam epi- taxy (MBE) on a fully relaxed metamorphic InxAl1xAs/
(001)GaAs compositionally graded buffer where the In content xis increased stepwise from 0.05 to 0.75 over 1lm of layer thickness. Such an approach on structure design enables the fabrication of high quality defect-free and strain relaxed virtual substrates of high indium content that allow an effective collection of photogenerated carriers into the QW.16
All experimental samples share the same QW design.
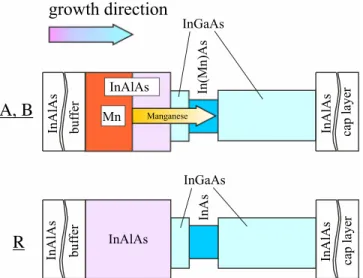
Following the band lineups sketched in Fig.1an In0.75Ga0.25As shallow QW embedded in between In0.75Al0.25As barriers fea- tures an asymmetrically inserted and compressively strained InAs channel of 4 nm. The distances between the InAs channel edges and the left and right InAlAs/InGaAs interfaces are 2.5 nm and 13.5 nm, respectively. Structures are finished with a 36-nm-thick InAlAs cap layer. Manganese containing
0021-8979/2015/118(11)/113906/7/$30.00 118, 113906-1 VC2015 AIP Publishing LLC
samples possess 7 nm layers of homogeneously Mn doped In0.75Al0.25As that are inserted on the substrate side of the QW region (“inverted” doped QWs) and separated from the QW by an In0.75Al0.25As barrier of 5 nm thickness. Due to a segregation effect during the MBE growth process, a significant amount of manganese resides in the vicinity of the InAs QW. For the sample, referred as A in this paper, Mn has been inserted for temperature of Mn effusion cell equal to 852C. A dopant con- centration not exceedingnMn¼21020cm3that results in a Mn concentration of about two orders of magnitude lower in the InAs QW as revealed by secondary ion mass spectrometry (SIMS).17 Hole density in InAs channel determined by Hall effect measurements was 1012cm2atT¼4.2 K. While having the same structure design, sample B was grown for substan- tially lower temperature of Mn effusion cell (653C). The lower cell temperature results in reduction of the segregation and, respectively, magnetic properties. This fact is supported by magnetotransport measurements, in particular, the strong reduction of colossal negative magnetoresistance (not shown), indicating a strong hole localization due to significant Mn con- centration in the well.9This effect makes determination of the mobility from Hall-measurements in these structures very chal- lenging. The high quality of the samples becomes, however, obvious at high magnetic fields where the same structures shows well defined quantum Hall steps and Shubnikov de Haas oscillations.9,17,18In addition to Mn doped QW samples A and B, an intentionally undoped structure R without any Mn imple- mentation was grown to serve as a reference.
III. EXPERIMENTAL TECHNIQUE
In our experiments, we have used an experimental setup designed to measure polarization resolved magneto-PL in the infrared (IR) wavelength regime (2–5lm). The setup includes a magnetooptical helium bath cryostat, a laser diode excitation source, an optical polarization system, and a gra- ting or Fourier spectrometer equipped with a nitrogen cooled IR photodetector. Spectra are recorded by using lock-in tech- nique. Magnetic fields up to 6 T were applied normally to the sample plain and along the wave vector of the emission, i.e.,
the experiment is done in Faraday geometry. The sample temperature can be varied from 2 up to 300 K. The laser diode, operating incwmode, emits at wavelengthk¼809 nm and is focused onto a 1 mm diameter spot at the surface of the sample. The excitation densityWexccan be changed from 0.5 to 20 W/cm2. The PL emission passes through a polarization system consisting of a quarter wavelength retardation ZnSe Fresnel rhomb and a linear polarizer having the optical axes crossed at an angle of 6 45 to select rþ or r polarized light.19
IV. EXPERIMENTAL RESULTS
In all samples, we detected photoluminescence signal, which increases linearly with the excitation density in the explored rangeWexcfrom 0.5 up to 20 W/cm2. Note that the signal from DMS samples was substantially weaker than that from the reference structure.
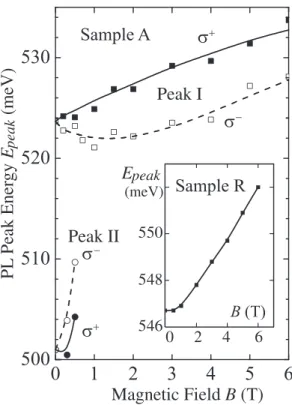
The PL band of sample A exhibits two contributions marked in Fig. 2(a) as peak I and peak II, which are sepa- rated from each other by about 25 meV. In a magnetic field, both peak I and peak II are blue shifted and split into two cir- cularly polarized components, Fig. 2(b). Note, while peak I is r polarized whereas the polarization of peak II is oppo- site. Splitting reaches a large value up to 6 meV, Fig. 3. At low temperatures, the magnetic field dependence of the energy splitting of peak I tends to saturate (see Fig.4).
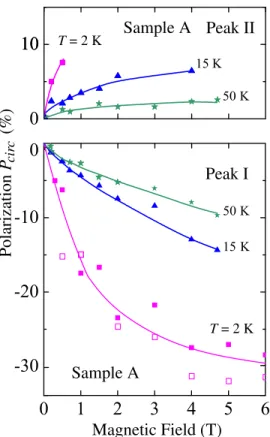
Figure 5 shows the magnetic field dependence of the polarization of both PL peaks at different temperatures. At
FIG. 1. Band diagrams of samples A, B, and R. GaAs substrate and the InAlAs graded buffer are not shown.
FIG. 2. PL spectra of sample A measured atT¼2 K andWexc¼10 W/cm2. (a) Spectra at zero magnetic field (solid line). Dotted lines shows Lorentzian fit with maxima at energies indicated as peaks I and II. (b) Circularly polar- ized magneto-PL spectra in the magnetic field of 1.5 T. Solid and dashed lines show the right- and left-handed polarized light, respectively. Plots are normalized to unity at the peak maximum.
113906-2 Terent’evet al. J. Appl. Phys.118, 113906 (2015)
low temperature, the polarization of peak I linearly increases with the magnetic field at small fields and saturates at high fields. The degree of circular polarization of peak I, Pcirc
¼IIþþI
þI100%, whereIþ=– is the intensity ofrþ=polar- ized emission, reaches30% atB¼6 T. With the tempera- ture increase, the polarization decreases and the saturation vanishes. Behavior of peak II is similar though the polariza- tion at low temperatures cannot be reliably determined due to the disappearance of peak II in the magnetic fields stron- ger than 1 T.
Sample B also demonstrates two PL lines (Fig. 6(a)).
However, peak II is poorly pronounced so that it cannot be analyzed. Peak I demonstrates a blue shift and a strong polar- ization in the magnetic field (Pcirc¼ 40% atB¼6 T). The sign of the polarization is the same as for sample A, but, in contrast to what was observed in sample A, peak I in sample B exhibits no splitting, see Fig.6(b), within our spectral re- solution of’0.3 meV.
In reference sample R, PL contour consists of a single narrow peak (indicated as peak I) while the second peak (peak II) is absent, Fig. 6(c). Application of a magnetic field results in a blue shift of the PL line and a strong circu- lar polarization which reachesþ54% in a magnetic field of 6 T (These data are presented in Ref.16). Similar to sample B, no energy splitting of the peak has been detected (see Fig.6(d)).
The large energy spitting and polarization of the peaks I and II measured in sample A, their magnetic field and tem- perature dependencies, as well as the absence of line splitting in samples R and B, reveal the important role of the exchange interaction between Mn ions and carriers confined in QW.
V. DISCUSSION
We begin with the origin of the peak I, which is observed in both DMS structures and the reference sample.
We ascribe this peak to radiative recombination of electrons and heavy holes occupying the ground levels e1 and hh1, respectively, in the QW. It has been studied in detail in non- magnetic structures similar to our sample R.16 It should be noted that excitonic effects are negligible in our experiments.
Indeed, the exciton binding energy is known to be of the order of 1 meV in InAs QWs whereas the Fermi energy due to the large hole concentration in studied Mn-doped samples is much larger. The density of photoelectrons contributing to radiative recombination is far lower and they seem to be localized with binding energies of a few meV. Localization centers can emerge due to inhomogenity of the InAs QW and presence of charged ions. This conclusion is confirmed by the quadratic magnetic field dependence of the PL peak energy clearly detected in the reference sample R for mag- netic fields up to about 3 T, see the inset in Fig. 3. While being superimposed by the Zeeman splitting the quadratic B–field dependence is also observed in the DMS structures, see the data for sample A in Fig.3.
Peak II, red-shifted to peak I and detected in Mn doped structures only, we attribute to optical transitions of conduction
FIG. 3. Energy positions ofrþandr components of peaks I and II as a function of the magnetic field measured in sample A at T¼2 K for Wexc¼10 W/cm2. The inset displays the corresponding dependence obtained in sample R. Lines are a guide for the eyes.
FIG. 4. Magnetic field dependence of the energy splittingDEof peaks I and II, measured in sample A at different temperatures. DE is defined as EþE, where Eþ= is the energy corresponding to therþ= polarized components. Dots represent the experimental data obtained at different tem- peratures. Lines correspond to the theoretical fit after Eqs.(6)and(8). The effective temperatureTMnis assumed to be equal to sample temperatureT, except atT¼2 K, where the best fit corresponds toTMn¼3:3 K.
electrons to the acceptor level of Mn ions, embedded in the QW. Indeed, a shallow manganese impurity band lying 23 meV below the InAs valence band edge was revealed in bulk (In,Mn)As.20Using this value as a reference for the Mn shallow acceptor binding energy in bulk InAs, we have cal- culated the binding energyEMn in the QW. For that we fol- lowed the method suggested in Ref. 21 and treated the acceptor in zero-range potential approximation. Within the approach the bound state wave function W satisfies the Schr€odinger equation
HLW¼EMnWþ2pdðrr0ÞW0; (1) where HL is the Luttinger Hamiltonian, r0 is the acceptor position. The 4-component function W0 is to be found from the boundary conditions. At the impurity siter0, the bound- ary condition for the angular averaged wavefunctionWreads
Wjr!r0 ¼ 1 jrr0ja
W0þoðjrr0jÞ; (2) whereais the parameter of the impurity attractive potential strength in the zero-range potential model. At the QW boun- daries, all components ofW were set to zero, thus implying the boundary conditions for the infinitely deep QW. Setting the QW width to infinity enabled us to find afrom Eqs.(1) and(2)withEMnbeing set to the Mn binding energy for the bulk. Restoring the QW width to its experimental value we obtained the binding energyEMnfrom Eqs. (1)and(2) with knowna. The calculation shows that for the system studied, containing the 4 nm wide QW,EMnis practically the same as that in bulk InAs, though in narrower QWs, it decreases swiftly. The particular valueEMn’25 meV obtained for Mn ion in the center of the 4 nm QW is in good agreement with the experimentally observed red shift of peak II relative to peak I. Attribution of peak II to the presence of Mn in QW is consistent with the fact that peak II is extremely weak in sample B having lower Mn content. Acceptor levels can be also probed by another technique, e.g., electron paramag- netic resonance.22,23
We now turn to the case of an applied magnetic field.
The magneto-PL of the manganese-free structure R was studied in detail in Ref.16. Here, we give only a brief sum- mary of the main results, which are important for the further discussion. The application of a magnetic field results in the spin splitting of both, conduction and valence bands. Optical recombination processes of the electron je1;þ1=2iwith the hole jhh1;3=2i or the electron je1;1=2i and the hole jhh1;þ3=2i are accompanied by the emission of r- and rþ-polarized photons, respectively, that are detected in the Faraday geometry of the experiment. The strongrþcircular polarization of the magneto-PL peak stems from the spin polarization of the nonequilibrium holes, characterized by a faster relaxation to the ground Zeeman level in comparison with electrons. The same polarization is observed in struc- tures with degenerate 2DEG, where the different electron spin states are equally populated.16The absence of the split- ting of the PL line into polarized components of different helicity was explained by the nearly equal magnitude of the electron and hole Lande factors in the system.16
FIG. 5. Polarization degreePcircof peaks I and II measured in sample A at T¼2 K forWexc¼10 W/cm2(solid symbols) and 5 W/cm2(open squares).
Lines are a guide for the eyes.
FIG. 6. PL spectra of sample B and R measured at T¼2 K for Wexc
¼10 W/cm2. (a) and (b) Spectra obtained for sample B in a magnetic field of 0 and 6 T, respectively. (c) and (d) The same dependences for sample R.
Solid and dashed lines show the right- and left-handed polarized light, respectively. Plots are normalized to unity at the peak maximum.
113906-4 Terent’evet al. J. Appl. Phys.118, 113906 (2015)
Within the suggested model, the polarization must invert its sign tor if we change type of conductivity of the QW from n-type to strong p-type. Indeed, at the condition of equally populated spin levels in the valence band inp-type samples, polarization is determined by electrons and recom- bination of electron at the ground stateje1;þ1=2i(for nega- tive electron g-factor) with the hole jhh1;3=2i must dominate. This process is accompanied by the emission of r-polarized photons. Samples A and B contain degenerated 2DHG; thus, r polarization of peak I detected from these samples is consistent with the model. Zero splitting of circu- lar polarized PL components in sample B should be obvi- ously attributed to vanishingly small Mn content in the InAs QW.
In contrast to sample B, sample A provides clear evi- dence that free carriers interact via exchange with Mn ions embedded in the InAs QW. Indeed, application of a magnetic field results in a large splitting of peak I into circularly polar- ized components (Fig.4) which is accurately described by the Brillouin function in a wide temperature range (fitting details are given below). The splitting tends to saturate in magnetic fields higher than 3–4 T at the lowest achieved temperature of 2 K and decreases rapidly if temperature is raised above10 K. The polarization dependence on mag- netic field and temperature is similar to that of the splitting, Fig.5.
To clarify a possible influence of photoexcitation induced carrier heating on polarization degree, we measured Pcircfor different excitation power varying in the range from 5 to 10 W/cm2. Figure5(bottom panel) shows magnetic field dependence ofPcircobtained at excitation powerWexc¼5 to 10 W/cm2for peak I in sample A atT¼2 K. This and other data reveal that varying the excitation power in the examined range does not demonstrate any noticeable effect on PL polarization even at low temperatures. Thus, the contribution of light heating can be considered as negligible.
We note that all the investigated structures show a polar- ization degree which is considerably below 100% even at T¼2 K andB¼6 T although the dependencePcircvsBtends to saturate. This fact can be ascribed to the interplay between the short lifetime of photogenerated carriers compared to the
spin relaxation time. In the particular case of p-type QWs, where the holes are unpolarized and the PL polarization is determined solely by the electron spin polarization, the PL polarization is given by Pc¼ 2Sð0Þe sr=ðsrþssÞ. Here, Sð0Þe is the average electron spin in thermal equilibrium, and sr
and ss are the electron lifetime and spin relaxation time, respectively.
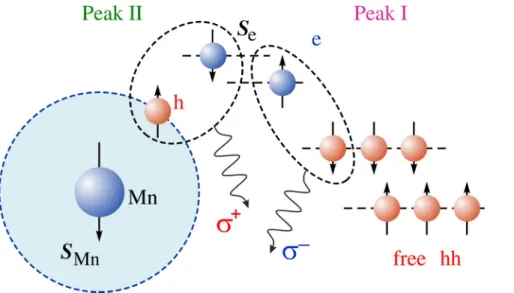
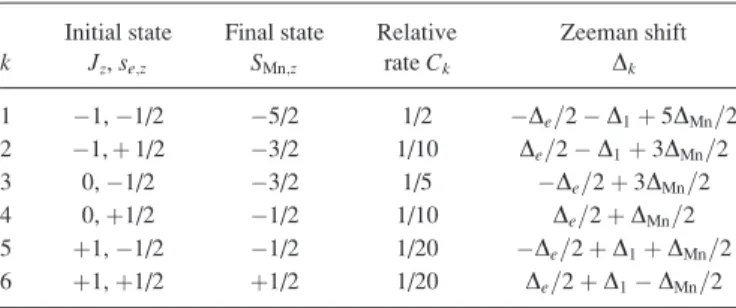
Now we turn to analysis of experimental data in the frame of common approach used for description of exchange interaction in DMS. As addressed above, peak II is attributed to the optical transitions between photoelectrons and holes bound to Mn ions (see Fig. 7), which can be schematically described as
eþ ðhþMnÞ !cþMn; (3)
where the symbols e, h, andcdenote an electron, hole, and photon, respectively. Mn ion and the hole bound to Mn are antiferromagnetically coupled. In the magnetic field, the bound-hole-Mn complex gets polarized in such a way that the hole spin points along the field direction. Recombination of spin polarized holes with electrons leads to rþ circular polarization of peak II.
Due to the strong p-d exchange coupling, the ground state of the bound-hole-Mn complex is described by the total angular momentum J¼1 and is three-fold degenerate in the projection Jz at zero magnetic field.24 A conduction-band electron, in contrast, has spin se¼1=2, and each state is two-fold degenerate. Thus, there are six different initial states for the processes described by Eq.(3). The final elec- tron state of Mn is six-fold degenerate in the projections of the Mn spinSMn¼5=2. The allowed optical transitions emit- ting rþ-polarized radiation (labeled by the index k¼1…6) and their relative intensities Ck are summarized in Table I.
The transitions allowing the emission of r-polarized pho- tons can be obtained from TableIby simultaneous inverting the sign ofJz,se;zandSMn;z.
In an external magnetic field, the emission line splits into 12 components, each of them being either rþ- or r-polarized. The corresponding Zeeman shifts of the rþ-polarized components are listed in TableI. In a real QW
FIG. 7. Sketch of the optical transitions contributing to peaks I and II in mag- netic field. Only transitions contributing to dominant circularly polarized com- ponents of peaks I and II are depicted.
structure, however, individual components may not be spectrally resolved due to considerable inhomogeneous broadening. Therefore, the measured disorder-broadened spectrum of therþ-polarized PL is given by
IþðhxÞ ¼X6
k¼1
CkfkDðhxDkÞ; (4) wherefkis the population of the initial state with the indexk andDðhxÞis the PL contour at zero magnetic field. To first order in the Zeeman splitting, Eq.(4)is equivalent to
IþðhxÞ DðhxÞX
k
CkfkD0ðhxÞX
k
CkDkf0; (5) where D0ðhxÞ ¼dDðhxÞ=dhx and f0 is the population at zero magnetic field, identical for all initial states. Equation (5) describes that the PL contour IþðhxÞ is spectrally shifted with respect to the PL contour at zero field by P
kCkDk=P
kCk. Similarly, ther-polarized PL contour is shifted in the opposite direction by the same value. For the particular case of the optical transitions listed in Table I, the effective Zeeman shift between the broadened PL lines of opposite helicity is given by
DEII¼ D11 2Deþ5
2DMn: (6)
The Zeeman splitting of the hole-Mn complex, Mn ion, and conduction-band electron have the form
D1¼g1lBBz; DMn¼g0lBBz; De¼gelBBzþaB1
g1lBBz
kBTMn
; (7)
whereg1is theg-factor of the hole-Mn complex,g0¼2 is the Mng-factor,geis the intrinsic electrong-factor,lBis the Bohr magneton,TMn is the effective temperature of the Mn spins, and B1ðxÞ ¼2sinhx=ð1þ2coshxÞ is the Brillouin function of the momentumJ¼1. The second contribution to De describes the splitting due to exchange interaction between conduction-band electrons and hole-Mn complexes, parameter a depends on the exchange interaction strength and complex concentration.
The PL peak I is attributed to the optical transitions between electrons and heavy holes confined in the QW
(see Fig. 7). The sign of the PL circular polarization in a magnetic field is largely determined by the spin polarization of electrons since the thermal spin polarization of holes is low inp-doped structures. The electron spin polarization can occur due to thermal population of spin-split states as well as spin-dependent extraction of electrons caused by other recombination channels,25e.g., radiative transitions contrib- uting to peak II. The spectral shift between the polarized lines of opposite helicity in a magnetic field is determined by the Zeeman splitting of both, conduction and valence bands, and is given by
DEI ¼ DeþDhh; (8) whereDhhis the Zeeman splitting of the heavy-hole subband
Dhh ¼ghhlBBzþbB1
g1lBBz
kBTMn
: (9)
Here,bis the parameter describing the strength of the exchange interaction between free holes and hole-Mn complexes.
Peak I and its splitting in magnetic fields is well observed in experiment. In the regime of small magnetic fields, DEI depends linearly on the magnetic field and has two contributions: one is temperature independent and the other one scales as 1=TMn. Fitting the experimental data pre- sented in Fig. 4by Eq.(8) yieldsðbaÞg124 meV and geghh 2:6. The small absolute value of geghh is in agreement with negligible splitting of the PL line in QW structures without magnetic impurities.16
We note that at temperatures T<5 K, PL spectra are weakly sensitive to the sample temperature. This indicates that the effective Mn temperature TMn is higher then the nominal sample temperature due to heating by radiation. In particular, the best agreement between the experimental curve measured at 2 K and theory is obtained forTMn 3:3 K. Peak II is less pronounced and disappears in high magnetic fields; therefore, its treatment is less reliable. Fitting the data on the Zeeman splitting of peak II by Eq. (6) yields ag1 126 meV and 2g1þge 4:6.
The saturation of the splitting at higher magnetic fields is determined by g1. The best fit of the experimental data for peak I usingTMn¼3:3 K is obtained forg13:5. This value is in agreement with the theoretical calculation and experi- mental measurements of the g-factor of a bound-hole-Mn complex in GaAs crystals (g12:7).24,26 Taking this g1
value, all other parameters can be estimated asa 36 meV, b 29 meV, ge 11:6, and ghh 14:2 for the QW structure under study. The large absolute value and the nega- tive sign of the electron g-factor is in agreement with the g-factor in bulk InAs:ge 15.27The negative sign ofbis in agreement with the antiferromagnetic behavior of the p-d exchange interaction. The determined negative sign of the pa- rameter a, which describes the exchange interaction between the conduction-band electron and bound-hole-Mn complex, may be caused by the electron-hole exchange interaction and is discussed in Ref.28.
While, the above analysis describes all qualitative fea- tures of experiments on Mn doped samples the observed
TABLE I. Optical transitions between conduction-band electrons and holes bound to Mn with emission ofrþ-polarized photons.De,D1, andDMnare the Zeeman splitting of electron states, hole-Mn complex, and Mn ion, respectively.
Initial state Final state Relative Zeeman shift
k Jz,se;z SMn;z rateCk Dk
1 1,1/2 5/2 1/2 De=2D1þ5DMn=2
2 1,þ1/2 3/2 1/10 De=2D1þ3DMn=2
3 0,1/2 3/2 1/5 De=2þ3DMn=2
4 0,þ1/2 1/2 1/10 De=2þDMn=2
5 þ1,1/2 1/2 1/20 De=2þD1þDMn=2
6 þ1,þ1/2 þ1/2 1/20 De=2þD1DMn=2
113906-6 Terent’evet al. J. Appl. Phys.118, 113906 (2015)
splitting of the PL lines in sample A exceeds by two orders of magnitude the one estimated using s – d and p – d exchange-coupling constants for bulk InMnAs,aand b of order of 1 eV and 0.5 eV, respectively.11 The origin of this discrepancy remains unclear and needs further study. A possible reason for the enhanced Zeeman splitting observed in the experiment might be the formation of Mn-enriched areas due to inhomogeneous Mn distribution in the plane of the QW. It is reasonable to expect that in this case the dom- inant contribution to the PL is associated with carriers localized in these areas. This would result in a stronger local exchange interaction as compared to that estimated from the average Mn concentration. Indeed, even in the case of high quality metamorphic buffer layers used in our structures the density of extended defects (threading dislo- cations) lies around 106cm2, maximum 107cm2. Due to well-known phenomenon—enhanced metal diffusion and accumulation along the threading dislocations in III-V semiconductors29,30—Mn atoms can accumulate around the residual threading dislocations propagating into the QW. Thus, their local concentration in the InAs QW can exceed the average level of segregated Mn concentration 1018cm3and may in principle be high enough to create the regions of InMnAs with Mn content on the order of 1%.
It is reasonable to expect that the dominant contribution to the recombination is associated with the localized charge carriers in these regions. The exchange interaction between charge carriers and Mn ions in these areas is considerably enhanced comparing to the areas where Mn ions are distrib- uted homogeneously resulting in larger values of exchange constants.
However, justification of this mechanism needs chal- lenging morphology studies, e.g., by space resolved micro- photoluminescence in magnetic field.
VI. SUMMARY
Our results show that efficient photoluminescence can be excited in InAs/InGaAs/InAlAs heterostructures with Mn modulation doped layer introduced in close proximity to InAs quantum well. Applying circular polarized magneto-PL we revealed that “inverted” doped QWs structures with Mn inserted at high temperature of Mn effusion cell equal (852C) demonstrate giant Zeeman effect resulting in a high degree of spin levels splitting being up to 6 meV forT¼2 K and magnetic fieldB4 T. The functional behavior of the PL line splitting resulting from the Zeeman effect, such as its temperature and magnetic field dependencies, is well described by the Brillouin function, providing an evidence for exchange interaction with spin polarized manganese ions.
However, the value of the splitting exceeds by two orders of magnitude the one estimated in the frame of common approach to the description of exchange interaction in DMS assuming homogeneous distribution of Mn ions in the well.
While this surprising finding could be ascribed to local Mn accumulation along threading dislocations its origin requires further study. The inhomogeneous distribution of Mn in the plane of the QW could be investigated by micro-PL tech- nique with high space resolution.
ACKNOWLEDGMENTS
Financial support by DFG (SFB 689 and ICRC-TRR 160), the Russian Foundation for Basic Research, RF President Grant No. MD-3098.2014.2, the “Dynasty” foundation and EU project SPANGL4Q is gratefully acknowledged.
1Spin Physics in Semiconductors, edited by M. I. Dyakonov (Springer, 2008).
2Spintronics (Semiconductors and Semimetals), edited by T. Dietl, D. D.
Awschalom, M. Kaminska, and H. Ohno (Academic Press, 2009).
3Introduction to the Physics of Diluted Magnetic Semiconductors, edited by J. Kossut and J. A. Gaj (Springer, 2011).
4Handbook of Spin Transport and Magnetism, edited by E. Y. Tsymbal and I. Zutic (Chapman and Hall, 2011).
5T. Jungwirth, J. Wunderlich, V. Novak, K. Olejnik, B. L. Gallagher, R. P.
Campion, K. W. Edmonds, A. W. Rushforth, A. J. Ferguson, and P.
Nemec,Rev. Mod. Phys.86, 855 (2014).
6T. Dietl,Nature Mat.9, 965 (2010).
7T. Schallenberg and H. Munekata,Appl. Phys. Lett.89, 042507 (2006).
8H. Ohno, H. Munekata, T. Penney, S. von Molnar, and L. L. Chang,Phys.
Rev. Lett.68, 2664 (1992).
9U. Wurstbauer, C.Sliwa, D. Weiss, T. Dietl, and W. Wegscheider,Nature Phys.6, 955 (2010).
10B. Rupprecht, W. Krenner, U. Wurstbauer, Ch. Heyn, T. Windisch, M. A.
Wilde, W. Wegscheider, and D. Grundler,J. Appl. Phys.107, 093711 (2010).
11A. Zudov, J. Kono, Y. H. Matsuda, T. Ikaida, N. Miura, H. Munekata, G.
D. Sanders, Y. Sun, and C. J. Stanton,Phys. Rev.B66, 161307 (2002).
12S. D. Ganichev, S. A. Tarasenko, V. V. Bel’kov, P. Olbrich, W. Eder, D.
R. Yakovlev, V. Kolkovsky, W. Zaleszczyk, G. Karczewski, T.
Wojtowicz, and D. Weiss,Phys. Rev. Lett.102, 156602 (2009).
13V. V. Bel’kov and S. D. Ganichev,Semicond. Sci. Technol.23, 114003 (2008).
14P. Olbrich, C. Zoth, P. Lutz, C. Drexler, V. V. Bel’kov, Ya. V. Terent’ev, S. A. Tarasenko, A. N. Semenov, S. V. Ivanov, D. R. Yakovlev, T.
Wojtowicz, U. Wurstbauer, D. Schuh, and S. D. Ganichev,Phys. Rev. B 86, 085310 (2012).
15G. A. Khodaparast, Y. H. Matsuda, D. Saha, G. D. Sanders, C. J. Stanton, H. Saito, S. Takeyama, T. R. Merritt, C. Feeser, B. W. Wessels, X. Liu, and J. Furdyna,Phys. Rev. B88, 235204 (2013).
16Ya. V. Terent’ev, S. N. Danilov, J. Loher, D. Schuh, D. Bougeard, D.
Weiss, M. V. Durnev, S. A. Tarasenko, M. S. Mukhin, S. V. Ivanov, and S. D. Ganichev,Appl. Phys. Lett.104, 101111 (2014).
17U. Wurstbauer, M. Soda, R. Jakiela, D. Schuh, D. Weiss, J. Zweck, and W. Wegscheider,J. Cryst. Growth311, 2160 (2009).
18U. Wurstbauer and W. Wegscheider,Phys. Rev. B.79, 155444 (2009).
19S. D. Ganichev, Petra Schneider, V. V. Bel’kov, E. L. Ivchenko, S. A.
Tarasenko, W. Wegscheider, D. Weiss, D. Schuh, B. N. Murdin, P. J.
Phillips, C. R. Pidgeon, D. G. Clarke, M. Merrick, P. Murzyn, E. V.
Beregulin, and W. Prettl,Phys. Rev. B68, 081302 (2003).
20P. T. Chiu, A. J. Blattner, S. J. May, and B. W. Wessels,Physica B344, 379 (2004).
21N. S. Averkiev, A. E. Zhukov, Yu. L. Ivanov, P. V. Petrov, K. S.
Romanov, A. A. Tonkikh, V. M. Ustinov, and G. E. Tsyrlin, Semiconductors38, 217 (2004).
22H. Kaftelen, K. Ocakoglu, R. Thomann, S. Tu, S. Weber, and E. Erdem, Phys. Rev. B86, 014113 (2012).
23J. Szczytko, A. Twardowski, M. Palczewska, R. Jablonski, J. Furdyna, and H. Munekata,Phys. Rev. B63, 085315 (2001).
24N. S. Averkiev, A. A. Gutkin, E. B. Osipov, and M. A. Reshchikov, Sov.
Phys. Solid State30, 438 (1988).
25V. L. Korenev, I. A. Akimov, S. V. Zaitsev, V. F. Sapega, L. Langer, D.
R. Yakovlev, Yu. A. Danilov, and M. Bayer, Nature Commun.3, 959 (2012).
26J. Schneider, U. Kaufmann, W. Wilkening, M. Baeumler, and F. K€ohl, Phys. Rev. Lett.59, 240 (1987).
27C. R. Pidgeon, D. L. Mitchell, and R. N. Brown, Phys. Rev.154, 737 (1967).
28C.Sliwa and T. Dietl, Phys. Rev. B78, 165205 (2008).
29Z. Liliental-Weber, J. Jasinski, and J. Washburn,J. Cryst. Growth 246, 259 (2002).
30S. V. Ivanov, T. V. Shubina, V. N. Jmerik, V. A. Vekshin, P. S. Kop’ev, and B. Monemar,J. Cryst. Growth269, 1 (2004).