SFB 649 Discussion Paper 2005-019
Arbitrage-Free Smoothing of the Implied Volatility
Surface
Matthias R. Fengler*
* Trading & Derivatives, Sal. Oppenheim jr. & Cie., Germany
This research was supported by the Deutsche
Forschungsgemeinschaft through the SFB 649 "Economic Risk".
http://sfb649.wiwi.hu-berlin.de ISSN 1860-5664
SFB 649, Humboldt-Universität zu Berlin
S FB
6 4 9
E C O N O M I C
R I S K
B E R L I N
Arbitrage-free smoothing of the implied volatility surface
Matthias R. Fengler
∗Trading & Derivatives
Sal. Oppenheim jr. & Cie.
Untermainanlage 1, 60329 Frankfurt am Main, Germany
March 23, 2005
∗Corresponding author: matthias.fengler@oppenheim.de, TEL ++49 69 7134 5512, FAX ++49 69 7134 9 5512. The paper represents the author’s personal opinion and does not reflect the views of Sal. Oppenheim.
Support by the Deutsche Forschungsgemeinschaft and the SfB 649 is gratefully acknowledged.
Arbitrage-free smoothing of the implied volatility surface
Abstract
The pricing accuracy and pricing performance of local volatility models crucially depends on absence of arbitrage in the implied volatility surface: an input implied volatility surface that is not arbitrage-free invariably results in negative transition probabilities and/ or negative local volatilities, and ultimately, into mispricings. The common smoothing algorithms of the implied volatility surface cannot guarantee the absence arbitrage. Here, we propose an approach for smoothing the implied volatility smile in an arbitrage-free way. Our methodology is simple to implement, computation- ally cheap and builds on the well-founded theory of natural smoothing splines under suitable shape constraints. Unlike other methods, our approach also works when input data are scarce and not arbitrage-free. Thus, it can easily be integrated into standard local volatility pricers.
1 Introduction
The implied volatility surface obtained from inverting the Black and Scholes (1973) for- mula is the key input parameter for pricing illiqud, exotic, or other non-listed derivatives consistently with the markets. A crucial property of the implied volatility surface (IVS) is the absence of arbitrage. Especially, local volatility models that were initially proposed by Dupire (1994), Derman and Kani (1994), and Rubinstein (1994) and put into highly efficient pricing engines by Andersen and Brotherton-Ratcliffe (1997) and Dempster and Richards (2000) amongst others, heavily rely on an arbitrage-free estimate of the IVS: if there are arbitrage violations, negative transition probabilities and negative local volatilities ensue, which obstructs the convergence of the algorithm solving the underlying generalized Black Scholes partial differential equation. While occasional arbitrage violations may safely be overridden by some ad hoc approach, the algorithm breaks down, if the violations become too excessive. In consequence, severe mispricings are obtained, and even small perturbations of the input parameters lead to completely different price quotes and highly unstable greeks.
Unfortunately, an arbitrage-free IVS is by no means the natural situation met in practice.
For instance, a trader observes market bid and ask quotes of plain vanilla options, the mid prices of which he likes to employ for his option pricing tools: computing mid prices, however, can result into data contaminated with arbitrage, even if the input data are not. Or, a risk manager faces daily settlement prices he uses for overnight risk assessments: but settlement data often contain stale data that have been gathered over some period of time at the end of the trading day, and therefore can be of poor quality. This is best visible in Figure 1, which shows the DAX option price data computed from settlement implied volatility with three days to expiry. From the encircled observations, it is seen that almost the entire call price
20000 3000 4000 5000 6000 7000 8000 9000 10000 500
1000 1500 2000 2500 3000 3500 4000 4500 5000
ODAX − Calls: 20000613, τ = 0.0154
Strikes
Call prices
8000 8500 9000 9500 10000
0 2 4 6 8 10 12 14 16 18 20
ODAX − Calls: 20000613, τ = 0.0154
Strikes
Call prices
Figure 1: Left panel: call price function from DAX, 20000613, for 3 days to expiry. Crosses denote original observations, circles highlight arbitrage opportunities. Right panel shows details. DAX spot price is at 7268.91.
function is contaminated with arbitrage. In the left part, the function is too steep, while in the right part around strike 8000, the function is even increasing. Admittingly, this is a particularly virulent example, but implied volatility data more or less contaminated with arbitrage is the rule rather than the exception. For a deeper discussion on the potential sources of errors in implied volatility data see Roll (1984) and Harvey and Whaley (1991), and particularly the exhaustive study by Hentschel (2003).
Typically, arbitrage across strikes, which can be seen from negative butterfly spreads, is much severe than calendar arbitrage. But, even when the input data are arbitrage-free, an application of the common interpolation or smoothing algorithms, such as the parametric suggestions by Brockhaus et al. (2000, Chap. 2) or any nonparametric smoothing device, see Fengler (2004) for an overview, do not necessarily result in an arbitrage-free IVS on the desired estimation grid. The reason is that estimating the IVS under no-arbitrage restrictions
is a complicated task: first, it implies estimating in a high-dimensional space, since not only does the absence of arbitrage opportunities depend on the specific form of the IVS, but also on all other variables involved, such as interest rates, dividends, and the current spot value.
Second, one needs to estimate under highly nonlinear constraints. To our knowledge, there do not exist any globally parametric restrictions on the implied volatility space that can be tested for, though remarkable results have been obtained recently. Lee (2003), for instance, discovered that the wings of the implied variance function are asymptotically linear in log- moneyness. Most interestingly, he showed that there exists a strikingly simple relationship between the slope of implied variance and the number of finite moments in the underlying price process. These asymptotic advances, however, do not make precise the nature of the interior part of the smile.
A way to circumvent the challenges of estimating in the implied volatility space is to estimate in the option price space, usually the (plain vanilla) call price space, since the nonlinearities and high-dimensionality translate into a set of convenient shape constraints of the pricing function, most importantly convexity and monotonicity, see Section 2 for details. In a recent advance, Kahal´e (2004) proposes a three-step procedure. In a first step he interpolates the (call) price observations for each single time-to-maturity by piecewise convex polynomials that have the form of the Black Scholes (BS) valuation formula with an additive linear term.
The resulting estimate of the call price function is globally arbitrage-free and hence is the volatility smile computed by inverting the BS formula. In a second step, he interpolates the total (implied) variance along strikes linearly. Finally, he makes additional adjustments to the call prices that ensure that the IVS is globally arbitrage-free. His approach requires solving a set of nonlinear equations. Moreover, for the interpolation algorithm to work, the data need to be arbitrage-free from scratch. As has been argued above, this is hardly to be
expected in practice.
Unlike Kahal´e (2004), the approach we propose here builds on smoothing rather than inter- polation. Therefore, the input data do not need to be arbitrage-free. We employ natural (cubic) splines under suitable shape constraints. More specifically, for the observations {(ui, yi)}, ui ∈ [a, b] for i = 1, . . . , n, which denote a collection of strike and call prices, we consider the curve estimate defined as minimizer bg of the penalized sum of squares:
n
X
i=1
n
yi−g(ui)o2
+ λ Z b
a
{g00(v)}dv , (1) subject to a number of linear inequality constraints. The solutionbg of (1) is a twice differen- tiable function and represents a globally arbitrage-free call price function. The smoothness of bg can be determined by varying the parameter λ >0. Given the solution, the call price function given by the smoothing spline is efficiently evaluated on a dense grid. Via the BS formula, one obtains the implied volatility smile for the given maturity.
In employing natural spline smoothing, we inherit a number of nice properties: first, since (unconstrained) natural splines are uniquely determined by the function values and their second order derivatives, problem (1) can be rewritten in terms of a quadratic program that can be solved in O(n) steps, Green and Silverman (1994); Turlach (1997). Second, from a statistical point of view, it is known that spline smoothers under shape constraints achieve optimal rates of convergence in shape restricted Sobolev classes Mammen and Thomas- Agnan (1999). Third, since the solution algorithm belongs to the class of so called convex quadratic programs, we automatically inherit uniqueness of the spline function. Finally, the estimated cubic spline is entirely determined by the set of its function values and its second- order derivative at the grid points. Hence, it can be stored and evaluated at the desired grid point in an efficient way, for instance, in order to recover some value in the IVS or in order
to approximate some Arrow-Debreu price.
The approach we pursue is similar in spirit with the nonparametric literature on estimat- ing the risk neutral transition density such as A¨ıt-Sahalia and Duarte (2003), H¨ardle and Yatchew (2003), and H¨ardle and Hl´avka (2004) that could in principle be exploited in a similar manner. These techniques, however, tend to be involved and require a large number of data, whereas our method is straightforward to implement and works perfectly with the limited amount of observations usually available in practice (typically 20-25 observations, one at each strike, only). Since the smoothed smile functions are completely defined by the set of knots and its second-order derivatives, there is no need for an ad hoc ‘in-between’
interpolation, which may induce arbitrage opportunities. Rather, the set of knots and the second-order derivatives is passed to the pricing engine, and can be evaluated directly on the desired grid. Thus, the method can be integrated into local volatility pricing engines such those proposed by Andersen and Brotherton-Ratcliffe (1997) and Dempster and Richards (2000).
The paper is organized as follows. The next section briefly outlines the principles of no- arbitrage in the option pricing function. Section 3 presents spline smoothing algorithm under no-arbitrage constraints. In Section 4, we explore a number of examples, and Section 5 concludes.
2 No-arbitrage constraints on the IVS
In a dynamically complete market, the absence of arbitrage opportunities implies the ex- istence of an equivalent martingale measure, Harrison and Kreps (1979) and Harrison and
Pliska (1981), that is uniquely characterized by the risk neutral transition density of the underlying stochastic process denoted by φ(ST, T|St, t, rt,τ, δt,τ) . HereSt is the time-t asset price, T = t+τ the expiry date of the option, τ time-to-expiration, rt,τ the deterministic risk-free interest rate and the dividend rate of the asset δt,τ for that maturity.
The valuation function of a European call with strike K is given by C(St, t, K, T, rt,τ, δt,τ) = e−rt,ττ
Z ∞ 0
max(ST −K,0)φ(ST, T|St, t, rt,τ, δt,τ)dST . (2)
From (2) the well-known fact that the call price function must be a decreasing and convex function in the option’s strike price is immediately obtained, Merton (1973). Taking the derivative with respect to K, and together with the positivity of φ and its integrability to one, one receives:
−e−rt,ττ ≤ ∂C(St, t, K, T, rt,τ, δt,τ)
∂K ≤0, (3)
which implies monotonicity. Convexity follows from differentiating twice with respect to K, Breeden and Litzenberger (1978):
∂2C(St, t, K, T, rt,τ, δt,τ)
∂K2 =e−rt,ττφ(ST, T|St, t, rt,τ, δt,τ)≥0. (4) Moreover, general no-arbitrage considerations show that the call price function is bounded by:
max(e−δt,ττSt−e−rt,ττK,0)≤C(St, t, K, T, rt,τ, δt,τ)≤e−δt,ττSt. (5)
These shape constraints on the option price function translate into a highly nonlinear condi- tions for an arbitrage-free implied volatility smile. This can be made explicit by inspecting the risk neutral transition density obtained by twice differentiating the BS formula under the
assumption of a strike dependent (implied) volatility function. The BS valuation formula for the call option, Black and Scholes (1973), is given by:
CtBS(St, t, K, T, rt,τ, δt,τ,bσ) =e−δt,ττStΦ( ¯d1)−e−rt,ττKΦ( ¯d2), (6) where bσ is implied volatility, Φ the CDF of the standard normal distribution and ¯d1 def=
ln(St/K)+(rt,τ−δt,τ+12bσ2)τ σ√
τ and ¯d2 def= d1−σb√
τ. Differentiating twice as in (4) yields after some manipulations, see for instance Fengler (2004):
φ(K, T|St, t) =e−δt,ττSt√
τ ϕ( ¯d1) ( 1
K2στb + 2 ¯d1 Kbσ√
τ
∂bσ
∂K + d¯1d¯2
σb
∂bσ
∂K 2
+ ∂2bσ
∂K2 )
, (7) where ϕ is the pdf of a standard normal variate. The first term before the curly brackets is also known as the BS call vega. Smoothing the IVS under no-arbitrage constraints would need to impose that φ(K, T|St, t)≥0 on the entire domain, which is impressively involved.
In the time-to-maturity direction only a weak constraint is known. The prices of American calls for the same strikes must be nondecreasing, Merton (1973), and in the absence of dividends, this property translates to European calls as well. However, this property does not have any specific implications for the IVS. As is well-known empirically, the term structure of the IVS may very well be downward sloping or humped. However, as is argued by Kahal´e (2004), a convenient test and interpolation scheme can be constructed in terms of the total (implied) variance. Kahal´e (2004) treats the zero-dividend zero-interest rate case, but his approach can be pushed farther to the case with a deterministic, time-dependent interest rate rt and dividend yield δt, which are the typical assumption within the local volatility framework. In this case, rather than interpolating along strikes, one needs to interpolate in the forward-moneyness grid κ def= K/FtT, where the forward price is given by FtT =SteRtT(rt−δt)dt. Hence, our total variance is defined by:
ν2(κ, τ)def= bσ2(κ, τ)τ . (8)
We summarize the argument in the following
Proposition 2.1. Assume the existence of a deterministic, time-dependent interest rate rt and a deterministic, time-dependent dividend yield δt. If ν2(κ, τi), is a strictly increasing function for τi =Ti−t and i= 1,2, there is no calendar arbitrage.
Proof: Given two expiry dates t < T1 < T2, construct int the following calendar spread in two calls with same the forward-moneyness: a long position in the callCt(K2, T2) and a short position in e−
RT2 T1 δtdt
calls Ct(K1, T1). The forward-moneyness requirement implies K1 = e
RT2
T1(δt−rt)dt
K2. InT1, ifST1 ≤K1, the short position expires worthless, whileCT1(K2, T2)≥0.
Otherwise, the entire portfolio consists of CT1(K2, T2)−e−
RT2 T1 δtdt
ST1 −e
RT2
T1(δt−rt)dt
K2
= PT1(K2, T2) ≥ 0 by the put-call-parity. Thus, the payoff of this portfolio is always non- negative. To preclude arbitrage we must have:
Ct(K2, T2)> e−
RT2 T1 δtdt
Ct(K1, T1). (9)
Multiplying with eR0T2rtdt and dividing by K2 yields:
eR0T2rtdtCt(K2, T2)
K2 > eR0T1rtdtCt(K1, T1)
K1 . (10)
Finally, observe that the function
f(κ, ν2) def= eR0TrtdtCtBS(K, T) K
= κ−1Φ( ¯d1)−Φ( ¯d2) (11) is function in κ and ν2 only, and, for a fixed κ, is a strictly montonely increasing function in ν2, since ∂f /∂ν2 = 12ϕ( ¯d2)/√
ν2 > 0 for ν2 ∈ (0,∞). Thus, Eq. (10) implies ν2(κ, T2)>
ν2(κ, T1), and any strictly increasing total variance rules out calendar arbitrage in the IVS.
0.2 0.4 0.6 0.8 1 1.2 1.4 1.6 0
0.05 0.1 0.15 0.2 0.25
20000613: Total variance
Forward−moneyness
Total variance
4 29 49 69 134 199 264 399
Figure 2: Total variance plot for DAX data, 20000613. Dividend yields is assumed to be zero, since the DAX index is a performance index. Time-to-maturity given in days; top graph corresponds to top legend entry, second graph to the second one, etc.
Thus, an IVS obtained from convex call price functions that observe condition (9), or equiv- alently, that is strictly increasing in the total variance, is arbitrage-free. A consequence of Proposition 2.1 is that inspecting a plot of the total variance against the forward moneyness visually shows calendar arbitrage when the graphs intersect. In Figure 2 we depict the total variance plot of the IVS data belonging to the front maturity we inspected in the intro- duction, i.e. the lowest line corresponds to the price data seen in Figure 1. Obviously, not only does this sample of observed prices violate strike arbitrage, it also produces calendar arbitrage, which can be inferred from the intersecting lines for instance in the neighborhood of 80% and 120% moneyness.
3 Spline smoothing
3.1 Generic set-up
Spline smoothing is a classical statistical technique and details can be found in almost any standard monograph on smoothing such as H¨ardle (1990), Green and Silverman (1994) or H¨ardle et al. (2004) amongst others. In following the nice exposition by Turlach (1997), we focus on the pure implementation issues only. For the theory, the reader is referred to the indicated monographs.
We shall assume that we observe call prices yi at strikes a=u0, . . . , un+1 =b. A function g defined on [a, b] is called a cubic spline, if g, on each subinterval (a, u1), (u2, u3), . . . ,(un, b), is a cubic polynomial and if g belongs to the class of twice differentiable functions denoted by C2([a, b]). The points ui are called knots. The spline g has the representation
g(u) =
n
X
i=0
1{[ui, ui+1)}si(u) (12) where si(u) def= di(u−ui)3+ci(u−ui)2+bi(u−ui) +ai ,
for i = 0, . . . , n and given constants ai, bi, ci, di. The continuity conditions for the interior segments on g and its first and second order derivatives imply a number restrictions on the coefficients. They can be deduced from the conditions:
si−1(ui) = si(ui)
s0i−1(ui) = s0i(ui) , (13)
s00i−1(ui) = s00i(ui)
fori= 1, . . . , n. The function g is called anatural cubic spline, if its second order derivatives are zero in the very first and the very last segment of the spline. This implies that c0 =d0 =
cn =dn = 0. In the following, we will work with the natural spline, only. This allows for a very parsimonious formulation of the no-arbitrage conditions of the call price function, and does not impose any undesired restrictions on the estimate.
As is discussed in Green and Silverman (1994), representation (12) is not the most convenient representation of the spline. In fact, the so called value-second derivative representation is much more tractable and allows to formulate a small sized quadratic program which solves (1). The Appendix A gives the formulae to switch between the two representations.
For i = 1, . . . , n, put gi
def= g(ui) and γi
def= g00(ui). Furthermore define g def= (g1, . . . , gn)>
and γ def= (γ2, . . . , γn−1)>. By definition, γ1 =γn = 0. In giving the value-second derivative representation in this notation, we follow the non-standard exposition proposed by Green and Silverman (1994). The natural spline is completely specified by the vectors g and γ.
However, not all possible vectors g and γ give a valid cubic spline. Sufficient and necessary conditions are formulated via the following two matrices Q and R. Let hi = ui+1 −ui for i= 1, . . . , n−1, and define the n×(n−2) matrixQ by its elementsqi,j, for i= 1, . . . , n−1 and j = 2, . . . , n−1, given by
qj−1,j =h−1j−1 , qj,j =−h−1j−1−h−1j , and qj,j+1 =h−1j ,
for j = 2, . . . , n−1, and qi,j = 0 for |i−j| ≥ 2. The columns of Q are numbered in the same non-standard way as the vector γ.
The (n−2)×(n −2) matrix R is symmetric and is defined by its elements ri,j for i, j = 2, . . . , n−1, given by
ri,i = 13(hi−1+hi) for i= 2, . . . , n−1 ri,i+1 =ri+1,i = 16hi for i= 2, . . . , n−2,
(14)
and ri,j = 0 for |i−j| ≥ 2. The matrix R is strictly diagonal dominant, so by standard arguments in linear algebra, R is strictly positive-definite.
Proposition 3.1. The vectors g and γ specify a natural cubic spline if and only if the condition
Q>g=Rγ (15)
holds. If (15) is satisfied, we have Z b
a
g00(u)2du=γ>Rγ. (16)
Proof: Green and Silverman (1994, Section 2.5).
This result allows to state the spline smoothing task as a quadratic minimization problem.
Define the (2n−2)-vector y def= (y1, . . . , yn,0, . . . ,0)>, the (2n−2)-vector x def= (g>,γ>)>, the (2n−2)×(2n−2)-matrix
Adef=
Q
−R>
(17)
and
Bdef=
In 0 0 λR
, (18)
whereInis the unity matrix of sizen. Then the solution of (1) can be written as the solution of the quadratic program:
minx −y>x+1
2x>Bx, (19)
subject to A>x= 0 .
The minimization problem (19) is a quadratic program that can be solved with standard statistical packages. Particular algorithms are discussed in Green and Silverman (1994) who
build on the work of Reinsch (1967, 1971), which is of orderO(n). Turlach (1997) discusses an algorithm based on the method of Goldfarb and Idnani (1983), which is particularly suited for including convexity-concavity, monotonicity, or positivity constraints in more general cases than ours.
An important property of natural cubic splines is that given data points y1, . . . , yn and a smoothing parameter λ > 0, the spline function is unique, Green and Silverman (1994, Theorem 2.4). This can be understood by noting that the matrix B in the program (19) is positive-definite. This implies that the program belongs to the class convex quadratic programs that are known to have a unique minimizer, Blum and Oettli (1975).
Given the solution x = (g>,γ>)>, the spline is evaluated in the interior of the interval [u1, un] by computing, Appendix A:
g(u) = (u−ui)gi+1+ (ui+1−u)gi hi
− 1
6(u−ui)(ui+1−u)
1 + u−ui hi
γi+1+
1 + ui+1−u hi
γi
, (20) forui ≤u≤ui+1,i= 1, . . . , n−1, wherehi =ui+1−ui, fori= 1, . . . , n−1, andγ1 =γn = 0.
For u0 ≤ u ≤ u1 and un ≤ u ≤ un+1, the definition of the natural spline implies that g00(u) =g000(u) = 0. The derivatives of g atu1 and un are found by
g0(u1) = g2−g1 u2−u1 − 1
6(u2−u1)γ2 and (21)
g0(un) = gn−gn−1 un−un−1
− 1
6(un−un−1)γn−1 . (22) Hence outside the interval [u1, un], the spline is, by linearity,
g(u) = g1−(u1−u)g0(u1) for u≤u1 , (23) g(u) = gn−(u−un)g0(un) for u≥un. (24)
3.2 Cubic spline smoothing under no-arbitrage constraints
The no-arbitrage conditions spelled out in (2) need to be translated into conditions on the smoothing spline which are to be added to the quadratic program. Convexity of the spline is simply imposed by noting that the second derivative of the spline is linear. Hence it is sufficient to require that the second derivatives at the knot points be positive. Therefore, we impose the additional constraints
γi ≥0, (25)
for i= 2, . . . , n−1. Recall that γ1 =γn= 0.
From Section 2, it is clear that convexity is not sufficient to preclude arbitrage opportunities, since the smoothed call price function may be either negative or non-monotone. Since the convextiy constraints insure that that slope is non-decreasing, it is sufficient to constrain the linear boundary segments of the spline. Specifically, we impose that
g2 −g1 u2 −u1
≥ −e−rt,ττ and gn−1−gn≥0. (26)
Finally, given the monotonicity now present, we impose the no-arbitrage constraints on the price function by setting
e−δt,ττSt−e−rt,ττu1 ≤g1 ≤e−δt,ττSt and gn≥0. (27)
Including the conditions (25) to (27) into the quadratic program (19) yields an arbitrage-free call price function, and ulitimately, an arbitrage-free volatility smile.
Corollar 3.1. Given a sample of data points y1, . . . , yn and a smoothing parameter λ > 0, the arbitrage-free smoothing spline of the call price function, i.e. the natural cubic spline minimizer respecting conditions (25) to (27), is unique.
Proof: This trivially follows from the fact that the program still belongs to the class of convex quadratic programs.
3.3 Estimating an arbitrage-free IVS
The exposition of the preceding sections leads to a natural procedure to generate an arbitrage- free IVS:
1. Estimate the IVS in the total variance space, via an initial and roughpre-smoother on a regular forward-moneyness gridJ = [κ1, κn]×[τ1, τm].
2. From the last to the first maturity, iterate backwards by solving the following quadratic program:
for τm, solve:
minx −y>x+12x>Bx, subject to A>x = 0
γi ≥ 0,
g2 −g1 ≥ −e−rt,ττ(u2−u1) gn−1−gn ≥ 0
g1 ≥ e−δt,ττSt−e−rt,ττu1
g1 ≤ e−δt,ττSt (∗)
gn ≥ 0,
(28)
where x= (g>,γ>)>;
for τj, j =m−1, . . . ,1, solve (28) replacing condition (∗) by:
g(m)i < e
RT2 T1 δtdt
gi(m+1) , for i= 1, . . . , n , where gi(m) denotes the ith spline value of maturity m.
Step 1 is an immediate consequence of Proposition 2.1 and the degenerated design of the IVS. By degenerated design we refer to the fact that implied volatility observations are not equally distributed in the space, but are concentrated on a small number of ‘time-to-maturity strings’: due to trading conventions, even for very liquid stocks and indices only 12 to 16 expiries at maximum are traded on institutionalized futures exchanges. Because of this property, estimators for the IVS tend to yield estimates that are approximately linear in the observed variables. This, however, may induce a wrong term structure behavior, especially for short maturities. As proposed by Fengler et al. (2003), this difficulty can be circumvented via sophisticated semiparametric estimation techniques that smooth through time (as the third dimension in addition to the strike and time-to-maturity dimension), thereby capturing time propagation. While appealing by exploiting information accumulated through time, this technology requires are large time series of implied volatility data for calibration and is computationally intensive. Hence, for the contexts we consider here, such as feeding a local volatility pricer with a clean IVS, an obvious alternative is to estimate in the total variance space and to convert the estimate to implied volatilities afterwards. As pre-smoother some fully parametric model or any nonparametric smoother, such as Nadaraya-Watson estimator (Nadaraya; 1964; Watson; 1964) or local polynomial estimators (Fan; 1992, 1993;
Fan and Gijbels; 1992), are well-suited. Given the two-dimensionality of the problem, we consider also thin plate splines as very natural candidates for the pre-smoother (Wahba;
1990, Section 2.4). Note that this initial estimate should be rough in order to capture the local information. Smoothness and the absence of strike and calendar arbitrage are fully insured by Step 2, which steps backwards from the last expiry to the first one. In principle, also the reverse direction is possible. But since calendar arbitrage violations are more likely for short maturities, any correction to the IVS may propagate through the estimate, if one started from the front expiry. Therefore, we prefer stepping backwards. The entire program
can be solved via the quadratic program solvers implemented in standard statistical software packages.
3.4 Choice of the smoothing parameter
The typical challenge in non- and semiparametric estimation is the choice of the smoothing parameter or the bandwidth. In principle, there are two approaches. On the one hand, one may understand the additional freedom as an advantageous feature of these methods in that the estimated function can be adjusted according to the subjective choice of the user. In our particular application, this approach is not without merit, as a trader wishing to estimate the implied volatility curve does certainly have a clear opinion on how he expects the curve to look like, how smooth it should be, to which extent out-of-the-money puts should be more expensive relative to at-the-money puts, etc. On the one hand, there are situations where an automatic, data-driven choice of the smoothing parameter is more natural. This may be the case in applications in risk management where a more objective decision is typically sought.
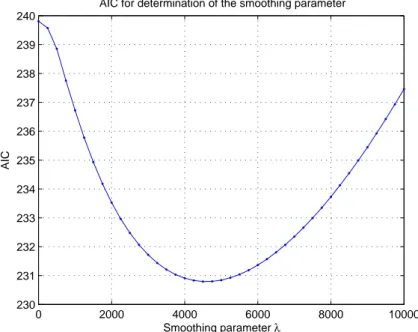
Several well-established data-driven methods for finding asymptotically optimal bandwidths and the smoothing parameter are known, such as ordinary and general cross-validation techniques, H¨ardle (1990). Here, we restrict ourselves in proposing a penalization via the Akaike information criterion (AIC) based on the unconstrained smoother as a particularly convenient method. Since the projection of the unconstrained estimate on the constrained set acts as additional smoothing, the resulting parameter will tend to oversmooth the call price function. Hence, the result can be interpreted as an indication for the smoothing parameter.
Clearly, a more sophisticated procedure should be based on the constrained smoother.
The AIC is defined by
Ξ(λ) = residual sum of squares + 2 dim(x;λ), (29) where dim(x;λ) is the (effective) dimension of the parameter vector. Consequently, we propose the AIC:
Ξ(λ)def=
n
X
i=1
{yi−bg(ui)}2+ 2
n
X
i=1
Hii, (30)
where Hii is the diagonal element of the hat matrix
H(λ)def= I+λQR−1Q>−1
. (31)
It is called hat matrix since it projects the original observations on the (unconstrained) predicted values, Green and Silverman (1994). The term Pn
i=1Hii can be interpreted as an approximation to the effective size of a linear smoother, see Hastie and Tibshirani (1990) for a discussion.
In Figure 3, we demonstrate the bandwidth choice using (30) for the data seen already in the introduction. The minimum of the AIC is achieved in the neighborhood ofλ = 5000. As noted, the restrictions on the spline, in particular the convexity constraints, act already as a smoothing device. Therefore, changes in λ do not have but a small impact on the estimate, and differences are hardly visible in the price function. They do become apparent though after computing implied volatilities.
4 Applications
In this section, we first demonstrate our estimator using the two front expiries of our data set from June 13th, 2000, see Table 1 for details. We believe that these data represent the
0 2000 4000 6000 8000 10000 230
231 232 233 234 235 236 237 238 239 240
AIC for determination of the smoothing parameter
Smoothing parameter λ
AIC
Figure 3: AIC minimization of the smoothing parameter for DAX data, 20000613, 3 days to expiry.
typical difficulties one faces when working with settlement data. Later, we will apply our IVS smoothing scheme to the entire surface.
In the left panel of Figure 4, we present spline estimate together with the call price observa- tions from Figure 1. The convex shape of the spline as opposed to the original observations is very well visible in the right panel of Figure 4. For simplicity, the smoothing parameter is fixed at λ= 5000 for all computations. As before, the original observations are displayed by crosses and arbitrage violation are encircled. By the conditions spelled out in Section 2, arbitrage violating input data are found by testing in the collection of strikes and prices (Ki, Ci), fori= 1, . . . , n, whether for K1 < K2. . . < Kn
−e−rt,ττ ≤ Ci−Ci−1
Ki−Ki−1 ≤ Ci+1−Ci
Ki+1−Ki ≤0 (32)
Time-to-maturity 3 28 48 68 133 198 263 398 interest rate 4.36% 4.47% 4.53% 4.57% 4.71% 4.85% 4.93% 5.04%
Dividend yield assumed to be zero, since the DAX index is a performance index.
DAX spot price is 7268.91.
Table 1: Data of DAX index settlement prices from 20000613.
holds, Kahal´e (2004). Figure 5 shows the corresponding IV data together with the arbitrage- free smile. The IV residuals, the relative and absolute pricing errors are given in Figure 6.
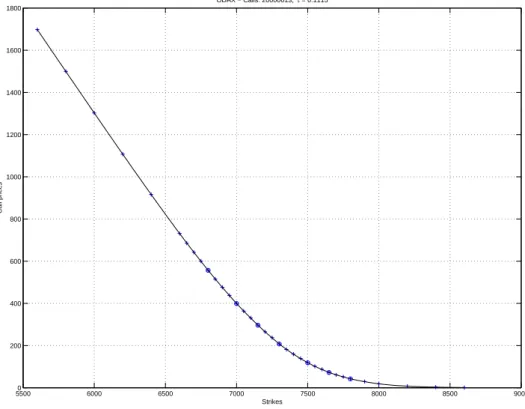
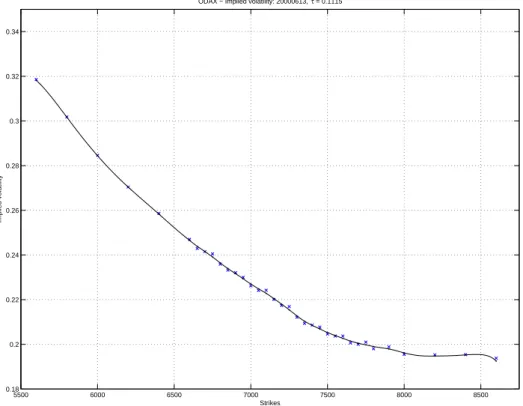
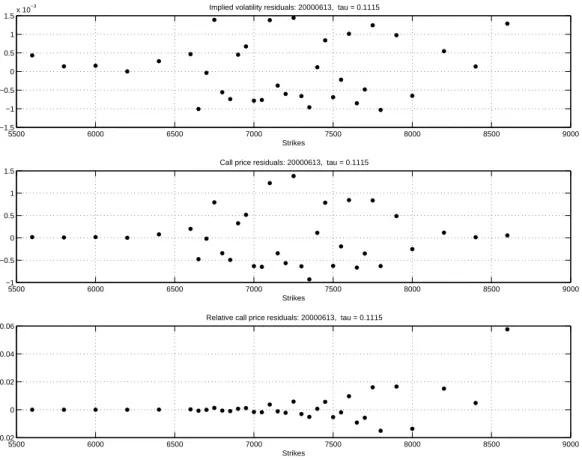
Given the heavy arbitrage violations, it is clear that the estimated call price function and hence its implied volatility smile must strongly depart from the original data. Only in the at-the-money region the errors are evenly distributed, while in the wings of the smile the estimated prices are typically lower than the original observations. In Figures 7 to 9 we show the spline, its implied volatility smile and the error plots of the second time-to-maturity of this particular day (28 days to expiry). Obviously, the number of arbitrage violations is much smaller, and hence the residuals are randomly distributed around zero.
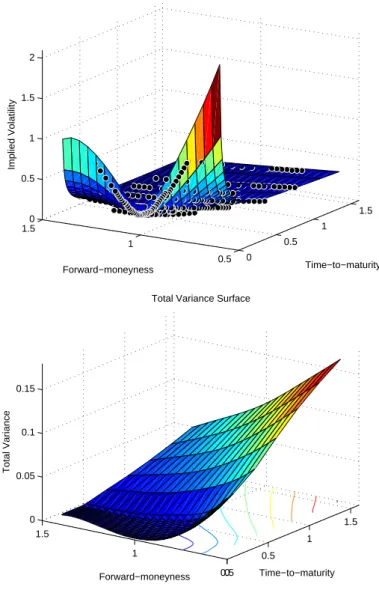
Finally, the entire IVS is given in Figure 10 together with total variance. The estimate has been obtained by using a thin plate spline as pre-smoother on the forward-moneyness grid J = [0.4,1.4]×[0.1,1.5] with 20 grid points in each direction and by applying the arbitrage- free estimation technique from the last to first time-to-maturity. As is seen in the lower panel, the total variance is increasing in time to maturity. Therefore, the estimated front implied volatilities are lower than the original observations: only in the interior part of the IVS the original observations are visible since they are ‘behind’ the estimated surface in the outer part of the wings. Otherwise the observations belonging to longer time-to-maturities are fitted in an excellent way.
20000 3000 4000 5000 6000 7000 8000 9000 10000 500
1000 1500 2000 2500 3000 3500 4000 4500 5000
ODAX − Calls: 20000613, τ = 0.0154
Strikes
Call prices
8000 8500 9000 9500 10000
0 2 4 6 8 10 12 14 16 18 20
ODAX − Calls: 20000613, τ = 0.0154
Strikes
Call prices
Figure 4: Left panel: call price function from DAX, 20000613, 3 days to expiry; crosses denote original observations, circles highlight arbitrage opportunities; arbitrage-free spline is denoted by dots connected with a line. Right panel shows lower right details.
20000 3000 4000 5000 6000 7000 8000 9000 10000 0.5
1 1.5 2 2.5 3 3.5 4
ODAX − Implied volatility: 20000613, τ = 0.0154
Strikes
Implied volatility
Figure 5: Implied volatility curve for the 20000613 DAX data, 3 days to expiry. Crosses denote original observations; the arbitrage-free spline is denoted by dots connected with a line.
2000 3000 4000 5000 6000 7000 8000 9000 10000
−0.1 0 0.1 0.2 0.3
Implied volatility residuals: 20000613, tau = 0.0154
Strikes
2000 3000 4000 5000 6000 7000 8000 9000 10000
−3
−2
−1 0 1 2 3
Call price residuals: 20000613, tau = 0.0154
Strikes
2000 3000 4000 5000 6000 7000 8000 9000 10000
−0.4
−0.2 0 0.2 0.4
Relative call price residuals: 20000613, tau = 0.0154
Strikes
Figure 6: Error plots for the DAX data, 20000613, 3 days to expiry. From top to bottom:
implied volatility residuals, call price residuals, relative call price residuals.
55000 6000 6500 7000 7500 8000 8500 9000 200
400 600 800 1000 1200 1400 1600 1800
ODAX − Calls: 20000613, τ = 0.1115
Strikes
Call prices
Figure 7: Call price function from DAX, 20000613, 28 days to expiry; crosses denote original observations, circles highlight arbitrage opportunities; arbitrage-free spline is denoted by dots connected with a line.
5500 6000 6500 7000 7500 8000 8500 0.18
0.2 0.22 0.24 0.26 0.28 0.3 0.32 0.34
ODAX − Implied volatility: 20000613, τ = 0.1115
Strikes
Implied volatility
Figure 8: Implied volatility curve of DAX data, 20000613, 28 days to expiry. Crosses denote original observations; the arbitrage-free spline is denoted by dots connected with a line.
5500 6000 6500 7000 7500 8000 8500 9000
−1.5
−1
−0.5 0 0.5 1
1.5x 10⁻³ Implied volatility residuals: 20000613, tau = 0.1115
Strikes
5500 6000 6500 7000 7500 8000 8500 9000
−1
−0.5 0 0.5 1 1.5
Call price residuals: 20000613, tau = 0.1115
Strikes
5500 6000 6500 7000 7500 8000 8500 9000
−0.02 0 0.02 0.04 0.06
Relative call price residuals: 20000613, tau = 0.1115
Strikes
Figure 9: Error plots for the DAX data, 20000613, 28 days to expiry. From top to bottom:
implied volatility residuals, call price residuals, relative call price residuals.
0 0.5
1 1.5
0.5 1
1.50 0.5 1 1.5 2
Time−to−maturity Arbitrage−free Implied Volatility Surface
Forward−moneyness
Implied Volatility
0 0.5
1 1.5
0.5 1
1.5 0 0.05 0.1 0.15
Time−to−maturity Total Variance Surface
Forward−moneyness
Total Variance
Figure 10: Entire IVS and total variance plot for the DAX data, 20000613, see Table 1 for details.
5 Conclusion
Local volatility pricers require an arbitrage-free implied volatility surface (IVS) as an input – otherwise they produce mispricings and the greeks they indicate are very unstable. This is because arbitrage violations lead to negative transition probabilities in the underlying finite difference scheme. In this paper, we propose a novel algorithm for estimating the IVS in an arbitrage-free manner. For a single time-to-maturity the approach consists in applying a natural cubic spline to the call price functions under suitable linear inequality constraints.
For the entire IVS, we first obtain the fit on a fixed forward-moneyness grid by using a pre-smoother. Second the natural spline smoothing algorithm is applied by stepping from the last time-to-maturity to the first one. This precludes both calendar and strike arbitrage.
The methodology adds to existing algorithms in at least three ways: first the initial data do not need to be arbitrage-free from scratch. Second, the solution is obtained via a par- simonious convex quadratic program that has a unique minimizer. Third, the estimate can be stored efficiently via the value-second derivative representation of the natural spline.
Integration into local volatility pricers is therefore straightforward.
References
A¨ıt-Sahalia, Y. and Duarte, J. (2003). Nonparametric option pricing under shape restrictions, Journal of Econometrics 116: 9–47.
Andersen, L. B. G. and Brotherton-Ratcliffe, R. (1997). The equity option volatility smile:
An implicit finite-difference approach, Journal of Computational Finance 1(2): 5–37.
Black, F. and Scholes, M. (1973). The pricing of options and corporate liabilities, Journal of Political Economy 81: 637–654.
Blum, E. and Oettli, W. (1975). Mathematische Optimierung, Springer, Berlin.
Breeden, D. and Litzenberger, R. (1978). Price of state-contingent claims implicit in options prices, Journal of Business51: 621–651.
Brockhaus, O., Farkas, M., Ferraris, A., Long, D. and Overhaus, M. (2000). Equity deriva- tives and market risk models, Risk Books, London.
Dempster, M. A. H. and Richards, D. G. (2000). Pricing American options fitting the smile, Mathematical Finance 10(2): 157–177.
Derman, E. and Kani, I. (1994). Riding on a smile, RISK 7(2): 32–39.
Dupire, B. (1994). Pricing with a smile, RISK 7(1): 18–20.
Fan, J. (1992). Design adaptive nonparametric regression,Journal of the American Statistical Association 87: 998–1004.
Fan, J. (1993). Local linear regression smoothers and their minimax efficiences, Journal of the American Statistical Association 21: 196–216.
Fan, J. and Gijbels, I. (1992). Variable bandwidth and local linear regression smoothers, Annals of Statistics 21: 196–216.
Fengler, M. R. (2004). Semiparametric Modelling of Implied Volatility, PhD thesis, Humboldt-Universit¨at zu Berlin, Berlin.
Fengler, M. R., H¨ardle, W. and Mammen, E. (2003). Implied volatility string dynamics, Discussion paper, SfB 373, Humboldt-Universit¨at zu Berlin.
Goldfarb, D. and Idnani, A. (1983). A numerically stable dual method for solving strictly convex quadratic programs, Mathematical Programming 27: 1–33.
Green, P. J. and Silverman, B. W. (1994). Nonparametric regression and generalized linear models, Vol. 58 of Monographs on Statistics and Applied Probability, Chapman and Hall, London.
H¨ardle, W. (1990). Applied Nonparametric Regression, Cambridge University Press, Cam- bridge, UK.
H¨ardle, W. and Hl´avka, Z. (2004). Dynamics of state price densities, CASE Discussion Paper, Humboldt-Universit¨at zu Berlin.
H¨ardle, W. and Yatchew, A. (2003). Dynamic state price density estimation using con- strained least squares and the bootstrap, Journal of Econometrics. Forthcoming.
H¨ardle, W., M¨uller, M., Sperlich, S. and Werwatz, A. (2004). Non - and Semiparametric Modelling, Springer Verlag, Heidelberg.
Harrison, J. and Kreps, D. (1979). Martingales and arbitrage in multiperiod securities markets, Journal of Economic Theory 20: 381–408.
Harrison, J. and Pliska, S. (1981). Martingales and stochastic integral in the theory of continuous trading, Stochastic Processes and their Applications 11: 215–260.
Harvey, C. R. and Whaley, R. E. (1991). S&P 100 index option volatility,Journal of Finance 46(4): 1151–1561.
Hastie, T. and Tibshirani, R. (1990). Generalized additive models, Chapman and Hall, London.
Hentschel, L. (2003). Errors in implied volatility estimation,Journal of Financial and Quan- titative Analysis 38: 779–810.
Kahal´e, N. (2004). An arbitrage-free interpolation of volatilities, RISK 17(5): 102–106.
Lee, R. W. (2003). The moment formula for implied volatility at extreme strikes, Mathe- matical Finance. Forthcoming.
Mammen, E. and Thomas-Agnan, C. (1999). Smoothing splines and shape restrictions, Scandinavian Journal of Statistics 26: 239–252.
Mammen, E., Marron, J. S., Turlach, B. A. and Wand, M. P. (2001). A general framework for constrained smoothing, Statistical Science16(3): 232–248.
Merton, R. C. (1973). Theory of rational option pricing, Bell Journal of Economics and Management Science4(Spring): 141–183.
Nadaraya, E. A. (1964). On estimating regression,Theory of Probability and its Applications 10: 186–190.
Reinsch, C. R. (1967). Smoothing by spline functions, Numerische Mathematik10: 177–183.
Reinsch, C. R. (1971). Smoothing by spline functions II, Numerische Mathematik 16: 451–
454.
Roll, R. (1984). A simple implicit measure of the effective bid-ask spread,Journal of Finance 39: 1127–1139.
Rubinstein, M. (1994). Implied binomial trees, Journal of Finance49: 771–818.
Turlach, B. A. (1997). Constrained smoothing splines revisited,Technical report, Australian National University, Canberra.
Wahba, G. (1990). Spline Models for Observational Data, SIAM, Philadelphia.
Watson, G. S. (1964). Smooth regression analysis, Sankyh¯a, Series A 26: 359–372.
A Transformation formulae
To switch from the value-second derivative representation to the piecewise polynomial rep- resentation (12) employ:
ai = gi bi = gi+1h−gi
i − h6i(2γi+γi+1) ci = γ2i
di = γi+16h−γi
i
(33)
for i= 1, . . . , n−1. Furthermore,
a0 =a1 =g1, an =gn, b0 =b1, c0 =d0 =cn =dn= 0, and
bn=s0n−1(un) = bn−1+ 2cn−1hn−1+ 3dn−1h2n−1 = gn−gn−1
hn−1
+ hi
6(γn−2+ 2γn), where hi =ui+1−ui for i= 1, . . . , n−1 and γ1 =γn= 0.
Changing vice versa is accomplished by:
gi = si(ui) = ai for i = 1, . . . , n , γi = s00i(ui) = 2ci for i = 2, . . . , n−1, γ1 = γn = 0.
(34)
SFB 649 Discussion Paper Series
For a complete list of Discussion Papers published by the SFB 649, please visit http://sfb649.wiwi.hu-berlin.de.
001 "Nonparametric Risk Management with Generalized Hyperbolic Distributions" by Ying Chen, Wolfgang Härdle and Seok-Oh Jeong, January 2005.
002 "Selecting Comparables for the Valuation of the European Firms" by Ingolf Dittmann and Christian Weiner, February 2005.
003 "Competitive Risk Sharing Contracts with One-sided Commitment" by Dirk Krueger and Harald Uhlig, February 2005.
004 "Value-at-Risk Calculations with Time Varying Copulae" by Enzo Giacomini and Wolfgang Härdle, February 2005.
005 "An Optimal Stopping Problem in a Diffusion-type Model with Delay" by Pavel V. Gapeev and Markus Reiß, February 2005.
006 "Conditional and Dynamic Convex Risk Measures" by Kai Detlefsen and Giacomo Scandolo, February 2005.
007 "Implied Trinomial Trees" by Pavel Čížek and Karel Komorád, February 2005.
008 "Stable Distributions" by Szymon Borak, Wolfgang Härdle and Rafal Weron, February 2005.
009 "Predicting Bankruptcy with Support Vector Machines" by Wolfgang Härdle, Rouslan A. Moro and Dorothea Schäfer, February 2005.
010 "Working with the XQC" by Wolfgang Härdle and Heiko Lehmann, February 2005.
011 "FFT Based Option Pricing" by Szymon Borak, Kai Detlefsen and Wolfgang Härdle, February 2005.
012 "Common Functional Implied Volatility Analysis" by Michal Benko and Wolfgang Härdle, February 2005.
013 "Nonparametric Productivity Analysis" by Wolfgang Härdle and Seok-Oh Jeong, March 2005.
014 "Are Eastern European Countries Catching Up? Time Series Evidence for Czech Republic, Hungary, and Poland" by Ralf Brüggemann and Carsten Trenkler, March 2005.
015 "Robust Estimation of Dimension Reduction Space" by Pavel Čížek and Wolfgang Härdle, March 2005.
016 "Common Functional Component Modelling" by Alois Kneip and Michal Benko, March 2005.
017 "A Two State Model for Noise-induced Resonance in Bistable Systems with Delay" by Markus Fischer and Peter Imkeller, March 2005.
SFB 649, Spandauer Straße 1, D-10178 Berlin http://sfb649.wiwi.hu-berlin.de
This research was supported by the Deutsche
018 "Yxilon – a Modular Open-source Statistical Programming Language" by Sigbert Klinke, Uwe Ziegenhagen and Yuval Guri, March 2005.
019 "Arbitrage-free Smoothing of the Implied Volatility Surface"
by Matthias R. Fengler, March 2005.
SFB 649, Spandauer Straße 1, D-10178 Berlin http://sfb649.wiwi.hu-berlin.de
This research was supported by the Deutsche