Twenty-Sixth European Conference on Information Systems (ECIS2018), Portsmouth,UK, 2018
Research paper
Heinrich, Bernd, University of Regensburg, Regensburg, Germany, Bernd.Heinrich@ur.de Klier, Mathias, University of Ulm, Ulm, Germany, Mathias.Klier@uni-ulm.de
Obermeier, Andreas, University of Ulm, Ulm, Germany, Andreas.Obermeier@uni-ulm.de Schiller, Alexander, University of Regensburg, Regensburg, Germany,
Alexander.Schiller@ur.de
Abstract
The importance of probability-based approaches for duplicate detection has been recognized in both research and practice. However, existing approaches do not aim to consider the underlying real-world events resulting in duplicates (e.g., that a relocation may lead to the storage of two records for the same customer, once before and after the relocation). Duplicates resulting from real-world events exhibit specific characteristics. For instance, duplicates resulting from relocations tend to have significantly different attribute values for all address-related attributes. Hence, existing approaches focusing on high similarity with respect to attribute values are hardly able to identify possible duplicates resulting from such real-world events. To address this issue, we propose an approach for event-driven duplicate de- tection based on probability theory. Our approach assigns the probability of being a duplicate resulting from real-world events to each analysed pair of records while avoiding limiting assumptions (of existing approaches). We demonstrate the practical applicability and effectiveness of our approach in a real- world setting by analysing customer master data of a German insurer. The evaluation shows that the results provided by the approach are reliable and useful for decision support and can outperform well- known state-of-the-art approaches for duplicate detection.
Keywords: Duplicate detection, Record linkage, Entity resolution, Data quality.
1 Introduction
Organizations continue to rely more and more on large amounts of data to gain competitive advantage and to support decision-making (Ngai et al., 2017). However, poor data quality impedes organizations from generating high value based on their data (Heinrich et al., 2018a; Heinrich et al., 2018b; Moges et al., 2016). For instance, in a survey by Experian Information Solutions (2016), 83% of participants in- dicated that data quality problems have hurt their business objectives. According to Gartner, poor data quality is estimated to cost organizations on average $9.7 million per year (Moore, 2017). One of the most prevalent and critical reasons for poor data quality are duplicates (Fan, 2015; Helmis and Hollmann, 2009), pairs of records that represent the same real-world entity (Draisbach and Naumann, 2011). Duplicates are known to cause a large variety of problems, for instance misjudgements of cus- tomers (Bleiholder and Schmid, 2015), incorrect strategic and operational decisions (Helmis and Hollmann, 2009) and additional operative expenses (Draisbach, 2012). Thus, detecting duplicates has long been recognized to be of crucial importance in many areas, such as master data management, data warehousing, customer relationship management (CRM), fraud detection and healthcare (Elmagarmid et al., 2007; Fan, 2015; Hua and Pei, 2012). Major goal of approaches for duplicate detection is to iden- tify such duplicates in order to allow, for instance, a subsequent merge into a single (“golden”) record.
Twenty-Sixth European Conference on Information Systems (ECIS2018), Portsmouth,UK, 2018 2 Duplicates in datasets occur due to different reasons. For instance, failures during (repeated) data cap- turing which provoke misreported values (e.g., typos) result in duplicates which differ to some extent but tend to have similar attribute values. Besides, a more complex cause for duplicates are events in the real-world which change how a real-world entity should correctly be stored in a dataset hosted by an organization. For example, a marriage as an event can change the last name of a person. In case this event is unknown to the hosting organization, the last name of this person is not changed in the dataset.
If this person is now stored a second time in the dataset, for example because s/he buys a product of the organization or concludes a contract, this leads to two stored records with a different value of the attrib- ute last name, but representing the same person. In the following, we refer to events such as marriage as “real-world events”, because they change the “state” of the considered real-world entity. Existing approaches for duplicate detection typically focus on (syntactic) similarities (cf. Section 3) and thus do not aim to cope with real-world events and their methodical consideration.
However, taking real-world events into account is crucial for duplicate detection in many application areas such as CRM. This importance is underlined by several studies. For instance, Schönfeld (2007) analysed a customer database of a company with more than 20 million customers. Here, every year about 2 million customers changed their place of residence (event “relocation”) and 60,000 got divorced, resulting in a large number of duplicates. Ignoring such data quality defects resulted in an annual loss of more than EUR 2 million for the company just based on inadequate customer contacts (Franz and von Mutius, 2008). In a B2B-context, analyses of Kraus (2004) on a dataset of business customers document that the contact person changed with a rate of 20% to 35% per year, depending on their posi- tion. This means that duplicates were caused by events such as “promotion” and “relocation” within a company. To summarize, in these studies “changes” are interpretable as real-world events resulting in a large number of duplicates. More generally, duplicates in datasets are often caused by real-world events.
Considering real-world events adds uncertainty to the task of identifying duplicates, when the organiza- tion hosting the considered dataset does not know whether such events occurred (cf. Section 2). We argue that the principles and the knowledge base of probability theory are adequate and valuable, provid- ing well-founded methods to describe and analyse situations under uncertainty. More precisely, we base our approach on probability theory and aim to give an indication rather than a certain statement in regard to whether a specific pair of records is a duplicate resulting from a real-world event. Thus, the presented event-driven approach for detecting duplicates provides a way to detect duplicates not yet targeted by existing approaches (cf. Section 3). Moreover, the proposed approach addresses an important and rele- vant data quality problem.
The remainder of the paper is structured as follows: In Section 2, we introduce our problem context and a running example, which is then used to discuss related work and to clarify the research gap in Sec- tion 3. In Section 4, we step-by-step develop our event-driven probability-based approach for duplicate detection. Section 5 contains the evaluation of the practical applicability and effectiveness of the ap- proach using real-world customer master data from a German insurer. Finally, we conclude, reflect on limitations and provide an outlook on future research.
2 Problem Context and Running Example
We illustrate our problem context using a customer dataset, which serves as running example throughout the paper. A real-world event typically resulting in a large number of duplicates in customer datasets is relocation. This event changes the place of residence of a customer, which is usually represented by address-related attributes such as street, ZIP code and city, while other attributes such as first name, last name and date of birth remain unchanged. If a customer is once more stored in a customer dataset after relocation, two records representing the same customer emerge. Table 1 shows four customer records and their respective values for the attributes first name, last name, street, ZIP code, city and date of birth.
The first two records with IDs 1 and 2 exhibit a typical pattern for the real-world event relocation: All non-address-related attribute values (first name, last name and date of birth) agree whereas all address- related attribute values (street, ZIP code and city) differ significantly. Using a non-event-driven ap- proach for duplicate detection may require high similarity with respect to attribute values to identify
Twenty-Sixth European Conference on Information Systems (ECIS2018), Portsmouth,UK, 2018 3 possible duplicates. This may lead to a false negative error in this case of a duplicate. This is because not considering the event relocation means that the cause behind the significant differences between the address-related attribute values is neglected. Thus, the records with IDs 1 and 2 may be incorrectly classified as non-duplicate due to significant differences with respect to some attributes (i.e., street, ZIP code and city). On the other hand, pairs of similar records with different values for some specific attrib- utes may not only result from real-world events but also by pure chance. In the context of the customer dataset, one could think about two different Mary Smiths living in different cities and sharing the same date of birth. Therefore, it cannot be said with certainty whether pairs of records exhibiting the typical relocation pattern are indeed duplicates or not without a so-called real-world check. Moreover, the rec- ords with IDs 3 and 4 in Table 1 illustrate that even more complex cases exist: Here, only the values for city and street differ while typos or other errors complicate the analysis. To conclude, the example il- lustrates that just based on the mere records, it cannot be said with certainty whether a pair of records is a duplicate or not. We refer to this fact as the first layer of uncertainty. In addition, it is not clear whether real-world entities were stored in a dataset multiple times as consequence of a real-world event, causing duplicates. We refer to this fact as additional second layer of uncertainty. These aspects emphasize the need for an event-driven probability-based approach for duplicate detection.
ID First Name Last Name Street ZIP Code City Date of Birth
1 Mary Smith Main Street 1 98101 Seattle 18.07.1967
2 Mary Smith South Road 3 10005 New York 18.07.1967
3 Franklin Jefferson Jennifer Road 17 90120 Beverly Hills 20.02.1952 4 Franklin Jefferson Jenifer Road 17 90120 Los Angeles 20.02.1952 Table 1. Illustration of four records in a customer dataset (running example)
3 Related Work
Literature provides many well-known approaches for duplicate detection (Christen, 2012; Elmagarmid et al., 2007; Winkler, 2006). The two major strategies for duplicate detection are probability-based vs.
deterministic duplicate detection (Tromp et al., 2011). As our focus is on duplicates resulting from pos- sible real-world events, a probability-based approach addressing both layers of uncertainty is needed. In addition, commonly used deterministic approaches often rely on very complex handcrafted rulesets (Hettiarachchi et al., 2014) and cannot outperform probability-based approaches (Tromp et al., 2011).
Thus, in the following, we focus on probability-based approaches.
Based on prior work of Newcombe et al. (1959), the classical probability-based framework for duplicate detection was presented by Fellegi and Sunter (1969). This work serves as foundation for various prob- ability-based approaches for duplicate detection (e.g., Belin and Rubin, 1995; DuVall et al., 2010;
Schürle, 2005; Steorts, 2015; Steorts et al., 2016; Thibaudeau, 1992; Winkler, 1988; Winkler, 1993).
Approaches based on the work of Fellegi and Sunter (1969) share the main concept of grasping syntac- tical agreements and similarities as distinctive characteristic of duplicates. They address the first layer of uncertainty by modelling the probability of a given pair of records to be a duplicate conditioned on agreements and similarities of the respective records’ attribute values. To quantify the syntactical agree- ments and similarities, a comparison vector is introduced. More precisely, the components of the com- parison vector are values between zero and one according to the outcome of comparisons performed on the attribute values of a pair of records. These comparisons might lead to binary outcomes (e.g., “value of attribute a agrees”) or continuous outcomes (e.g., “Jaro-similarity of the values of attribute a”). Based on its comparison vector, each analysed pair of records is classified into one of three mutually exclusive subsets: the set of duplicates, the set of non-duplicates and the set of pairs requiring manual review.
Thereby, existing approaches based on the Fellegi-Sunter framework are defined based on two key lim- iting assumptions: (L1) the classification relies on syntactical agreements and similarities without con- sidering the underlying causes of potential duplicates as second layer of uncertainty and (L2) the clas- sification incorporates decision rules based on (L2a) independence or (L2b) monotonicity assumptions.
Twenty-Sixth European Conference on Information Systems (ECIS2018), Portsmouth,UK, 2018 4 These assumptions, which are discussed in more detail in the following, may lead to misclassifications as the causes of duplicates have crucial influence on the syntactical similarities (Lehti and Fankhauser, 2006) and the assumptions made are often violated in practical applications (cf., e.g., Belin and Rubin, 1995; Christen, 2008a; Thibaudeau, 1992).
Ad (L1): Not considering the underlying causes for duplicates can lead to false negatives as the seman- tics behind possible disagreements or low similarities for some attribute values are not grasped. In the running example in Table 1, the records with the IDs 1 and 2 represent the same person, which relocated.
The disagreements for the address-related attribute values are represented in terms of low or zero values for the corresponding entries of the comparison vector. Approaches based on these syntactical compar- isons are prone to wrongly classify such pairs as non-duplicates. This may lead to the potential misclas- sification of a large number of duplicates caused by relocations, or, more generally, real-world events.
To the best of our knowledge, none of the existing approaches addresses the second layer of uncertainty resulting from real-world events causing duplicates.
Ad (L2a): The decision rule presented by Fellegi and Sunter (1969) relies on independence assumptions regarding the agreements across attributes (i.e., agreement/disagreement in one attribute does not influ- ence agreement/disagreement in other attributes). Many subsequent approaches continue to use these independence assumptions even though they were shown to be violated in most practical applications (cf. Belin and Rubin, 1995; Thibaudeau, 1992). An example for an obvious violation of the independ- ence assumption is provided in Table 1: If two records agree in their value with respect to the attribute ZIP code, an agreement for the attribute city becomes much more likely and vice versa (Tromp et al., 2011). Another example of dependencies in datasets is the fact that people form households (i.e., differ- ent real-world persons share the same address). As household members often have identical last names, this leads to natural dependencies between address-related attributes and the attribute last name (Thi- baudeau, 1992). Therefore, approaches relying on independence assumptions tend to lead to inadequate results as these assumptions are violated in many practical applications.
Against this background, several works have tried to alleviate the independence assumptions. In partic- ular, important contributions with respect to a relaxation of the independence assumptions have been presented by Thibaudeau (1992), Winkler (1993) as well as Larsen and Rubin (2001). Thibaudeau (1992) introduces a model tailored to account for certain dependencies among address-related attributes of non-duplicates based on an empirical correlation analysis. Winkler (1993) suggests to include a spec- ified small set of interactions, for example all three-way interactions or a selection of interactions based on knowledge of some true duplicate statuses. This selection of modelled dependencies is taken up by Larsen and Rubin (2001). As these authors state, the selection of dependencies to be modelled relies on personal knowledge and experience. In addition, all of the proposed methods are only suitable for binary comparisons and do not cover continuous similarity-based comparisons (Lehti and Fankhauser, 2006).
Moreover, the explicit modelling of all possible interactions between all attributes is computationally expensive, as the number of parameters to be fitted rises strongly. The high number of parameters also causes potential overfitting. In summary, the proposed works are able to relax the independence assump- tions hampering probability-based approaches. However, they suffer from limitations regarding practi- cal applicability and complexity.
Ad (L2b): Other approaches (Ravikumar and Cohen, 2004; Lehti and Fankhauser, 2006) avoid the in- dependence assumptions by replacing them with a monotonicity assumption. This monotonicity as- sumption states that higher similarities of attribute values lead to a higher probability of being a duplicate and vice versa. However, this assumption is also violated in many practical applications. For example, after a relocation, a high similarity of the new values to the respective old values for address-related attributes may or may not occur, depending on chance. In fact, even an increase in probability with lower similarity is possible. For instance, as illustrated by the records with the IDs 3 and 4 in Table 1, “Los Angeles” is often used instead of the actual city name “Beverly Hills”. Such commonly used syntactical dissimilar attribute values are an example for the violation of the monotonicity assumption, as many pairs of records exhibit low similarities despite being duplicates (Christen, 2008). Therefore, approaches relying on the monotonicity assumption may also lead to inadequate results, as monotonicity is not guaranteed in many practical applications.
Twenty-Sixth European Conference on Information Systems (ECIS2018), Portsmouth,UK, 2018 5 To conclude, existing approaches for probability-based duplicate detection are either based on limiting independence or monotonicity assumptions or are severely restricted in their applicability by relaxing the independence assumptions. Moreover, none of these approaches considers the second layer of un- certainty arising from the underlying causes for duplicates, which means, they are hardly able to identify possible duplicates resulting from real-world events. To address this research gap, we propose an event- driven probability-based approach for duplicate detection in the following.
4 A Novel Approach for Duplicate Detection
In this section, we present a novel approach for duplicate detection. First, we outline the general setting and the basic idea. Then, we discuss our approach, which comprises two steps. Finally, we outline pos- sible ways to instantiate the approach.
4.1 General setting and basic idea
We consider a dataset with records representing entities by means of attributes (e.g., a relation in a database). The set of records is denoted by 𝑇 = {𝑡1, … , 𝑡𝑛} and the set of attributes by {𝑎1, … , 𝑎𝑚}. In our running example of a customer dataset (cf. Table 1), for instance, the attribute value of first name for 𝑡1 is Mary. The set 𝑇 × 𝑇 contains all pairs (𝑡𝑖, 𝑡𝑗) of records. Pairs of records in 𝐶 ≔ {(𝑡𝑖, 𝑡𝑗) ∈ 𝑇 × 𝑇 | 𝑖 ≠ 𝑗} may possibly be a duplicate (e.g., if both records 𝑡1 and 𝑡2 represent the same real-world entity). The aim of approaches for duplicate detection is to analyse such pairs of records. Thereby, two layers of uncertainty have to be considered (cf. Section 2):
1. Based on the mere records (i.e., only considering the attribute values of the records) it cannot be said with certainty whether a pair of records is a duplicate.
2. It is not clear whether real-world entities were stored in a dataset multiple times as consequence of a real-world event such as marriage or relocation, causing duplicates.
As described in the previous section, existing probability-based approaches addressing the first layer of uncertainty are defined based on limiting assumptions such as independence or monotonicity. Instead, our approach addresses this layer of uncertainty by determining a probability for each pair of records to be a duplicate while avoiding these assumptions. Moreover, the clear interpretation of the results of our approach as probabilities has further advantages. For instance, it allows the integration into a decision calculus (e.g., based on decision theory) to support decision-making in a well-founded manner.
Another disadvantage of existing approaches (cf. Section 3) is that they are hardly able to identify du- plicates caused by real-world events, because the second layer of uncertainty is not considered. For instance, in a customer dataset, this can lead to a large number of undetected duplicates caused by relo- cations or marriages. In our approach the second layer of uncertainty is addressed by explicitly analysing pairs of records in regard to being a duplicate caused by real-world events. More precisely, to represent the second layer of uncertainty, we model the interrelation of a pair of records as an outcome in the probability space (𝛺, 2𝛺, 𝑃). Thereby, 𝛺 includes all outcomes representing a duplicate and the comple- mentary outcome that the pair of records is no duplicate. We particularly refer to outcomes 𝐸1, …, 𝐸𝑟 representing a duplicate caused by real-world events. More precisely, 𝐸𝑘 represents the outcome “du- plicate caused by real-world event 𝑘” (𝑘 = 1, … , 𝑟) with 𝑟 as the number of relevant real-world events.
For instance, the real-world event “marriage” may be expressed by outcome 𝐸1 and the real-world event
“relocation” by outcome 𝐸2. The probability measure 𝑃 assigns a probability to each event. For our approach, we focus on the values 𝑃(𝐸𝑘) for each real-world event 𝑘, representing the probability that a considered pair of records is a duplicate caused by real-world event 𝑘. In this way, the probability for a pair of records to be a duplicate caused by, for instance, a marriage or a relocation is specified.
The basic idea of our approach for duplicate detection is to accurately model the probability space (𝛺, 2𝛺, 𝑃) by grounding the approach on the real-world events 𝐸1, …, 𝐸𝑟 (Step 1) and formalizing the probabilities 𝑃(𝐸𝑘) for all analysed pairs of records (Step 2).
Twenty-Sixth European Conference on Information Systems (ECIS2018), Portsmouth,UK, 2018 6 4.2 Event-driven approach for duplicate detection
Our approach consists of two steps. First, we ground our approach on real-world events causing dupli- cates. Second, we formalize the conditional probability that a pair of records is a duplicate caused by a specific real-world event.
4.2.1 Step 1: Grounding the approach on real-world events
The probability space (𝛺, 2𝛺, 𝑃) defined in the previous section provides the basis for our approach. To address shortcomings of existing approaches, we explicitly model real-world events causing duplicates within this probability space. In the first step, these real-world events need to be determined. For a specific dataset, the real-world events causing duplicates can be obtained in multiple ways. For example, they can be derived from analysis or may be inferred by the user or a domain expert (cf. Section 4.3.1).
Each real-world event is included in the set of outcomes 𝛺. This way, the set {𝐸1, … , 𝐸𝑟} ⊂ 𝛺 is formed with 𝐸𝑘 representing the outcome “duplicate caused by real-world event 𝑘”. For instance, outcome 𝐸1 may represent duplicates caused by relocations, outcome 𝐸2 duplicates caused by marriages, and out- come 𝐸3 duplicates caused by the combination of these two real-world events.
Our approach aims to determine a probability for a pair of records to be a duplicate caused by a real- world event. This probability is estimated by the probability measure 𝑃. 𝑃(𝐸𝑘) represents the probability that a pair of records is a duplicate caused by real-world event 𝑘. Thus, for a probability estimation based on the outcomes 𝐸1, … , 𝐸𝑟, the corresponding values 𝑃(𝐸1), … , 𝑃(𝐸𝑟) have to be determined for each pair of records. These probabilities depend on the pair of records (𝑡𝑖, 𝑡𝑗). In particular, characteristic patterns of interrelations – possibly pointing to a specific real-world event – can be considered for the probability estimation. To give an example, matching first name and last name but different address and ZIP code may indicate a relocation. More generally, such characteristic patterns may for instance include matching or missing attribute values and are given by (a subset of) the attribute values of the two records 𝑡𝑖 and 𝑡𝑗. Thus, when determining the probabilities 𝑃(𝐸𝑘), it is necessary to condition on (𝑡𝑖, 𝑡𝑗). More- over, further data which helps to determine 𝑃(𝐸𝑘) more accurately may be available. This may be data derived from the dataset to be analysed (different from the attribute values of 𝑡𝑖 and 𝑡𝑗) or external data.
For illustration purposes, consider the case of a customer dataset. Here, ceteris paribus, two records with the same very rare last name are more likely to be a duplicate than two records with the same very common last name. Thus, for instance, useful additional data derived from the dataset to be analysed may be relative frequencies of last names, indicating how common the last name of the pair of records is. External additional data can, for instance, be empirical data from a Federal Statistical Office provid- ing the number of relocations per year for the respective geographical region. Conditioning on such additional data Z allows to account for any further data available and more accurately determine 𝑃(𝐸𝑘).
If additional data is not available for a particular pair of records, missing values may be replaced by estimations (e.g., by integrating over the probability space).
To sum up, the approach is grounded on real-world events by modelling the probability space (𝛺, 2𝛺, 𝑃) as follows: Relevant real-world events are included as outcomes 𝐸1, … , 𝐸𝑟 in 𝛺. Based on this, the con- ditional probabilities 𝑃(𝐸𝑘|(𝑡𝑖, 𝑡𝑗), 𝑍) need to be determined for each real-world event 𝑘 contained in 𝛺.
Then, 𝑃(𝐸𝑘|(𝑡𝑖, 𝑡𝑗), 𝑍) represents the probability that the pair of records (𝑡𝑖, 𝑡𝑗) ∈ 𝐶 resulted from 𝑘, conditioned on the pair of records (𝑡𝑖, 𝑡𝑗) and additional data 𝑍. Thus, 𝑃(𝐸𝑘|(𝑡𝑖, 𝑡𝑗), 𝑍) expresses the probability that (𝑡𝑖, 𝑡𝑗) is a duplicate resulting from the real-world event 𝑘.
4.2.2 Step 2: Formalizing the conditional probabilities
As introduced above, the term 𝑃(𝐸𝑘|(𝑡𝑖, 𝑡𝑗), 𝑍) represents the probability that (𝑡𝑖, 𝑡𝑗) is a duplicate re- sulting from the real-world event 𝑘. Conditioning on the pair of records (𝑡𝑖, 𝑡𝑗) and on additional data 𝑍 needs to be formalized to enable an application. To do so, both the information on the interrelation of the pair of records and the additional data 𝑍 can be expressed by numerical values. To give an example, the agreement or non-agreement of attribute values of (𝑡𝑖, 𝑡𝑗) can be indicated by the values 1 and 0. For
Twenty-Sixth European Conference on Information Systems (ECIS2018), Portsmouth,UK, 2018 7 concise representation, these numerical values are combined in a vector which is called feature vector in the following. It can be seen as a generalization of the comparison vectors used in other approaches for duplicate detection (e.g., using syntactical similarity measures). To allow for maximum flexibility with respect to the interrelations and additional data used, no kind of independence, monotonicity or other specific interrelation between the components of our feature vector is assumed (cf. research gap at the end of Section 3). The feature vector may be defined differently for each real-world event 𝑘 to allow taking the specific aspects of real-world events into account. More precisely, the feature vector is formed by mapping (𝑡𝑖, 𝑡𝑗) and 𝑍 onto a 𝑓𝑘-dimensional outcome-specific vector ζ𝑘≔ 𝐶 → ℝ𝑓𝑘, 𝑓𝑘 ∈ ℕ, so that it holds 𝑃(𝐸𝑘|(𝑡𝑖, 𝑡𝑗), 𝑍) = 𝑃 (𝐸𝑘|𝜁𝑘((𝑡𝑖, 𝑡𝑗))) for outcome 𝐸𝑘.
Duplicates caused by a real-world event often exhibit a particular characteristic. To identify pairs of records showing this characteristic, similarity measures for all attributes can be taken into account as component of 𝜁𝑘. For instance, in the context of our running example, the real-world events relocation and marriage lead to different specific characteristics of the resulting pairs of records: For duplicates caused by relocations, the similarity between the address-related attribute values is usually low, whereas for duplicates caused by marriages, the similarity between the last names is usually low. Additional data helpful for determining more accurate probability estimations can be incorporated into these compo- nents as well or into additional components of the feature vector. For instance, the rate of relocations depending on the age or marital status or the frequency of last names can be considered this way.
4.3 Possible ways to instantiate the approach
In the following, we describe how our approach can be instantiated. Both the identification of relevant real-world events as well as the determination of conditional probabilities are discussed.
4.3.1 Identification of relevant real-world events
Duplicate detection is an important task in many domains (Cohen and Richman, 2002; Fan, 2015; Hua and Pei, 2012; Lehti and Fankhauser, 2006). In each domain, different real-world events may lead to duplicates. Thus, for a dataset to be analysed, the relevant real-world events need to be determined. We propose three different ways to obtain them: (a) Review of publicly available data and publications (e.g., from public or scientific sources), (b) Analysis of company-owned data, and (c) Surveying experts.
Ad (a): A promising option to identify relevant real-world events is to analyse publicly available data and publications. For instance, the German Federal Statistical Office offers detailed data about the pop- ulation of Germany and thus for many typical attributes of master data. To give an example, extensive data on the migration in Germany is available at fine granular level. Moreover, publications can be reviewed to obtain the causes of duplicates in datasets. For example, Bilenko and Mooney (2002) discuss how differently used city names relate to duplicates in a restaurant database. Finally, publicly available datasets containing identified duplicates can be analysed to determine relevant real-world events.
Ad (b): The dataset to be analysed or other company-owned data may be examined. To obtain relevant real-world events, a sufficient number of duplicates can be (e.g., manually) identified. Afterwards, the underlying causes for these duplicates can be determined and categorized into different real-world events. Also, for instance, data about orders and transactions may be captured in multiple departments.
Then, data captured by one department may be used to support detecting duplicates in another.
Ad (c): Another possible way is surveying experts. This may be reasonable if neither external nor inter- nal data is available for analysis, if the analysis is too time-consuming and costly or if the major causes for duplicates in the dataset to be analysed are already known by domain experts. For example, instead of analysing a given dataset, a company’s key account managers may be surveyed to determine the main causes for duplicates in the company’s databases. For instance, key account managers may know about the common practice of some customers who intentionally create duplicate accounts in order to surrep- titiously receive monetary bonuses for new customers, causing duplicates.
Twenty-Sixth European Conference on Information Systems (ECIS2018), Portsmouth,UK, 2018 8 4.3.2 Determination of conditional probabilities
Our approach is based on the conditional probabilities 𝑃(𝐸𝑘|(𝑡𝑖, 𝑡𝑗), 𝑍) resp. 𝑃 (𝐸𝑘|𝜁𝑘((𝑡𝑖, 𝑡𝑗))) for each real-world event 𝑘 (cf. Step 2). We briefly describe two common ways to determine these proba- bilities: (i) Estimation based on training data and (ii) Estimation based on surveying experts.
Ad (i): The first possibility refers to the analysis of training data containing pairs of records for which it is known whether they are a duplicate caused by a specific real-world event or not. One way to obtain such data is to manually label a sample of potential duplicates (𝑡𝑖, 𝑡𝑗) in the dataset to be analysed. For example, if a customer dataset is to be assessed, a random sample of pairs of customer records (𝑡𝑖, 𝑡𝑗) can be drawn and labelled by hand. To ensure reliable results, the sample should be representative and sufficiently large, which can be underpinned using statistical tests. For domain experts, such a manual labelling is usually straightforward to carry out and can be performed with a high degree of reliability (i.e., expert estimations will not substantially change over time or between experts). Another possible source for training data is company-owned (historical) data. The historical data may, for example, stem from previous data quality projects. This represents an opportunity to reuse results of analyses (i.e., duplicates recognized by customer feedback) conducted in the past, not requiring additional effort. Fi- nally, conducting a study is a further possibility to generate training data. For the example of a customer dataset, a random sample of pairs of records (𝑡𝑖, 𝑡𝑗) can be drawn and the respective customers can be surveyed. This is equivalent to a real-world check for these pairs of records. Moreover the results of the survey can also be used to assess the duplicate status of the customers not part of the survey.
The feature vectors of the pairs of records in the training data can then be used to obtain an estimation for the conditional probability 𝑃 (𝐸𝑘|𝜁𝑘((𝑡𝑖, 𝑡𝑗))) for a pair of records (𝑡𝑖, 𝑡𝑗). We propose two methods for this estimation: an interval-based approach and kernel density estimation. Both of these methods can be performed with a high degree of automation and require little computational effort.
For the interval-based approach, 𝐻 sets of intervals 𝐼ℎ,𝑙 ⊂ ℝ, 1 ≤ 𝑙 ≤ 𝑓𝑘 and 1 ≤ ℎ ≤ 𝐻 (with 𝐻 ∈ ℕ) are defined. Each set contains 𝑓𝑘 intervals (one interval for each dimension of the feature vector ζ𝑘).
Then, for each set of intervals a multidimensional interval 𝐼ℎ⊂ ℝ𝑓𝑘 with 𝐼ℎ= 𝐼ℎ,1× 𝐼ℎ,2× … × 𝐼ℎ,𝑓𝑘 is constructed. Finally, the relative frequency 𝜚𝑘,ℎ of duplicates caused by real-world event 𝑘 in 𝐼ℎ is calculated based on the training data. The relative frequency 𝜚𝑘,ℎ can be determined efficiently (e.g., via a simple database query) and is used to estimate 𝑃 (𝐸𝑘|𝜁𝑘((𝑡𝑖, 𝑡𝑗))) for (𝑡𝑖, 𝑡𝑗) with 𝜁𝑘((𝑡𝑖, 𝑡𝑗)) ∈ 𝐼ℎ:
𝑃 (𝐸𝑘|𝜁𝑘((𝑡𝑖, 𝑡𝑗))) ≈ 𝜚𝑘,ℎ (1)
However, in some scenarios, it might be difficult to determine an appropriate set of intervals to apply the interval-based approach. Therefore, we further propose a nonparametric density estimation method called multivariate conditional kernel density estimation (Elgammal et al., 2002; Scott, 2015). Gene- rally, any density function 𝑃(𝑥) of a random variable 𝑥 can be estimated using a kernel density estimator 𝑓̂(𝑥). Based on a sample 𝑥𝑖 (with 𝑖 = 1, … , 𝑛) drawn from 𝑥, the distribution of 𝑥 is estimated by sum- ming up and normalizing multivariate kernel functions 𝐾 placed over the values of 𝑥𝑖:
𝑓̂(𝑥) = 1
𝑛∑𝑛𝑖=1𝐾(𝑥 − 𝑥𝑖)≈ 𝑃(𝑥) (2)
Typically, Gaussians are used as kernel functions. As the kernel density estimator asymptotically con- verges to the density function, it can be used even if the underlying density is not known. In our setting, kernel density estimation can be used to estimate the conditional density 𝑃 (𝐸𝑘|𝜁𝑘((𝑡𝑖, 𝑡𝑗))) for a pair of records (𝑡𝑖, 𝑡𝑗) based on training data. Here, the definition of conditional probabilities is applied and numerator and denominator are estimated separately by multivariate kernel density estimation:
𝑃 (𝐸𝑘|𝜁𝑘((𝑡𝑖, 𝑡𝑗))) =𝑃(𝜁𝑘((𝑡𝑖,𝑡𝑗))⋀ 𝐸𝑘)
𝑃(𝜁𝑘((𝑡𝑖,𝑡𝑗))) ≈𝑓̂(𝜁𝑘((𝑡𝑖,𝑡𝑗))⋀ 𝐸𝑘)
𝑓̂(𝜁𝑘((𝑡𝑖,𝑡𝑗))) (3)
Twenty-Sixth European Conference on Information Systems (ECIS2018), Portsmouth,UK, 2018 9 Ad (ii): As another option, estimations of the conditional probabilities 𝑃 (𝐸𝑘|𝜁𝑘((𝑡𝑖, 𝑡𝑗))) based on experts’ assessments can be used. For example, to detect duplicates caused by marriages in a customer dataset, experts could be surveyed and asked to estimate the probability of a pair of records being a duplicate caused by a marriage for different attribute values of the customers.
5 Evaluation
In this section we evaluate (E1) the practical applicability and (E2) the effectiveness of our approach for duplicate detection. First, we discuss the reasons for selecting the case of an insurer and describe the analysed customer dataset. Then, we show how the approach could be instantiated for this case. Finally, we present the results of its application and compare them to those of a state-of-the-art approach.
5.1 Case selection and dataset
To evaluate (E1) and (E2), the approach was applied to a customer dataset of a major German provider of life insurances. As the insurance contracts typically last a long time, the customers are likely to relo- cate during the contract term. If a customer contacts the insurer after relocation and the customer is not associated with the existing record, a duplicate record is stored. Such duplicates are a major source of data quality problems in the insurer’s customer master data. However, this data is of particular im- portance for the insurer (e.g., for CRM). Hence, the insurer aimed to identify respective duplicates.
To apply and evaluate our approach with regard to detecting duplicates caused by a real-world event, the insurer provided us with a subset of its customer record data containing four master data attributes.
Each record in this subset has a value for both the attribute first name and the attribute last name. In addition, for each customer street and house number are stored in the attribute street. Finally, the attrib- ute date of birth is stored in a standard date format. Note that analogously to our running example, one would expect duplicates caused by relocations to have matching values for the attributes first name, last name, and date of birth but largely differing values for the attribute street. These attributes are typical for customer master data and were used to apply and evaluate our approach. More precisely, 4,552 pairs of records – exclusively potential duplicates caused by the real-world event relocation – were analysed.
Before applying the approach, an instantiation is necessary. This instantiation can then be reused for further applications of the approach in the respective domain. In our case, as we had access to a data expert of the insurer and thus also to further confidential data (e.g., the customers’ bank accounts), we aimed to generate quality assured training data for our instantiation (cf. Section 4.3.2). Thus, 20% of the 4,552 pairs of records were drawn randomly. A predominantly manual search for duplicates caused by relocations was performed on the drawn pairs of records with the help of the data expert of the insurer.
This careful search for duplicates with the aid of additional confidential data ensured an accurate iden- tification of duplicates caused by relocations. The drawn pairs of records were labelled accordingly as duplicates vs. non-duplicates and used for the instantiation of our approach. Using only 20% training data gives credit to the fact that generating training data may be costly and time-consuming. Indeed, the application of our approach would not be practical if the true duplicate status for all or most pairs of records needed to be known. For evaluation purposes only, the remaining 80% of the data were labelled as well. In total, 414 pairs of records in the given dataset (i.e., 9.1% of the analysed 4,552 pairs of records) were duplicates caused (exclusively) by the real-world event relocation. In the following, we present the results using 20% training data; however, all evaluations have also been conducted using different percentages of training data between 5% and 50% without substantially differing results.
5.2 Instantiation of our approach for duplicate detection
For illustration purposes, we focused on the real-world event relocation. Thus, the set of considered real- world events consisted of this single event. The respective feature vector had to be fitted to the typical characteristics of duplicates caused by relocations. To capture these characteristics, we let the feature vector comprise four string-based similarities based on the attribute values of each pair of records. Being
Twenty-Sixth European Conference on Information Systems (ECIS2018), Portsmouth,UK, 2018 10 a frequent and established choice for attributes representing names (Cohen et al., 2003), Jaro-Winkler similarity (Winkler, 1990) was selected for the attributes first name, last name and street. The Jaro- Winkler similarity of two strings accounts for the number of matching characters as well as the minimum number of character transpositions required to transform one string into the other, putting more weight on the first characters. To weight all digits equally, Levenshtein similarity (Levenshtein, 1966) was used for the attribute date of birth. The Levenshtein similarity accounts for the minimum number of edits (i.e., deletions, insertions and substitutions) required to transform one string into the other.
In Section 4.3.2 two methods for probability estimations using a labelled training dataset were proposed:
interval method and kernel density estimation. To instantiate the approach using the interval method, we identified disjoint relevant multidimensional intervals so that all other intervals could be excluded from further analysis due to not containing any duplicates. In total, the pairs of records fell into one of 22 relevant intervals. The relative frequency of duplicates in each interval was calculated based on the training data. The interval with the highest relative frequency of duplicates contained 59 pairs of records, of which 57 were duplicates caused by relocations, resulting in a relative frequency of 96.6%. In the following, the instantiation of our approach based on the interval method is referred to as “Intervals”.
For the instantiation of our approach based on the kernel density estimation method, in the following referred to as “KDE”, we used a common implementation presented by Seabold and Perktold (2010) and the same feature vectors and training data as in the interval method. Further, we aimed to include knowledge about the frequencies of first and last names to analyse the benefits of using additional metadata. With this selection we aim to illustrate the potential of considering additional metadata, but it is certainly also promising to consider further additional data such as the customers’ age. Two records sharing a rare value for the attributes first name or last name are, ceteris paribus, more likely to be a duplicate than if the values are common. For instance, ceteris paribus, two records with the (common) name “Mary Smith” are less likely to be a duplicate than two records with the (rare) name “Franklin Jefferson”. To consider this fact, we extended the feature vector with two supplementary components for additional metadata reflecting the rarity of the values for the attribute first name and last name, respectively. More precisely, we determined the number of records from the whole dataset whose values for first name or last name, respectively, corresponded to the respective attribute values of the analysed pairs of records. Then, following inverse document frequency logic (Sparck Jones, 1972), the logarithm of the total number of records divided by the determined number of records was calculated and used as supplementary component of the feature vector. In the following, our instantiation based on kernel den- sity estimation and extended feature vectors will be referred to as “KDE with metadata”.
5.3 Application and results (E1) Practical applicability
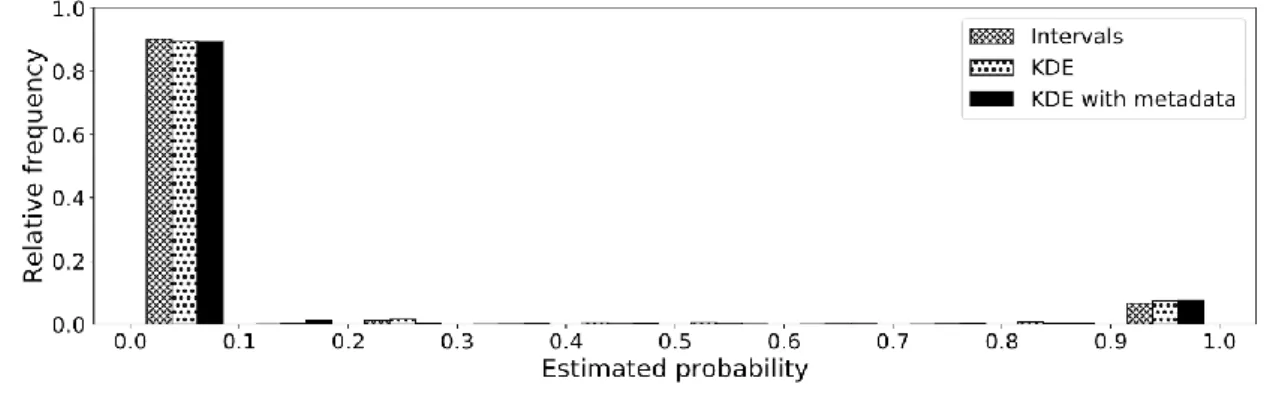
The approach was implemented in Python and applied to the remaining 80% of the dataset. After initial instantiation, our approach could be applied in an automated manner without further manual configura- tion. This low effort underlines its practical applicability (E1). For each pair of records, the three instan- tiations described above yielded estimations for the conditional probabilities of being a duplicate caused by relocation. Figure 1 shows a histogram of the estimated probabilities.
Figure 1. Histogram of the estimated duplicate probabilities
Twenty-Sixth European Conference on Information Systems (ECIS2018), Portsmouth,UK, 2018 11 The relative frequency of pairs of records is given in ten bins of equal size according to the estimated probability. The approach assigned either a very low or a very high duplicate probability to the vast majority of pairs of records, regardless of the chosen instantiation (i.e., Intervals, KDE and KDE with metadata). Such a distribution of estimated duplicate probabilities is favourable, as it builds the basis for a clear and comprehensible classification. Additionally, Figure 1 illustrates that the distributions closely resemble the actual ratios of duplicates caused by relocations (9.1%) and non-duplicates (90.9%) in the dataset. To conclude, the approach could be applied and provided useful results (cf. also (E2) below) using 20% training data. After initial instantiation it could be applied repeatedly, in an automated manner and without determination of additional parameters or distributions. This supports both effi- ciency and practical applicability (E1).
Our approach aims to determine duplicate probabilities for pairs of records which can then be used to classify into duplicates and non-duplicates. Therefore, to evaluate the effectiveness (E2), we first ana- lyse whether the proposed approach is able to provide duplicate probability estimations of high quality (E2.1). Then, the effectiveness of our approach with respect to the classification is assessed (E2.2). The results are analysed for the three instantiations of our approach based on the different probability esti- mation methods: “Intervals”, “KDE” and “KDE with metadata”.
(E2.1) Effectiveness with respect to the estimated duplicate probabilities
The duplicate probabilities determined by our approach can be integrated into decision calculus. For instance, decisions regarding whether to assess a pair of records as a duplicate or whether to perform a data quality improvement measure can be made. To enable well-founded decisions, it must be ensured that the estimated probabilities correspond to the actually observed relative frequencies, which can be assessed in terms of reliability (Hoerl and Fallin, 1974; Murphy and Winkler, 1977; Murphy and Win- kler, 1987; Sanders, 1963). In our context reliability expresses that the mean of the estimated duplicate probabilities in an interval must be approximately equal to the relative frequency of duplicates in that interval. Reliability is commonly evaluated using the reliability curve (Bröcker and Smith, 2007). To calculate the points of this curve, the data is arranged to bins according to the estimated duplicate prob- ability. Then, the mean of the estimated duplicate probability (“mean estimated probability”) as well as the actual relative frequency of duplicates caused by the real-world event relocation (“fraction of posi- tives”) is calculated and plotted for each bin. For a perfectly reliable estimation, all points of the relia- bility curve would lie on the diagonal. Reliability can also be quantitatively assessed in terms of the reliability score, which is defined as the mean squared deviation from the diagonal weighted by the number of test cases in each bin (Murphy, 1973). Therefore, the smaller the value of the reliability score, the smaller the discrepancy between the estimated probabilities and the actually observed relative fre- quencies. The left section of Figure 2 shows the reliability curves for the three instantiations of our approach. To obtain a sufficient number of test cases in each bin, the number of bins was set to four.
The results show that our approach assigns reliable probabilities to the pairs of records regardless of the instantiation as all three curves follow the diagonal rather closely. The duplicate probabilities estimated by our approach exhibited the best fit for the instantiation based on KDE with metadata (reliability score of 0.0025%). This underlines the advantage of our approach of being able to incorporate additional metadata.
Based on the duplicate probabilities estimated by our approach, duplicates can be distinguished from non-duplicates. Thus, to evaluate this aspect, we determined the discrimination of the estimated dupli- cate probabilities. The discrimination was assessed in terms of the area under curve (AUC) under the receiver operating characteristic (ROC) curve (Hanley and McNeil, 1982). The ROC curve is calculated by plotting the true positive rate of a classification based on the estimated duplicate probabilities against the false positive rate, when the classification threshold is varied. The ROC curves are given in the right section of Figure 2. For each instantiation, the ROC curve is very close to the curve of a perfect discrim- ination. With an area under the ROC curve of 97.39%, the probabilities based on KDE with additional metadata show the best discrimination in our application. Overall, these results support that the proba- bilities provided by our approach are able to discriminate between duplicates and non-duplicates. Fur- ther, they motivate the classification of pairs of records into duplicates and non-duplicates based on the approach, which is focused in the following.
Twenty-Sixth European Conference on Information Systems (ECIS2018), Portsmouth,UK, 2018 12 Figure 2. Reliability and receiver operating characteristic curves for the three instantiations
(E2.2) Effectiveness with respect to classification into duplicates and non-duplicates
To evaluate the effectiveness of our approach with respect to the classification of pairs of records into duplicates and non-duplicates, the quality of the results is assessed and compared to the well-known state-of-the-art approach Febrl (Christen, 2008b) based on the Fellegi-Sunter framework (cf. Section 3).
To classify into duplicates and non-duplicates, the pairs of records exhibiting an estimated duplicate probability above 50% were classified as duplicates and vice versa. This was done to represent the clas- sification of each pair of records into its most probable class; however, as Figure 1 shows, other thresh- old values such as 30%, 40%, 60% or 70% could also be chosen and lead to very similar results.
A 5-fold inverse cross-validation was performed to account for variations caused by the random selec- tion of 20% training data. Inverting the cross-validation (i.e., switching test data and training data com- pared to conventional cross-validation) ensures that in each fold only 20% of the dataset are used for training. To assess the quality of the classification into duplicates and non-duplicates, the performance measures accuracy, precision, recall and F-measure (F1) are provided in Table 2. F-measure combines precision and recall and is defined as their harmonic mean. As in the dataset the vast majority of pairs of records are non-duplicates (which is common for datasets in practice), the exact numbers of true positives (TP), false positives (FP), true negatives (TN), and false negatives (FN) are also disclosed in Table 2. Please note that the sum of TP, FP, TN and FN is 18,208 in each row and that there were 1,656 positives (duplicates caused by relocations) and 16,552 negatives due to the inverse cross-validation performed. On the given dataset, our approach provides very promising results. Indeed, regardless of the method chosen for instantiation, the classification is effective. For instance, if KDE with metadata is used, the classification based on our approach is able to identify 88.59% of the duplicates contained in the dataset (recall). Without using metadata our approach is still able to identify 86.90% (KDE) resp.
87.02% (Intervals) of duplicates. Our approach also exhibits maximum precision (i.e., the highest pro- portion of pairs of records classified as duplicates which actually are duplicates) when instantiated with KDE with metadata, with a value of 93.26%. Overall, using this instantiation leads to a very high accu- racy as 98.38% of the pairs of records are correctly classified, and to the maximal value of 0.9086 for the F-measure, stressing the advantages of integrating additional metadata in the estimation.
To compare our results with the results of Febrl, a configuration of the syntactic similarity measures for each attribute used by Febrl was necessary. Thereby, the same similarity measures as in the instantiation of our approach were chosen. The thresholds for classification were automatically set by the optimal threshold model provided by Febrl. The bin width required by Febrl was chosen carefully and optimized to obtain best results for this method. Febrl classified almost all pairs of records as non-duplicates. Most
Twenty-Sixth European Conference on Information Systems (ECIS2018), Portsmouth,UK, 2018 13 pairs indeed are non-duplicates. This unbalance of the dataset means that Febrl was able to achieve a rather high accuracy of 93.67% (cf. Table 2) despite its difficulty to identify actual duplicates. As Febrl was very restrictive with judging pairs of records to be a duplicate, the few pairs of records identified as duplicates by Febrl were almost all correctly classified, resulting in a high precision of 94.37%. How- ever, Febrl mainly just identified the rather obvious duplicates, leading to this high precision but a crit- ically low recall. More precisely, Febrl was not able to detect the majority of duplicates, identifying only 32.37% of them as indicated by the recall. Reasons for this fact have already been discussed in Section 3:
Indeed, real-world events such as relocations can lead to a large number of false negatives in approaches based on the Fellegi-Sunter framework. The low number of identified duplicates also resulted in an unsatisfactory F-measure of 0.4820 and a ROC AUC value of only 79.58% compared to values of over 95% for our approach (cf. Figure 2). Overall, based on the given dataset our approach seems much better suited to identify duplicates caused by relocations than Febrl, regardless of the instantiation method. In particular, it was able to handle the unbalance in the dataset well and identified almost all duplicates.
Table 2. Performance measures for classification into duplicates and non-duplicates
To conclude, our approach showed promising results regarding (E2.2) the performance of the classifier based on the estimated duplicate probabilities. As good results with respect to (E2.1) and (E2.2) could be achieved using only 20% training data, the practical applicability (E1) of the approach is supported.
6 Conclusion, Limitations and Future Work
Duplicate detection is an important issue in both research and practice. In this paper, we present an event-driven probability-based approach for this task. It aims at determining the probability for a pair of records to be a duplicate caused by a real-world event (e.g., relocating customers). Existing approaches are hardly able to identify such duplicates, which we address by explicitly modelling real-world events in a probability space. A formal definition of the approach and multiple possibilities for its instantiation are provided. Moreover, the practical applicability and the effectiveness of the approach are evaluated based on real-world customer master data from a German insurer. The approach neither relies on limit- ing assumptions (e.g., independence or monotonicity) nor suffers from restrictions in its applicability like existing probability-based approaches. Additionally, in contrast to existing approaches, our ap- proach is able to determine probabilities regarding different possibly underlying causes for a duplicate.
Both probability and cause may be especially helpful for decision-making. More precisely, due to the interpretation of the results of our approach as probabilities, the integration into a decision calculus (e.g., expected value calculus) can be done easily and in a well-founded manner. The evaluation shows that the provided probabilities for being a duplicate are reliable and useful for decision support. Furthermore, when using the probabilities for a classification into duplicates and non-duplicates, the presented ap- proach showed promising results and outperformed the well-known state-of-the-art approach Febrl.
Nevertheless, our work also has limitations which may constitute the starting point for future research.
In this paper we focused on detecting duplicates caused by real-world events. Future research could explore whether failures during data capturing (e.g., mistakes caused by mishearing) can also be suc- cessfully modelled as such “events”. Furthermore, the approach was applied to a real-world customer dataset of an insurer. Future research could evaluate it on further datasets containing master data. More- over, the approach should be applied to datasets from other contexts, focusing on different real-world events. Further evaluations (e.g., on synthetical datasets) could also provide interesting insights regard- ing different possibilities to instantiate the approach and which additional data to use for effectiveness.
Accuracy Precision Recall F1 TP FP TN FN Intervals 98.17% 92.43% 87.02% 0.8964 1,441 118 16,434 215
KDE 98.21% 92.96% 86.90% 0.8983 1,439 109 16,443 217
KDE with metadata 98.38% 93.26% 88.59% 0.9086 1,467 106 16,446 189 Febrl (Optimal Threshold) 93.67% 94.37% 32.37% 0.4820 536 32 16,520 1,120
Twenty-Sixth European Conference on Information Systems (ECIS2018), Portsmouth,UK, 2018 14
References
Belin, T. R. and D. B. Rubin (1995). “A method for calibrating false-match rates in record linkage”
Journal of the American Statistical Association 90 (430), 694–707.
Bilenko, M. and R. J. Mooney (2002). “Learning to combine trained distance metrics for duplicate de- tection in databases”. In: Proceedings of the 11th international conference on Information and knowledge management, pp. 1–19.
Bleiholder, J. and J. Schmid (2015). “Data Integration and Deduplication”. In Daten-und Informati- onsqualität, 121–140. Heidelberg: Springer Vieweg (in German).
Bröcker, J. and L. A. Smith (2007). “Increasing the reliability of reliability diagrams” Weather and forecasting 22 (3), 651–661.
Christen, P. (2008a). “Automatic record linkage using seeded nearest neighbour and support vector machine classification”. In: Proceedings of the 14th ACM SIGKDD international conference on Knowledge discovery and data mining, pp. 151–159.
Christen, P. (2008b). “Febrl. A freely available record linkage system with a graphical user interface”.
In: Proceedings of the second Australasian workshop on Health data and knowledge management, pp. 17–25.
Christen, P. (2012). Data matching. Concepts and techniques for record linkage, entity resolution, and duplicate detection. Berlin Heidelberg: Springer-Verlag.
Cohen, W. W. and J. Richman (2002). “Learning to match and cluster large high-dimensional data sets for data integration”. In: Proceedings of the eighth ACM SIGKDD international conference on Knowledge discovery and data mining, pp. 475–480.
Draisbach, U. (2012). Partitioning for efficient duplicate detection in relational data. Heidelberg:
Springer Vieweg (in German).
Draisbach, U. and F. Naumann (2011). “A generalization of blocking and windowing algorithms for duplicate detection”. In: International Conference on Data and Knowledge Engineering (ICDKE), pp. 18–24.
DuVall, S. L., R. A. Kerber and A. Thomas (2010). “Extending the Fellegi‐Sunter probabilistic record linkage method for approximate field comparators” Journal of biomedical informatics 43 (1), 24–
30.
Elgammal, A., R. Duraiswami, D. Harwood and L. S. Davis (2002). “Background and foreground modeling using nonparametric kernel density estimation for visual surveillance”. In: Proceedings of the IEEE, pp. 1151–1163.
Elmagarmid, A. K., P. G. Ipeirotis and V. S. Verykios (2007). “Duplicate record detection. A survey”.
In IEEE Transactions on knowledge and data engineering, pp. 1–16.
Experian Information Solutions (2016). Building a business case for data quality. URL:
https://www.edq.com/globalassets/white-papers/building-a-business-case-for-data-quality-re- port.pdf (visited on 07/19/2017).
Fan, W. (2015). “Data Quality. From Theory to Practice” ACM SIGMOD Record 44 (3), 7–18.
Fellegi, I. P. and A. B. Sunter (1969). “A theory for record linkage” Journal of the American Statisti- cal Association 64 (328), 1183–1210.
Franz, T. and C. von Mutius (2008). Customer Data Quality – Key to a Successful Customer Dia- logue. Zürich, Switzerland: Swiss CRM Forum 2008 (in German).
Hanley, J. A. and B. J. McNeil (1982). “The meaning and use of the area under a receiver operating characteristic (ROC) curve” Radiology 143 (1), 29–36.
Heinrich, B., D. Hristova, M. Klier, A. Schiller and M. Szubartowicz (2018a). “Requirements for Data Quality Metrics” Journal of Data and Information Quality (JDIQ) 9 (2), 12.
Heinrich, B., M. Klier, A. Schiller and G. Wagner (2018b). “Assessing data quality ‐ A probability- based metric for semantic consistency” Decision Support Systems (to appear).
Helmis, S. and R. Hollmann (2009). Web-based data integration. Approaches to measure and main- tain the quality of information in heterogeneous databases using a fully web-based tool. Duplicates in Databases. Heidelberg: Springer Vieweg (in German).
Twenty-Sixth European Conference on Information Systems (ECIS2018), Portsmouth,UK, 2018 15 Hettiarachchi, G. P., N. N. Hettiarachchi, D. S. Hettiarachchi and A. Ebisuya (2014). “Next generation
data classification and linkage. Role of probabilistic models and artificial intelligence”. In: Global Humanitarian Technology Conference (GHTC), pp. 569–576.
Hoerl, A. E. and H. K. Fallin (1974). “Reliability of subjective evaluations in a high incentive situa- tion” Journal of the Royal Statistical Society. Series A (General), 227–230.
Hua, M. and J. Pei (2012). “Aggregate queries on probabilistic record linkages”. In: Proceedings of the 15th International Conference on Extending Database Technology, pp. 360–371.
Kraus, C. (2004). Address and customer databases for direct marketing: design, maintenance, usage.
Göttingen: Businessvillage (in German).
Larsen, M. D. and D. B. Rubin (2001). “Iterative automated record linkage using mixture models”
Journal of the American Statistical Association 96 (453), 32–41.
Lehti, P. and P. Fankhauser (2006). “Unsupervised duplicate detection using sample non-duplicates”
Journal on Data Semantics VII, 136–164.
Levenshtein, V. I. (1966). “Binary codes capable of correcting deletions, insertions, and reversals” So- viet physics doklady 10, 707–710.
Moges, H.-T., V. van Vlasselaer, W. Lemahieu and B. Baesens (2016). “Determining the use of data quality metadata (DQM) for decision making purposes and its impact on decision outcomes - An exploratory study” Decision Support Systems 83, 32–46.
Moore, S. (2017). How to Create a Business Case for Data Quality Improvement. URL:
http://www.gartner.com/smarterwithgartner/how-to-create-a-business-case-for-data-quality-im- provement/ (visited on 07/19/2017).
Murphy, A. H. (1973). “A new vector partition of the probability score” Journal of Applied Meteorol- ogy 12 (4), 595–600.
Murphy, A. H. and R. L. Winkler (1977). “Reliability of subjective probability forecasts of precipita- tion and temperature” Applied Statistics, 41–47.
Murphy, A. H. and R. L. Winkler (1987). “A general framework for forecast verification” Monthly Weather Review 115 (7), 1330–1338.
Newcombe, H. B., J. M. Kennedy, S. J. Axford and A. P. James (1959). “Automatic linkage of vital records” Science (New York, N.Y.) 130 (3381), 954–959.
Ngai, E. W. T., A. Gunasekaran, S. F. Wamba, S. Akter and R. Dubey (2017). “Big data analytics in electronic markets” Electronic Markets 27 (3), 243–245.
Ravikumar, P. and W. W. Cohen (2004). “A hierarchical graphical model for record linkage”. In: Pro- ceedings of the 20th Conference on Uncertainty in Artificial Intelligence, pp. 454–461.
Sanders, F. (1963). “On subjective probability forecasting” Journal of Applied Meteorology 2 (2), 191–201.
Schönfeld, A. (2007). Address Turntable – Rule-Based Data Exchange with Open Source. Nürnberg:
Open Source Meets Business 2007 (in German).
Schürle, J. (2005). “A method for consideration of conditional dependencies in the Fellegi and Sunter model of record linkage” Statistical Papers 46 (3), 433–449.
Scott, D. W. (2015). Multivariate density estimation. Theory, practice, and visualization. Hoboken:
John Wiley & Sons.
Seabold, S. and J. Perktold (2010). “Statsmodels. Econometric and statistical modeling with python”.
In: Proceedings of the 9th Python in Science Conference, pp. 57–61.
Sparck Jones, K. (1972). “A statistical interpretation of term specificity and its application in retrieval”
Journal of documentation 28 (1), 11–21.
Steorts, R. C. (2015). “Entity resolution with empirically motivated priors” Bayesian Analysis 10 (4), 849–875.
Steorts, R. C., R. Hall and S. E. Fienberg (2016). “A Bayesian approach to graphical record linkage and deduplication” Journal of the American Statistical Association 111 (516), 1660–1672.
Thibaudeau, Y. (1992). “The discrimination power of dependency structures in record linkage” U.S.
Bureau of the Census.