Why go to France or Germany, if you could as well go to the UK or the US? Selective Features
of Immigration to four major OECD Countries
W IDO G EIS
S ILKE U EBELMESSER
M ARTIN W ERDING
CES IFO W ORKING P APER N O . 2427
CATEGORY 4:LABOUR MARKETS
OCTOBER 2008
An electronic version of the paper may be downloaded
• from the SSRN website: www.SSRN.com
• from the RePEc website: www.RePEc.org
• from the CESifo website: Twww.CESifo-group.org/wpT
Why go to France or Germany, if you could as well go to the UK or the US? Selective Features of
Immigration to four major OECD Countries
Abstract
Building on a new data set which is combined from national micro-data bases, we highlight differences in the structure of migrants to four countries, viz. France, Germany, the UK and the US, which receive a substantial share of all immigrants to the OECD world. Looking at immigrants by source countries, we illustrate the important role of distance, both geographical and cultural, immigration policies and migrant networks. Differentiating immigrants by their educational attainments, we observe interesting patterns in the skill composition, employment opportunities and wages for migrants to the different destination countries. Focusing on migration between the four countries in our data set, we find that migration within Western Europe is small and rather balanced in terms of skill structures, while there appears to be a brain drain from Europe to the US.
JEL Code: J21, J31, J61, O15.
Keywords: migration, immigration policy, education, employment, wages, brain drain.
Wido Geis
Ifo Institute for Economic Research at the University of Munich
Poschingerstrasse 5 81679 Munich
Germany geis@ifo.de
Silke Uebelmesser
Center for Economic Studies and CESifo at the University of Munich
Schackstrasse 4 80539 Munich
Germany uebelmesser@lmu.de
Martin Werding
Ifo Institute for Economic Research at the University of Munich
Poschingerstrasse 5 81679 Munich
Germany werding@ifo.de September 2008
Why go to France or Germany, if you could as well go to the UK or the US?
Selective Features of Immigration to Four Major OECD Countries
1 Introduction
France, Germany, the UK and the US are among the countries that attract most immigrants from all over the world.1 However, the four countries differ strongly in their legal framework for immigration. France and Germany have very restrictive immigration policies which, to the extent that they are applicable,2 thus far almost exclusively allow immigration for humanitarian reason, including family reunification. Immigration policies in the Anglo-Saxon countries are more liberal in general, but rather selective regarding the skills of potential migrants.3 Moreover, France and Germany are characterized by smaller wage dispersion, higher unemployment, and a more generous welfare state. Taking these aspects together, the Anglo-Saxon countries should attract highly qualified migrants with a strong economic potential, whereas France and Germany should be the preferred destination of migrants with lower skills and a weaker economic potential – provided they are granted access there. In other words, the Anglo-Saxon countries could be on the receiving side of a “brain drain”
(Johnson 1967; Bhagwati and Hamada 1974), while France and Germany could act as
“welfare magnets” (Borjas 1994; 1999).
Besides the immigration policy and the economic situation in potential destination countries, there are other factors that may influence where different types of immigrants go.
The migration literature states that, first of all, the distance between source and destination countries influences the choice of immigrants. Here, distance does not only relate to geo- graphical proximity but also to cultural links, such as language, customs, or religious beliefs (Docquier 2007; Mayda 2007; Pedersen et al. 2004). Another important factor which may in fact help to bridge both geographical and cultural distances is the existence of migrant networks (Munshi 2003). Many people appear to prefer destination countries where members of their family, their home town, or their ethnic group migrated before. To some extent, these
1 Together with Canada and Australia, they receive 77% of all the immigrants to OECD countries (Defoort 2006).
2 In France, Germany and the UK, citizens of EU countries who are seeking employment or taking up a job as well as those who work as self-employed are subject to free mobility of labour, a basic legal entitlement which also applies to their families (Treaty establishing the European Community, 2002, Articles 39-55). This rule has been partially suspended during a transition period vis-à-vis the accession countries in Central and Eastern Europe that joined the EU in 2004. Until 2005, only the UK has opened the labour market for citizens of these countries, while France and Germany did not.
3 See OECD (2007a) for a discussion of immigration programs that are targeted at attracting high skilled migrants.
networks allow migrants to adhere to the culture of their home countries. They also facilitate migration as they transmit information about the destination countries and may even give people preferential access in spite of legal restrictions, particularly via family reunification.
The aim of this paper is to explore, in a purely descriptive fashion, patterns that may explain how migrants select into any of the four destination countries we are looking at,4 focusing on the following questions: Is migration to a specific country mainly driven by factors such as historical links, geographical and/or cultural proximity and migrant networks, or are there other (e.g., institutional) determinants as well? Does the structure of immigrants differ across our four destination countries, and does it differ from the structure of the native populations? Are there any indications of group-specific incentives to migrate to one country or another and, in particular, do skill-specific incentives appear to play a role?
Using large representative micro-data sets, we analyze whether the distribution of migrants over France, Germany, the UK and the US conforms to the factors that are thought to have an influence on the choice of destination countries. These data sets are the French Enquête Emploi, the German Mikrozensus, the American Community Survey, all for the year 2005, and the British Labour Force Survey for the first quarter of 2005.5 Together with the native populations, the data cover the current stocks of immigrants living in the four countries and provide very detailed information regarding their socio-economic characteristics.6
The paper is organized as follows. In Section 2, we discuss how immigrants can be identified in our data and give a broad overview of the immigrant population in our four destination countries. In Section 3, we highlight the role of distance, immigration policies and network effects in explaining the distribution of migrants by their countries of origin across the destination countries. In Section 4, we take a closer look at the composition of migrants;
in particular, we study whether specific groups of migrants appear to choose specific countries, for instance, whether the UK and the US really attract people with a higher economic potential than Germany and France. Section 5 concentrates on the sub-group of migrants who move between our four countries. This may shed light on recent discussions of whether there is nowadays a “brain drain” between developed countries. Section 6 concludes.
4 Similar studies have been conducted by Saint-Paul (2004) for Europeans in the US and by Diehl and Dixon (2005) for Germans in the US.
5 The Enquête Emploi is a 0.5% random survey of the French population, the Mikrozensus a 1% random survey of the German population (Scientific use file: 0.7%), the American Community Survey (Ruggles et al. 2007) a 1% random survey of the US population, and the Labour Force Survey (Office for National Statistics, 2005) a 0.2% random survey of the British population. The surveys from European countries we are using are all channelled into the European Labour Force Survey collected by Eurostat. However, the much larger EU-level data set is not available for in-depth research distinguishing immigrants by their home countries.
6 Note that flow data on current immigrants (and emigrants) are largely lacking any information other than age, gender and nationality of the individuals covered. Besides, they are rarely consistent at an international level even in terms of the size of in-flows and out-flows.
2 Immigrant populations in France, Germany, the UK and the US
For an analysis of the immigrant population, a precise definition of migrants is needed. In this regard, there are two common approaches. One is to classify all people holding the nationality of the destination country as natives, and those with a foreign nationality as immigrants. The other is to consider all people who were born in the destination country as natives, and those who are foreign-born as immigrants. By the first definition, after naturalization an immigrant can no longer be distinguished from a native person. Who is a migrant and who is not thus depends on national naturalization laws which differ strongly across countries. For instance, it is much easier to acquire the American nationality than the German one. Therefore, when comparing data for immigrants based on nationality, we cannot really distinguish between the effects of migration and naturalization policies. Moreover, by this definition ethnic Germans whose ancestors had settled in Eastern Europe centuries ago – the so called (Spät-)Aussiedler – are automatically classified as natives when they have moved to Germany, since they are entitled to receive the German nationality immediately upon their arrival.
However, relying on the country of birth is also far from optimal. This definition does not reflect at all different stages of integration into the society of the destination country. Migrants can never become natives under this classification, even if they have come to the country in their early childhood, have lived there for decades and are perfectly integrated. At the same time, people whose mother was more or less coincidentally in the destination country when they were born are automatically classified as natives, even though they may not be integrated at all. Another, related problem is that children of natives who were born abroad are immigrants by this definition. This is mainly relevant for children of members of the armed forces who were stationed abroad at the time of birth. As a rule, these children have lived abroad only for a few years and should reasonably be considered as natives in their parents’
home country. Migration from Germany to the UK is a prominent example for how important this group can be: among the 265,000 German-born people living in the UK, only 96,000 do not claim to be ethnic British. Fortunately, our data set allows us to identify these individuals.
A related question is how to deal with people who actually did not decide themselves whether to migrate or not, as they were small children at the time when this decision was taken. To circumvent this problem, we focus on individuals who were aged 16 years and older when moving to their current country of residence.
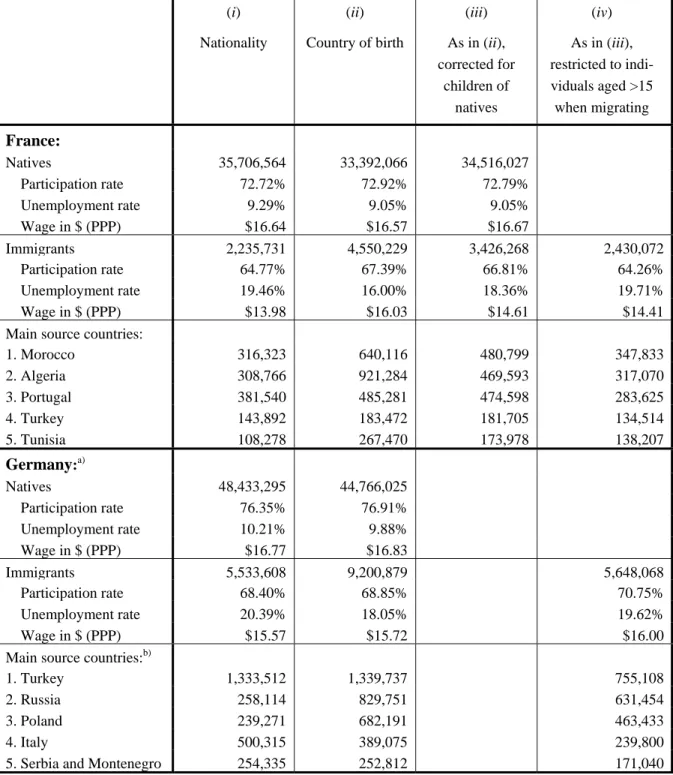
To illustrate the impact of the different definitions we have discussed here, table 1 gives an overview of the numbers of “migrants” aged 18-65 who are living in our four countries based on (i) nationality, (ii) country of birth, (iii) country of birth corrected for children of
natives, and (iv) additionally restricted to those who were at least 16 when migrating. In addition, table 1 displays fundamental labor-market characteristics of natives and immigrants such as the respective participation rates, unemployment rates and hourly wages.
Table 1 illustrates that the definition of migrants is important. It does not only have an impact on the total number of immigrants but also on their composition. A good example is given by the Algerian and the Portuguese populations living in France, two of the most important immigrant groups in this country. Defining immigrants by nationality (version i), the number of people from Portugal is about 382,000 and thus much higher than the number of people from Algeria, with about 308,000. However, defining immigrants by their country of birth (version ii), the number of people from Algeria becomes about 921,000 – almost twice as high as the number of people from Portugal, with about 485,000. Moreover, in the case of France the definition also affects the labor-market characteristics. If immigrants are defined by country of birth and not by nationality, the participation rate of immigrants is more than 2 percentage points higher, the unemployment rate more than 3 percentage points lower, and the wage $2 higher. We have already discussed that correcting country-of-birth data for children of natives is also important; in the case of France the unemployment rate of immigrants is more than 2 percentage points higher after this correction than before.
Concentrating, in addition, on individuals who migrated when they were aged 16 and above does not make a major difference for the structure of immigrants by source countries;
however, it has a further effect on labor force participation, unemployment rates and wages.
Comparing unemployment rates of immigrants in the four countries leads to surprising insights. In France, Germany and the UK, unemployment rates of immigrants, regardless of their definition, are about twice as high as unemployment rates of natives. However, in the US the unemployment rates of the two groups are about the same. The participation rates also show an interesting pattern. In Germany, the UK and the US the participation rates of natives are all about 77%, while those of immigrants differ between 74% in the US and only 69% in Germany and the UK. In France the participation rates of both natives and immigrants are lower. As to the average wage of immigrants, it is lower than that of natives in France, Germany and the US, the difference being largest in the US. In the UK, however, the average wage of immigrants is higher than that of natives.7
7 In order to check whether cohort effects or a different age structure of the immigrant populations are responsi- ble for these observations, we have additionally looked at the participation and unemployment rates for the age group 25-35. As the respective rates are very similar for this more homogenous group to those of the age group 18-65, we conclude that cohort effects and the composition of migrants cannot explain their different labor- market performance.
Table 1: Immigrants by varying definitions (18-65)
(i) Nationality
(ii) Country of birth
(iii) As in (ii), corrected for
children of natives
(iv) As in (iii), restricted to indi- viduals aged >15
when migrating France:
Natives 35,706,564 33,392,066 34,516,027
Participation rate 72.72% 72.92% 72.79%
Unemployment rate 9.29% 9.05% 9.05%
Wage in $ (PPP) $16.64 $16.57 $16.67
Immigrants 2,235,731 4,550,229 3,426,268 2,430,072
Participation rate 64.77% 67.39% 66.81% 64.26%
Unemployment rate 19.46% 16.00% 18.36% 19.71%
Wage in $ (PPP) $13.98 $16.03 $14.61 $14.41
Main source countries:
1. Morocco 316,323 640,116 480,799 347,833
2. Algeria 308,766 921,284 469,593 317,070
3. Portugal 381,540 485,281 474,598 283,625
4. Turkey 143,892 183,472 181,705 134,514
5. Tunisia 108,278 267,470 173,978 138,207
Germany:a)
Natives 48,433,295 44,766,025
Participation rate 76.35% 76.91%
Unemployment rate 10.21% 9.88%
Wage in $ (PPP) $16.77 $16.83
Immigrants 5,533,608 9,200,879 5,648,068
Participation rate 68.40% 68.85% 70.75%
Unemployment rate 20.39% 18.05% 19.62%
Wage in $ (PPP) $15.57 $15.72 $16.00
Main source countries:b)
1. Turkey 1,333,512 1,339,737 755,108
2. Russia 258,114 829,751 631,454
3. Poland 239,271 682,191 463,433
4. Italy 500,315 389,075 239,800
5. Serbia and Montenegro 254,335 252,812 171,040
a) Correction for children of natives does not make sense because of the (Spät-)Aussiedler.
b) Country-of-birth information is not available for all observations.
Note: While participation and unemployment rates are directly observable, hourly wages are determined as described in the appendix.)
Source: National micro-data sets; authors’ calculations.
Table 1 (cont’d.): Immigrants by varying definitions (18-65)
(i) Nationality
(ii) Country of birth
(iii) As in (ii), corrected for
children of natives
(iv) As in (iii), restricted to indi- viduals aged >15
when migrating UK:
Natives 34,608,154 32,803,978 33,528,731
Participation rate 77.05% 77.43% 77.46%
Unemployment rate 4.00% 3.92% 3.93%
Wage in $ (PPP) $20.38 $20.30 $20.37
Immigrants 2,371,600 4,163,636 3,440,004 2,753,244
Participation rate 69.26% 69.73% 67.86% 67.82%
Unemployment rate 8.40% 7.17% 7.88% 7.55%
Wage in $ (PPP) $21.16 $21.55 $21.00 $20.63
Main source countries:
1. India 153,081 386,663 362,519 276,253
2. Pakistan 75,851 234,742 233,055 159,898
3. Ireland 248,925 282,213 201,530 148,174
4. South Africa 83,180 163,896 106,399 92,243
5. Poland 92,636 103,656 94,867 93,535
USA:
Natives 165,305,607 152,192,720 153,664,002
Participation rate 77.06% 77.08% 77.12%
Unemployment rate 6.51% 6.61% 6.60%
Wage in $ (PPP) $23.47 $23.27 $23.28
Immigrants 17,357,046 29,815,975 28,420,240 22,065,088
Participation rate 73.12% 74.67% 74.35% 73.78%
Unemployment rate 7.37% 6.56% 6.59% 6.31%
Wage in $ (PPP) $17.27 $20.85 $20.64 $20.46
Main source countries:
1. Mexico 7,240,984 9,446,343 9,330,045 7,112,336
2. India 709,847 1,238,560 1,228,302 1,108,573
3. Philippines 474,521 1,353,701 1,281,424 1,009,079
4. China 458,059 902,680 896,267 796,682
5. El Salvador 646,398 899,033 894,225 707,120
Note: While participation and unemployment rates are directly observable, hourly wages are determined as described in the appendix.)
Source: National micro-data sets; authors’ calculations.
3 Distance, network effects, and immigration policies
How do migrants choose their destination countries? If migrants were a homogeneous group choosing their destination country only according to the economic conditions in the destination country, all migrants should either choose the same destination country, or they should evenly disperse across a number of (identical) destination countries. However, none of this is what we observe (cf. table 1): The five most important countries of origin strongly differ for our four destination countries. Most notably, the numbers of immigrants from India and China, by far the two largest countries in the world in terms of population size and important source countries of migrants, are negligible in France and Germany, while Indians rank first among immigrants to the UK, and Indians as well as Chinese are important groups of immigrants to the US. There, however, they are outnumbered by Mexican immigrants by factors of 7 to 9. This points to two qualifications of the simple conjecture above: First, economic conditions in the destination countries, whether identical or not, are not the only determinants of migration. Second, migrants do not constitute a homogeneous group. In this chapter, we therefore discuss non-economic factors that help to explain why migrants from certain source regions choose certain destination countries. In the next chapter, we will analyze in particular whether migrants with different levels of education differ in their choice of destination countries.
3.1 Geographical and cultural distance
One factor which is taken into account in most econometric studies on migration is the geographical distance between source and destination countries (see, e.g., Docquier 2007 and Pedersen et al. 2004). The idea behind this is simply that migration costs increase with distance.8 This was certainly true in the past, but with the emergence of new transportation and communication networks in the last decades the importance of sheer geographical distance may have declined. Our data give no clear picture regarding the importance of distance. For France, Germany and the US, it seems to play an important role. Concentrating, from here onward, on immigrants in terms of foreign-born people corrected for children of natives (version iii in table 1), about 49% of all immigrants to the US come from Canada, Central and Caribbean America, with 32% alone from Mexico; 79% of the immigrants to Germany (for whom country-of-birth information is available) come from Europe, including Russia and Turkey; over 74% of the immigrants to France come from Europe and Northern
8 See Sjaastad (1962) and Carrington et al. (1996) for discussions of migration costs.
Africa. In the UK, however, the picture is entirely different. Only 27% of the immigrants there come from European countries.
Geographical distance can be more or less coincidentally correlated with other factors that also have an influence on migration decisions, so that one cannot tell their effects apart. For instance, 33% of the French immigrants are from the Maghreb, that is, from countries which are not only close to France but also were former colonies. With 60% of the immigrants from former colonies, this factor is also important for immigration to the UK; there, however, it is not correlated with geographical distance. In Germany, 76% of the immigrants come from countries where either (Spät-)Aussiedler or guest workers (who were actively recruited between the 1950s and the early 1970s) are from, that is, from Eastern Europe in the former case and from Southern Europe in the latter.9 For immigrants to the US, such additional linkages appear to be less important, but at least the large number of immigrants from the Philippines is most certainly due to the fact that the Philippines are a former colony.
Related to this aspect, the migration literature has developed the concept of cultural distance (see, e.g., Docquier et al. 2007). The idea behind this is that integration into a new cultural environment is difficult and associated with substantial, though to an important degree intangible, costs for migrants. These costs should be higher the more the new environment differs from the one they are used to.
An important concept used to make the idea of cultural distance operational in the context of research on migration is the “linguistic distance”, measured for example by the average time people need to learn the foreign language (see, e.g., Chiswick and Miller 2005). An obvious approach to testing the importance of this kind of distance would be to look at migration flows between countries with the same language. However, virtually all countries with the same language also have historical links, in many cases from colonialism, so that the effect of language cannot be isolated. Furthermore, there is thus far no reliable concept by which the linguistic distance between all pairs of countries could be ranked. Approaching other dimensions of cultural distance, such as proximity of religious beliefs, life-styles, etc.
also leads to measurement problems. Again, countries that are separated by only a small distance often have historical ties and a similar cultural environment. In fact, all concepts discussed here are potentially important but closely intertwined.
Nevertheless, there are two examples in our data where small cultural distance is the most convincing explanation for migration flows. One is the high number of immigrants from India, Pakistan and South Africa, all former colonies, living in the UK. The other is the
9 Persons for whom no country-of-birth information is available are counted as ethnic Germans.
distribution of immigrants from Portugal over France and Germany. In the second half of the 20th century, there were large migration flows from Portugal to France; parallel flows to Germany were much smaller, even though the Germans were recruiting Portuguese guest workers at that time. The geographical distance between Portugal and France is smaller than that to Germany, but neither Germany nor France share a common border with Portugal. It can thus be assumed that the difference in traveling costs should not be very large. However, the Portuguese language is particularly close to French, and social interactions are rather similar in these two countries.
3.2 Immigration policy
Another factor that ought to play an important role for the migrants’ choice of a destination country is immigration policy. It determines whether and under what conditions a migrant has legal access to a particular country. Immigration policy can also have an effect on the expectations that migrants have regarding their life in possible destination countries. A common example for the effect of regulations on migration flows is the recent migration from Poland to the UK (see Blanchflower and Shadforth 2006; and Drinkwater et al. 2006, for discussions). At the time of EU Eastern enlargement in 2004, the UK and Ireland were the only countries of the old EU-15 that gave citizens of the new member states free access to their labor markets, whereas Germany and France implemented restrictive transitional policies. As one would expect, our data indicate that many Polish migrated to the UK shortly before and after EU enlargement (see figure 1). However, the data do not show a significant decrease in migration from Poland to Germany and France in 2003 and 2004. Thus, it seems that the change in British immigration laws has increased total emigration from Poland and not just induced a predetermined number of emigrants to go elsewhere.
Apart from single instants of policy change that may constitute (quasi-)experimental settings, measuring and comparing the strictness of immigration laws across countries is a complicated task. To really assess the impact of immigration policy, one would also have to consider illegal immigrants, i.e., people who are not observed in official statistics.10 Note also that immigration laws are usually not targeted at people from specific source countries11 but at individuals with specific characteristics, as is the case with family reunification, the US
“Green Card” or, more recently, point systems based on age, education and job experience as
10 However, in all countries the economic situation of illegal immigrants is by far worse than that of legal ones.
Hence, as long as economic conditions in possible destination countries are not too different from each other, immigrants should always prefer countries where they can legally migrate.
11 An obvious exception is the differentiation between EU citizens and citizens from “third countries” in immigration policies of all EU member states.
that introduced in the UK. It is thus rather difficult to get a comprehensive picture of immigration laws of a given country and its effects on migrant flows.
Fig. 1: Immigrants from Poland by year of immigration
0 10,000 20,000 30,000 40,000 50,000 60,000
1999 2000 2001 2002 2003 2004
France Germany UK USA
Source: National micro-data sets; authors’ calculations.
3.3 Migrant networks
Migrant networks are probably one of the most important determinants of migration. The networks consist of members of the same family, the same home town, or the same ethnic group (Massey et al. 1993; Munshi 2003). They facilitate migration in various ways. First, they offer people who consider migrating detailed information about the destination country.
This reduces uncertainty and helps potential migrants to save costs. Second, getting legal access to a destination country can be easier for those with family ties to others who migrated there in the past. Most countries have special rules for family reunification that can give access to people who would face immigration restrictions elsewhere. Third, networks may offer active support in dealing with practical matters of life in the destination country at an early stage of migration, such as finding a place to stay or finding a job. Fourth, large-scale networks allow migrants to use their native language and keep their customs in the destination country, effectively reducing cultural distance in its many dimensions.
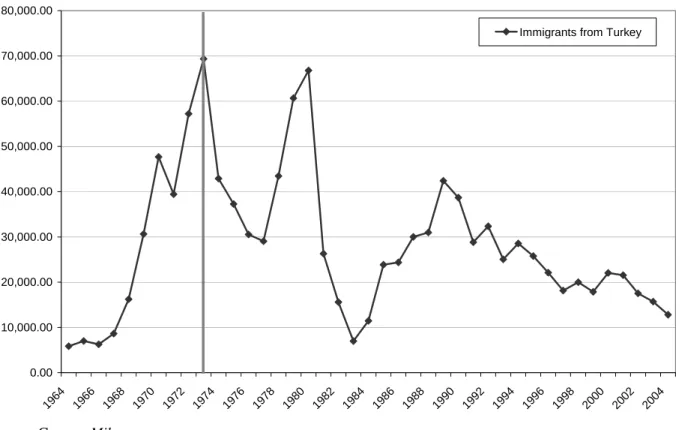
Fig. 2: Immigrants aged 18-65 from Turkey to Germany by year of arrival
0.00 10,000.00 20,000.00 30,000.00 40,000.00 50,000.00 60,000.00 70,000.00 80,000.00
1964 1966
196 8
1970 1972 1974 1976
197 8
1980 1982 1984
198 6
1988 1990 1992 1994
199 6
199 8
2000 2002 2004 Immigrants from Turkey
Source: German Mikrozensus.
An interesting example for the importance of networks is given by the migration flows from Turkey to Germany. Between 1961 and 1973, Germany actively recruited guest workers in Turkey. Although this program was actually meant to be temporary, many of the guest workers became permanent immigrants. Since 1973, Germany has a very restrictive immigration policy vis-à-vis Turkish people, allowing only family reunification and migration for humanitarian reasons.12 Thus, legal conditions for potential migrants from Turkey to Germany changed substantially, and one would expect that immigration had dramatically decreased. But in fact, a large share of Turkish immigrants to Germany migrated after 1973 (see figure 2), and network effects are the most convincing explanation for this.
Migrant networks require a critical mass of immigrants from a particular source country, or source region. Therefore, in order to fully explain this determinant of migration one also has to consider conditions under which the first migrants came to the destination country.
Short distances, cultural proximity and favorable immigration policies of the destination country can lead to a first wave of migration flows. Later on, these first migrants may form migrant networks which, in turn, can attract additional migrants from the same source countries as they (further) reduce the cultural distance and may even create options to use
12 After the military coup in Turkey in 1980 and during the military conflict in Kurdistan in the second half of the 1980s, a large number of Turkish asylum seekers came to Germany.
preferential immigration rules. This can be the case even if the initial conditions have changed completely since then. As a consequence, network effects can become stronger and stronger over time. Once they have been initiated, migration flows in a particular direction may be thus self-enforcing.
A large part of migration into our four countries can indeed be attributed to networks that originate in historical and cultural links, and in specific policy measures. With the exception of Poland (rank 5), the ten most important source countries of immigrants to the UK are former colonies. Immigrants to France from the Maghreb countries as well as immigrants to Germany from guest-worker countries (Turkey, former Yugoslavia, or Italy) or countries with many (Spät-)Aussiedler (Russia, Poland, Romania) are nowadays forming strong networks.
For the US, similar effects may apply to immigrants from the Philippines, as already mentioned. Also, the very large immigration flows from Mexico and El Salvador are most likely not only caused by the short distance to the US, but also by the emergence of strong migrant networks.
The role of migrant networks is, at least partly, an economic one, as it is related to a reduction of costs and uncertainties. Together with the immigration policy of a destination country, it is certainly one of the most important determinants of migration, creating strong idiosyncrasies in the composition of immigrants to each country. Our data suggest, however, that there may be other factors as well, with a more apparent economic content, that have a strong influence on migration decisions.
4 Employment opportunities and skill-specific incentives to migrate
In addition to controlling for one of the dimensions of distance and potential network effects, the migration literature usually emphasizes the role of wages, or wage differentials between source countries and destination countries, as well as employment opportunities in the destination country, measured for instance through aggregate unemployment rates, as important factors for the decision to migrate in a particular direction (see, e.g., Todaro 1969;
Harris and Todaro 1970). It is important to note, however, that the impact of these factors is in all likelihood much more group-specific than the effects of distance, cultural links, and network effects.13 The same may apply to institutional factors, such as labor market regulation, taxes and benefits, that we will neglect in this paper.14 In terms of a descriptive
13 Immigration policies, however, can be targeted both at citizens of specific source countries and at migrants with specific characteristics, such as education, professional qualifications or age (see section 4.3 below).
14 See Geis et al. (2008) for an empirical analysis which builds on the same data set as the present paper and adds data on national-level institutions to explain migrants’ choices among different destination countries.
analysis, an important and highly interesting dimension of the structure of migrants living in the four destination countries is their skill composition. We will therefore look at this aspect more closely, taking into account in particular how migrants’ skills relate to their employment opportunities and wages in different countries.
4.1. Skill composition of migrants
The idea that high-skilled and low-skilled individuals face different economic incentives to migrate is at the core of the well known application of the Roy model to immigration (Roy 1951; Borjas 1987). This model states that, in a two-country setting in which both countries are equal except for their wage dispersion, high-skilled people will migrate from the country with the lower wage dispersion to the one with the higher wage dispersion, while low-skilled people move in the opposite direction. In a multi-country setting, high-skilled and low-skilled migrants will ceteris paribus choose those destination countries which offer them the highest wages. In addition to wages, skill-specific employment opportunities as well as institutional factors may further contribute to differentiate incentives to migrate to a particular country by the level of skills of the potential migrants.
To what extent do migrants with different skill levels really choose different destination countries? To address this question, we need a consistent measure of skills. Assuming that the skill level of an individual is determined by, or at least highly correlated with, educational attainments, it can be measured by the highest educational degree obtained. To rank educational degrees of various kinds, we use the International Standard Classification of Education (ISCED), a classification which was developed by the UNESCO (1997) to allow for international comparisons of educational degrees. For the German data we use an algo- rithm proposed by Schrödter et al. (2006); for the US data we apply the mapping between years of schooling and ISCED levels provided in Institute for Education Sciences (2007); for the British data our re-classification follows the LFS User Guide (2007) with two devia- tions;15 the French data already contain education levels in the ISCED classification.
Here, we do not use all ISCED levels, but condense them into four educational groups: no secondary educational attainment (ISCED 0-1), lower secondary educational attainment (ISCED 2), upper secondary and postsecondary non-tertiary educational attainment (ISCED
15 First, we classify people who state to have been in school but have not acquired any formal degree as ISCED 1, not as ISCED 2. Second, we do not classify all people who state to have “other qualifications” as ISCED 3, but assign them the median ISCED level of people with the same age and the same (last) occupation. For this we use the SOC (Standard Occupational Classification) 2000 unit-level classification which distinguishes between 353 different occupations. An assignment of education levels is necessary, as most foreign degrees are recorded as “other qualification” in the British LFS.
3-4), and tertiary educational attainment (ISCED 5-6). A major reason is that differentiations between ISCED 3 and 4 and between ISCED 5 and 6 are hardly comparable across countries.
Table 2 gives an overview of the skill structure of immigrants to our four destination countries based on these groups, also comparing it to the skill structure of the native populations. We now focus on individuals between 25 and 54 years, as these people are generally part of the labor force.
Table 2: Immigrants aged 25-54 by skill groups
France Germany Natives Immigrants Natives Immigrants
ISCED 0-1
Number 1,613,090 699,323 368,143 718,828
Share 7.13% 28.56% 1.24% 11.70%
Share of immigrants 30.24% 66.13%
Participation rate 74.75% 67.98% 68.14% 60.36%
Unemployment rate 13.18% 19.15% 29.47% 26.86%
Wage $12.87 $12.91 $9.61 $13.51
ISCED 2
Number 4,478,207 512,363 3,003,786 1,596,041
Share 19.78% 20.92% 10.14% 25.97%
Share of immigrants 10.27% 34.70%
Participation rate 84.92% 76.05% 79.40% 75.08%
Unemployment rate 12.10% 21.55% 18.42% 20.65%
Wage $14.44 $13.22 $13.31 $13.42
ISCED 3-4
Number 10,167,941 701,190 17,763,323 2,547,618
Share 44.92% 28.63% 59.95% 41.45%
Share of immigrants 6.45% 12.54%
Participation rate 90.00% 81.39% 88.62% 84.46%
Unemployment rate 6.90% 17.19% 9.87% 15.56%
Wage $15.32 $14.23 $15.30 $14.71
ISCED 5-6
Number 6,375,285 535,926 8,490,608 1,282,602
Share 28.17% 21.89% 28.66% 20.87%
Share of immigrants 7.75% 13.12%
Participation rate 91.67% 80.90% 90.61% 81.55%
Unemployment rate 5.45% 15.81% 3.92% 12.69%
Wage $20.86 $19.56 $20.87 $20.02
Total
Number 22,634,522 2,448,802 29,628,916 6,145,765
Share of immigrants 9.76% 17.18%
Participation rate 88.38% 76.34% 88.00% 78.60%
Unemployment rate 7.84% 18.28% 9.09% 17.22%
Wage $16.65 $14.85 $16.86 $15.52
Note: Immigrants are defined as in version iii in table 1. Hourly wages are derived as described in the appendix.
Source: National micro-data sets; authors’ calculations.
Table 2 (cont’d.): Immigrants aged 25-54 by skill groups
UK US
Natives Immigrants Natives Immigrants
ISCED 0-1
Number 2,590,481 509,257 1,667,184 3,884,751
Share 11.92% 19.89% 1.63% 18.27%
Share of immigrants 16.43% 69.97%
Participation rate 61.94% 49.95% 51.41% 73.25%
Unemployment rate 6.98% 9.25% 13.33% 7.99%
Wage $14.17 $12.47 $14.24 $11.39
ISCED 2
Number 3,905,006 305,096 7,655,447 2,659,406
Share 17.96% 11.92% 7.47% 12.51%
Share of immigrants 7.25% 25.78%
Participation rate 82.30% 78.99% 67.58% 74.26%
Unemployment rate 4.27% 7.65% 14.63% 7.80%
Wage $15.99 $15.98 $14.13 $12.84
ISCED 3-4
Number 8,428,241 880,387 53,448,746 7,583,786
Share 38.77% 34.38% 52.18% 35.67%
Share of immigrants 9.46% 12.43%
Participation rate 88.44% 84.08% 81.64% 78.40%
Unemployment rate 2.78% 5.65% 6.39% 6.26%
Wage $18.60 $19.77 $18.75 $16.38
ISCED 5-6
Number 6,736,941 715,139 39,661,288 7,132,580
Share 30.99% 27.93% 38.72% 33.55%
Share of immigrants 9.60% 15.24%
Participation rate 93.08% 87.75% 87.84% 81.23%
Unemployment rate 1.81% 5.43% 3.01% 4.24%
Wage $25.87 $26.16 $30.68 $30.08
Total
Number 21,739,180 2,560,563 102,432,665 21,260,523
Share of immigrants 10.54% 17.19%
Participation rate 85.34% 73.34% 82.50% 77.89%
Unemployment rate 3.11% 7.02% 5.57% 6.04%
Wage $20.40 $20.63 $23.44 $20.05
Note: Immigrants are defined as in version iii in table 1. Hourly wages are derived as described in the appendix.
Source: National micro-data sets; authors’ calculations.
According to table 2, our data support the idea that the Anglo-Saxon countries attract highly qualified migrants, whereas Germany and France attract low-skilled ones. Among all immigrants aged 25-54, 34% have a tertiary degree (ISCED 5-6) in the US and 28% in the UK. In France and Germany, this share is substantially lower, with 22% and 21%, respectively. However, the share of natives with a tertiary degree is also much higher in the US (39%) and still higher in the UK (31%) than in France (28%) and Germany (29%). Up to a point, this general observation still holds if we apply a broader skill measure. Considering the shares of all migrants with at least an upper secondary degree (ISCED 3-6), we find that 69%
of the immigrants in the US, 62% in Germany and the UK, but only 50% in France belong to this group. It should be noted, by the way, that in the UK only 69% of the native population aged 25-54 have at least an upper secondary degree, while 73% of the French, 89% of the German and even 91% of the US native population do. Relative to natives, the educational level of immigrants is thus by far the highest in the UK.
In some cases, the skill structure of migrants also differs remarkably by source countries.
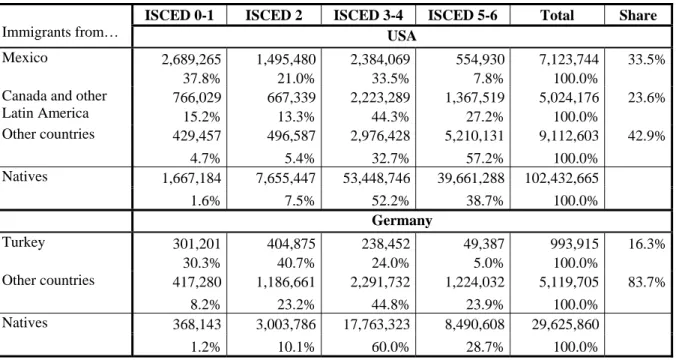
Probably the most prominent example is given by the US. Table 3 (upper panel) shows that there are enormous differences in the educational levels of immigrants from Mexico, from Canada and other Latin American countries, and from all other countries. 38% of the immigrants from Mexico do not have a secondary educational degree (ISCED 0-1), while the same holds for less than 5% of the migrants from “other countries”. On the other hand, only 8% of the immigrants from Mexico have a tertiary degree (ISCED 5-6), in contrast to 57% of the people from other countries. Keeping in mind that 34% of all immigrants to the US come from Mexico and 43% from “other countries”, this shows that the immigrant population is very heterogeneous. In Europe, these differences are by far smaller, and the immigrant population is more homogeneous. Nevertheless, there is some variation in the skill structure of various sub-groups of immigrants also there, immigrants from Turkey and other countries to Germany offering a good example. Only 5% of the people from Turkey have a tertiary degree, while more than 23% of the people from other countries do (see table 3, lower panel).
Table 3: Immigrants to the USA and Germany aged 25-54, by skill groups
ISCED 0-1 ISCED 2 ISCED 3-4 ISCED 5-6 Total Share
Immigrants from… USA
2,689,265 1,495,480 2,384,069 554,930 7,123,744 33.5%
Mexico
37.8% 21.0% 33.5% 7.8% 100.0%
766,029 667,339 2,223,289 1,367,519 5,024,176 23.6%
Canada and other
Latin America 15.2% 13.3% 44.3% 27.2% 100.0%
429,457 496,587 2,976,428 5,210,131 9,112,603 42.9%
Other countries
4.7% 5.4% 32.7% 57.2% 100.0%
1,667,184 7,655,447 53,448,746 39,661,288 102,432,665 Natives
1.6% 7.5% 52.2% 38.7% 100.0%
Germany
301,201 404,875 238,452 49,387 993,915 16.3%
Turkey
30.3% 40.7% 24.0% 5.0% 100.0%
417,280 1,186,661 2,291,732 1,224,032 5,119,705 83.7%
Other countries
8.2% 23.2% 44.8% 23.9% 100.0%
368,143 3,003,786 17,763,323 8,490,608 29,625,860 Natives
1.2% 10.1% 60.0% 28.7% 100.0%
Source: American Community Survey; German Mikrozensus; authors’ calculations.
4.2 Employment opportunities and wages by skill groups
Employment opportunities for natives and immigrants are usually far from equal. In addition, this difference also varies by educational levels, yet with substantial variation across our four destination countries (see, again, table 2). In the US, the unemployment rate of immigrants aged 25-54 with lower skills (ISCED 0-2) is 6 percentage points lower than the one of natives in the same skill groups. In Germany and the UK, the rate is 3 percentage points higher, and in France it is 8 percentage points higher. At the same time, the participation rate of immigrants with lower skills is higher in the US than in Europe, whereas participation rates of natives in the same skill groups are clearly higher in (continental) Europe than they are in the US. This indicates that low-skilled immigrants are much better integrated in the US labor market than in the European ones.
The unemployment rate of immigrants with high skills (ISCED 5-6) relatively to the one of natives in the same skill group is again lowest in the US. There, it is higher by a factor of about 1.4; the corresponding figure for France is about 2.9, for the UK about 3.0 and for Germany about 3.2. Taking into account that participation rates in this group are about 81% in Germany, France and the US and 88% in the UK, these numbers indicate that for highly qualified immigrants it appears to be much easier to enter the American labor market than the German and French one.
Comparing wages at an international level is difficult in general, and it is certainly not facilitated by our use of data sets from differing sources. In an appendix to this paper, we describe the procedures we applied to extract a rough, but meaningful, measure of wages per hour. Our wage data indicate that, except for high-skilled immigrants (ISCED 5-6), wages of immigrants are much lower than those of natives in the US, whereas in the European countries wages of immigrants and natives are similar. This could be the reason why the unemployment rate in the US is lower for immigrants than for natives and higher in the European countries. Given the nature of our wage data, it is unfortunately not possible to compare the precise degree of wage dispersion across our four destination countries. Using simple measures, the dispersion of hourly wages appears to be a lot wider in the US than in the European countries, and still somewhat wider in the UK than in France and Germany.16 However, the result for the US may be exaggerated by the way we constructed our wage data.
Educational attainments are not the only measure for the level of skills of migrants, as skills are not only reflected in formal qualifications, but also relate to motivation and, in particular, entrepreneurship (see Saint-Paul 2004). An alternative approach to measuring the
16 For instance, the Gini coefficient of our measure of wages per hour is 0.423 for the US, 0.441 for the UK, 0.457 for France, and 0.458 for Germany.
skills of migrants, based on their willingness to take on economic risks, could thus be to look at the shares of self-employed individuals among them. Legal rules for self-employment are different in our four destination countries, so that direct cross-country comparisons of these shares may not be appropriate. Table 4 therefore also displays the immigrants-to-natives ratios of self-employment for individuals aged 25-54 in each country. Self-employment is more wide-spread among immigrants than it is among natives in France, the UK and the US, while in Germany the share of immigrants who are self-employed is lower than that of natives.
Table 4: Share of self-employment in total employment, individuals aged 25-54 France Germany UK US
Natives 9.4% 11.5% 12.5% 10.0%
Immigrants 10.3% 10.7% 14.7% 10.8%
Immigrants/Natives 1.09 0.93 1.18 1.08
Source: National micro-data sets; authors’ calculations.
4.3 Skill-specific immigration programs
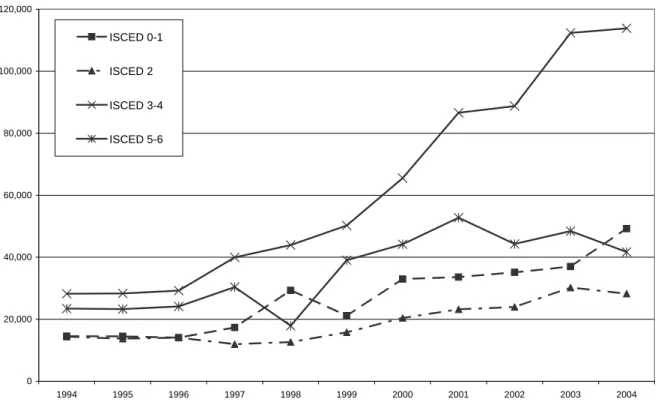
Besides skill-specific employment opportunities and wages in the destination country, there are also preferential immigration rules for high-skilled people that we have neglected so far, such as the “Highly Skilled Migrant Programme” (HSMP) in the UK, the “H1B visa” in the US and the German “Green Card” for IT specialists (Zaletel 2006). To show the effects of group-specific immigration policies, the British HSMP is most interesting. This program was launched in January 2002, without any preceding scheme of a similar type. It gives people access to the UK regardless of a specific job offer if they reach a certain score based on their qualifications and experience. To see whether this program has been effective in any way, we plot the numbers of all immigrants aged 18-65 to the UK by year of arrival and educational level in figure 3. The figure indicates that immigration of individuals holding tertiary degrees (ISCED5-6) has not increased after 2001, while immigration of those with an upper and post- secondary degree (ISCED3-4) has continued to go up substantially. This means that the HSMP did not have much effect on its most important target group. However, it is not unlikely that discussions about this program and its implementation had a signaling effect for persons with intermediate skills, thus stimulating their immigration.
In the US, selective immigration policies have been rather successful, except for the effects on immigration from its neighboring countries. As we have already seen in table 3 (upper panel), the share of individuals aged 25-54 with a tertiary degree (ISCED 5-6) who came from countries other than Canady and Latin America is extremely high, at 57%.
Conversely, the share of immigrants from these countries without an upper secondary education (ISCED 0-2) is very low, at 10%. Failure to reach similarly favorable results vis-à- vis Mexico and other source countries in North, Central and Caribbean America is mainly due to family reunification rules which offer an alternative route for a significant number of people in each year for getting access to the US without any skill-specific selection. Overall, our data nevertheless indicate that, so far, there is a difference between the US and Europe, not so much between the Anglo-Saxon countries and the continental European ones, regarding the effectiveness of selective migration policies.
Fig. 3: Immigrants to the UK aged 18-65, by year of arrival and skill levels
0 20,000 40,000 60,000 80,000 100,000 120,000
1994 1995 1996 1997 1998 1999 2000 2001 2002 2003 2004
ISCED 0-1
ISCED 2
ISCED 3-4
ISCED 5-6
Source: British Labour Force Survey; authors’ calculations.
4.4 Summary
Now, what do these results tell us about the group-specific determinants of migration? First of all, France and Germany appear to be relatively unattractive for highly-educated migrants, as the unemployment rate of immigrants with a tertiary educational degree (16% and 13%, respectively) is enormous in these countries and wages are significantly lower than in the UK and the US. Thus, it is not surprising that the shares of high-skilled immigrants are much higher in the UK and the US than in continental Europe. Second, across all skill groups our data show an interesting pattern: On the one hand, immigrants earn lower wages than natives in the US, whereas in the European countries the earnings are similar for both groups. On the
other hand, in the European countries immigrants are much more likely to become unemployed than natives, whereas this is not the case in the US. In a sense, both high-skilled and low-skilled immigrants appear to be better integrated in the US labor market than they are in Europe. Last but not least, regardless of whether our destination countries are actively attempting to select immigrants by skills on a larger scale or not, none of them appears to be very successful in attracting mainly high-skilled migrants.
5 Migration between the four destination countries
An interesting feature of our data set is that it also allows for a description of migration between our four destination countries. In this respect, we are able to contribute some insights to recent discussions of whether, in the context of globalization and increasing mobility of all factors of production, there is nowadays a brain drain and, on the receiving side, a brain gain between advanced economies (Saint-Paul 2004).
Table 5 gives an overview of gross migration between the four countries, differentiated by skill levels. Since all of the countries we are looking at are highly developed countries, these mutual flows are basically modest. In particular, the numbers of low-skilled migrants are very small, so that we aggregate low educational degrees to ISCED 0-2. As there are still only 10,000 individuals or less in most of the cells that result, one should be a bit cautious when interpreting these numbers. For comparison, the table also confronts the skill structure of migrants from one country to another with the skill structure of the residents in the source country as well as in the destination country to see whether there are any disproportions on either side.17
Table 5 shows that much more people have migrated from the European countries to the US than the other way round. Within Europe the differences are much smaller. Nevertheless, there are clearly more people from France and the UK who live in Germany than people from Germany living in France and the UK.18 As the same holds for high-skilled persons (ISCED 5-6), Germany appears to benefit from the skill structure of migration within Europe, although on a small scale only. France appears to lose in this game, in terms of total migration and high-skilled migrants, vis-à-vis the other two European countries. All in all however, there is no indication that intra-European migration has a notable impact on the skill structure of both source and destination countries.
17 Note that, in our rough classification of skill levels, migration could be beneficial (detrimental) for both sides if net migration mainly takes place in the intermediate skill group and the sending country has a large share of high-skilled individuals, while the receiving country has a large share of low-skilled individuals (or vice versa).
18 Note that this crucially depends on the definition of immigrants. For instance, if one does not exclude the children of armed forces, then more people from Germany live in the UK than people from the UK in Germany.
Table 5: Migrants between the four countries aged 25-54
... to France ... to Germany ... to the UK ... to the US
From France…
ISCED 0-2 (in brackets: share of total) 7,367 (11.2%) 6,006 (10.6%) 2,053 (2.7%)
% of ISCED group
… in the source country 0.12% 0.03% 0.03%
… in the destination country 0.22% 0.09% 0.02%
ISCED 3-4 (in brackets: share of total) 22,761 (34.6%) 28,165 (49.6%) 19,630 (25.5%)
% of ISCED group
… in the source country 0.22% 0.28% 0.19%
… in the destination country 0.13% 0.33% 0.04%
ISCED 5-6 (in brackets: share of total) 35,689 (54.2%) 22,629 (39.8%) 55,408 (71.9%)
% of ISCED group
… in the source country 0.56% 0.35% 0.87%
… in the destination country 0.42% 0.34% 0.14%
Total 65,817 (100%) 56,800 (100%) 77,091 (100%)
From Germany
ISCED 0-2 (in brackets: share of total) 7,375 (15.1%) 2,363 (7.0%) 10,886 (5.0%)
% of ISCED group
… in the source country 0.22% 0.07% 0.32%
… in the destination country 0.12% 0.04% 0.12%
ISCED 3-4 (in brackets: share of total) 21,135 (43.3%) 16,089 (47.9%) 92,151 (42.5%)
% of ISCED group
… in the source country 0.12% 0.09% 0.52%
… in the destination country 0.21% 0.19% 0.17%
ISCED 5-6 (in brackets: share of total) 20,351 (41.7%) 15,157 (45.1%) 113,912 (52.5%)
% of ISCED group
… in the source country 0.24% 0.18% 1.34%
… in the destination country 0.32% 0.22% 0.29%
Total 48,861 (100%) 33,609 (100%) 216,949 (100%)
From the UK
ISCED 0-2 (in brackets: share of total) 3,755 (10.1%) 6,569 (11.7%) 9,282 (2.8%)
% of ISCED group
… in the source country 0.06% 0.10% 0.15%
… in the destination country 0.06% 0.19% 0.10%
ISCED 3-4 (in brackets: share of total) 12,833 (34.4%) 20,098 (35.8%) 121,502 (37.2%)
% of ISCED group
… in the source country 0.15% 0.24% 1.44%
… in the destination country 0.13% 0.11% 0.23%
ISCED 5-6 (in brackets: share of total) 20,733 (55.6%) 29,481 (52.5%) 195,607 (59.9%)
% of ISCED group
… in the source country 0.31% 0.44% 2.90%
… in the destination country 0.33% 0.35% 0.49%
Total 37,321 (100%) 56,147 (100%) 326,391 (100%)
From the US
ISCED 0-2 (in brackets: share of total) 1,933 (17.8%) 9,752 (13.2%) 6,385 (11.0%)
% of ISCED group
… in the source country 0.02% 0.10% 0.07%
… in the destination country 0.03% 0.29% 0.10%
ISCED 3-4 (in brackets: share of total) 151 (1.4%) 25,817 (35.0%) 29,941 (51.5%)
% of ISCED group
… in the source country 0.00% 0.05% 0.06%
… in the destination country 0.00% 0.15% 0.36%
ISCED 5-6 (in brackets: share of total) 8,788 (80.8%) 38,177 (51.8%) 21,771 (37.5%)
% of ISCED group
… in the source country 0.02% 0.10% 0.05%
… in the destination country 0.14% 0.45% 0.32%
Total 10,872 (100%) 73,747 (100%) 58,097 (100%) Source: National micro-data sets; authors’ calculations.