Association mapping of genomic microdeletions and common susceptibility variants predisposing to
genetic generalized epilepsies
I n a u g u r a l - D i s s e r t a t i o n zur
Erlangung des Doktorgrades
der Mathematisch-Naturwissenschaftlichen Fakultät der Universität zu Köln
vorgelegt von Holger Sebastian Trucks
aus Köln
2013
Berichterstatter: Prof. Dr. Peter Nürnberg (Gutachter) Prof. Dr. Bernd Wollnik
Tag der mündlichen Prüfung: 04.07.2013
Table of contents
Table of contents ... I Publications ... IV Abstract ... VI Zusammenfassung ... VIII List of figures ... X List of tables ... XII List of abbreviations ... XIII
1 Introduction ... 1
1.1 Introduction to Epilepsy ... 1
1.2 Classification of genetic generalized epilepsy (GGE) syndromes ... 2
1.3 Genetic factors of GGE syndromes ... 4
1.4 Structural genomic variations in human disease ... 8
1.5 Genomic microdeletions in genetic generalized epilepsy ... 10
1.6 Objectives ... 12
2 Methods and Materials ... 14
2.1 Study Participants ... 14
2.2 Array-based SNP genotyping ... 15
2.2.1 DNA preparation and quality control ... 15
2.2.2 SNP genotyping using the Affymetrix Genome-Wide SNP Array 6.0 ... 15
2.2.3 SNP genotyping using the Affymetrix Axiom® Genome-Wide SNP array 16 2.3 Genome-wide association studies... 17
2.3.1 Array and SNP and quality control ... 17
2.3.2 Principal component analysis ... 18
2.3.3 SNP imputing ... 19
2.3.4 Case-control-based genome-wide association analysis ... 22
2.3.5 Family-based genome-wide association analysis ... 23
2.3.6 Meta-analysis of case-control and family-based association studies ... 23
2.3.7 Relative risk and odds ratio ... 24
2.3.8 Genomic control ... 25
2.3.9 Power calculations ... 26
2.3.10 GWAS significance threshold and presentation of results ... 27
2.4 Copy number analysis ... 28
2.4.1 Copy number analysis using Affymetrix SNP6.0 arrays ... 28
2.4.2 Loss-of-Heterozygosity screening to predict recurrent microdeletions . 28 2.4.3 Quantitative real-time PCR ... 30
2.4.4 Array comparative genomic hybridization ... 31
2.4.5 Association tests based on contingency tables ... 31
2.4.6 Analysis of recurrent microdeletions ... 32
2.4.7 Family-based analysis of large recurrent microdeletions ... 33
2.4.8 Penetrance estimations for copy number variants ... 34
2.4.9 Candidate gene approach to detect exon-ablating microdeletions ... 35
3 Results... 37
3.1 Genome-wide association and meta-analysis ... 37
3.1.1 Genome-wide association and meta-analysis of GGE patients ... 37
3.1.2 Genome-wide association and meta-analysis of GAE patients ... 42
3.1.3 Genome-wide association and meta-analysis of JME patients ... 47
3.2 Analysis of recurrent microdeletions associated with GGE ... 52
3.3 Analysis of exon-ablating microdeletions associated with GGE ... 61
3.3.1 Exon-ablating microdeletions in NRXN1 ... 61
3.3.2 Exon-ablating microdeletions in RBFOX1 ... 64
4 Discussion ... 68
4.1 Genome-wide association and meta-analysis ... 68
4.1.1 Significant association with GGE at 2p16.1 ... 68
4.1.2 Significant association with JME at 1q43 ... 69
4.1.3 Suggestive association with GGE at 8q12.2 ... 70
4.1.4 Suggestive association with GAE at 2q22.3 ... 70
4.2 Recurrent microdeletions in GGE ... 71
4.3 Exon-ablating microdeletions in NRXN1 and RBFOX1 ... 76
4.3.1 Exon-ablating microdeletions in NRXN1 ... 77
4.3.2 Exon-ablating microdeletions in RBFOX1 ... 78
4.4 Outlook ... 80
5 References ... 83
6 Supplementary material ... 104
6.1 Overview of seizure types ... 104
6.2 Genomic regions excluded from PCA ... 106
6.3 QQ-plots of genome-wide associations studies ... 107
6.3.1 QQ-plots of GWAS in GGE ... 107
6.3.2 QQ-plots of GWAS in GAE ... 108
6.3.3 QQ-plots of GWAS in JME ... 109
6.4 Samples with recurrent microdeletions ... 110
6.5 Samples with exon-ablating microdeletions in NRXN1 and RBFOX1 ... 115
Acknowledgements ... 116
Eidesstattliche Erklärung ... 117
Curriculum Vitae ... 118
Publications
Parts of this study have been published previously:
Rare exonic deletions of the RBFOX1 gene increase risk of idiopathic generalized epilepsy. Lal D, Trucks H, Møller RS, Hjalgrim H, Koeleman BP, de Kovel CG, Visscher F, Weber YG, Lerche H, Becker F, Schankin CJ, Neubauer BA, Surges R, Kunz WS, Zimprich F, Franke A, Illig T, Ried JS, Leu C, Nürnberg P, Sander T; EMINet Consortium; EPICURE Consortium. Epilepsia. 2013 Feb; 54(2):265-71.
doi: 10.1111/epi.12084. Epub 2013 Jan 25.PMID: 23350840
Exon-disrupting deletions of NRXN1 in idiopathic generalized epilepsy. Møller RS, Weber YG, Klitten LL, Trucks H, Muhle H, Kunz WS, Mefford HC, Franke A, Kautza M, Wolf P, Dennig D, Schreiber S, Rückert IM, Wichmann HE, Ernst JP, Schurmann C, Grabe HJ, Tommerup N, Stephani U, Lerche H, Hjalgrim H, Helbig I, Sander T; EPICURE Consortium. Epilepsia.2013 Jan 7.doi: 10.1111/epi.12078. [Epub ahead of print] PMID:23294455
Genome-wide association analysis of genetic generalized epilepsies implicates susceptibility loci at 1q43, 2p16.1, 2q22.3 and 17q21.32. EPICURE Consortium, EMINet Consortium, Steffens M, Leu C, Ruppert AK, Zara F, Striano P, Robbiano A, Capovilla G, Tinuper P, Gambardella A, Bianchi A, La Neve A, Crichiutti G, de Kovel CG, Kasteleijn-Nolst Trenité D, de Haan GJ, Lindhout D, Gaus V, Schmitz B, Janz D, Weber YG, Becker F, Lerche H, Steinhoff BJ, Kleefuß-Lie AA, Kunz WS, Surges R, Elger CE, Muhle H, von Spiczak S, Ostertag P, Helbig I, Stephani U, Møller RS, Hjalgrim H, Dibbens LM, Bellows S, Oliver K, Mullen S, Scheffer IE, Berkovic SF, Everett KV, Gardiner MR, Marini C, Guerrini R, Lehesjoki AE, Siren A, Guipponi M, Malafosse A, Thomas P, Nabbout R, Baulac S, Leguern E, Guerrero R, Serratosa JM, Reif PS, Rosenow F, Mörzinger M, Feucht M, Zimprich F, Kapser C, Schankin CJ, Suls A, Smets K, De Jonghe P, Jordanova A, Caglayan H, Yapici Z, Yalcin DA, Baykan B, Bebek N, Ozbek U, Gieger C, Wichmann HE, Balschun T, Ellinghaus D, Franke A, Meesters C, Becker T, Wienker TF, Hempelmann A, Schulz H, Rüschendorf F, Leber M, Pauck SM,
Trucks H, Toliat MR, Nürnberg P, Avanzini G, Koeleman BP, Sander T. Hum Mol Genet. 2012 Dec 15;21(24):5359-72. doi: 10.1093/hmg/dds373. Epub 2012 Sep 4.
PMID: 22949513
Recurrent microdeletions at 15q11.2 and 16p13.11 predispose to idiopathic generalized epilepsies. deKovel CG*, Trucks H*, Helbig I*, Mefford HC, Baker C, Leu C, Kluck C, Muhle H, von Spiczak S, Ostertag P, Obermeier T, Kleefuss-Lie AA, Hallmann K, Steffens M, Gaus V, Klein KM, Hamer HM, Rosenow F, Brilstra EH, Trenité DK, Swinkels ME, Weber YG, Unterberger I, Zimprich F, Urak L, Feucht M, Fuchs K, Møller RS, Hjalgrim H, De Jonghe P, Suls A, Rückert IM, Wichmann HE, Franke A, Schreiber S, Nürnberg P, Elger CE, Lerche H, Stephani U, Koeleman BP, Lindhout D, Eichler EE, Sander T. Brain. 2010 Jan; 133(Pt 1):23-32. Epub 2009 Oct 20. PMID: 19843651 (* shared first authorship)
Abstract
Approximately 3% of the general population is affected by epilepsy during lifetime, making epilepsy one of the most common neurological diseases. Genetic generalized epilepsies (GGE) are the most common of genetic epilepsies and account for 20-30%
of all epilepsies. GGE is subdivided into genetically determined subgroups with gradual transition, including genetic absence epilepsies (GAE), juvenile myoclonic epilepsy (JME), and epilepsy with generalized tonic-clonic seizures (EGTCS). In spite of a high heritability rate of 80% and a predominant genetic etiology, the genetic factors predisposing to GGE are still mostly unknown. In the present study, we carried out association studies to investigate whether genomic microdeletions and common susceptibility variants increase risk for GGE.
To test the common disease/common variant hypothesis, genome-wide association studies (GWAS) were performed in several GGE cohorts using case-control and family-based study designs. For analysis, all patients were either pooled or stratified according to the subgroup they belong to in order to detect common or subgroup- specific risk factors, respectively. The GWAS comprised a case-control cohort of 1,523 European GGE patients and 2,454 German controls and a sample cohort of 566 European parent-offspring trios. Meta-GWAS analyses revealed significant association (P < 5.0 × 10⁻⁸) with GGE at 2p16.1 (rs35577149, meta-analysis P = 1.65
× 10-8, OR[C] = 0.78, 95% CI 0.71 – 0.86). Significant association with JME was detected at 1q43 (rs12059546, meta-analysis P = 2.27 × 10⁻⁸, OR[G] = 1.53, 95% CI 1.33 – 1.78). Suggestive evidence for association (P < 1.0 × 10⁻⁵) was found for GGE at 8q12.2 (rs6999304, meta-analysis P= 1.77 × 10⁻⁶, OR[G] = 1.33, 95% CI 1.17 - 1.51) and for GAE at 2q22.3 (rs75917352, meta-analysis P = 1.41 × 10⁻⁷, OR[T] = 0.67, 95% CI 0.58 – 0.79). The associated regions harbor high-ranking candidate genes: CHRM3 at 1q43, VRK2 at 2p16.1, and ZEB2 at 2q22.3. Further replication efforts are necessary to elucidate whether these positional candidate genes contribute to the heritability of the common GGE syndromes.
Exploring the rare variant/common disease hypothesis, we investigated the impact of six recurrent microdeletions on the genetic risk of GGE at the genomic hotspot regions 1q21.1, 15q11.2, 15q13.3, 16p11.2, 16p13.11, and 22q11.2, which had been
implicated as rare genetic risk factors in a wide range of neurodevelopmental disorders. Recurrent microdeletions were assessed in 1,497 European GGE patients, 5,374 controls, and 566 GGE trios using high-resolution SNP microarrays.
Considering all six microdeletion hot spots together, we found a significant excess of these microdeletions in 2,563 GGE patients versus 5,940 controls (P < 2.20 × 10⁻¹⁶, OR = 7.65, 95% CI 4.59 – 13.18). Individually, significant associations with GGE were observed for the microdeletions at 15q11.2 (P = 1.12 × 10⁻⁴, OR = 3.59, 95% CI 1.80 – 7.25), 15q13.3 (P = 5.48× 10⁻⁹) and 16p13.11 (P = 4.42× 10⁻⁶, OR = 17.39, 95% CI 3.86 – 159.88).
In a candidate-gene approach, we tested whether exon-disrupting/removing microdeletions in the genes encoding NRXN1 and RBFOX1 confer susceptibility for GGE. We found a significant association with GGE at both loci (NRXN1: P = 0.0049;
RBFOX1: P = 0.0083). However, high phenotypic variability and incomplete penetrance, resulting in apparently imperfect segregation, indicate that partial NRXN1 and RBFOX1 deletions represent susceptibility factors rather than highly penetrant mutations.
The present study substantiates a role of both genomic microdeletions and common susceptibility variants in the genetic predisposition of common GGE syndromes. We strengthened the statistical evidence for associations of genetic variants at 1q43, 2p16.1, and 2q23.2 with GGE syndromes and identified a novel susceptibility locus at 8q12.2. Although individually rare, the associations of all microdeletions at 15q11.2, 15q13.3, 16p13.3, NRXN1, and RBFOX1 taken together contribute significantly to the genetic variance of GGE.
Zusammenfassung
Etwa 3% der allgemeinen Bevölkerung ist zu Lebzeiten von Epilepsie betroffen.
Somit ist Epilepsie eine der häufigsten neurologischen Erkrankungen. Genetische generalisierte Epilepsien (GGE) sind die häufigsten genetisch bedingten Epilepsien und verantwortlich für 20-30% aller Epilepsien. Die GGE lassen sich in Subgruppen mit fließenden Übergängen im Phänotyp unterteilen. Zu diesen zählen die genetische Absence-Epilepsie (GAE), die juvenile myoklonische Epilepsie (JME) und die Epilepsie mit generalisierten tonisch-klonischen Anfällen (EGTCS). Trotz einer hohen Erblichkeit von 80% und einer überwiegend genetischen Ätiologie, sind die genetischen Faktoren zur Entstehung von GGE immer noch weitgehend unbekannt.
In der vorliegenden Studie führten wir Assoziationsstudien durch, um zu untersuchen, ob genomische Mikrodeletionen und häufige Suszeptibilitäts- Varianten das Risiko für GGE erhöhen.
Um die „common disease/common variant“-Hypothese zu testen, wurden genomweite Assoziationsstudien (GWAS) in mehreren GGE-Kohorten unter Verwendung von fall-kontroll- und familien-basierten Studiendesigns durchgeführt.
Für die Analyse wurden die Patienten sowohl alle zusammen als auch nach der Zugehörigkeit zur jeweiligen Untergruppe separat betrachtet, um gemeinsame oder untergruppen-spezifische Risikofaktoren zu erkennen. Die GWAS umfasste eine Fall- Kontroll-Kohorte mit 1.523 GGE-Patienten europäischen Ursprungs und 2.454 deutschen Kontrollen, sowie einer Probenkohorte aus 566 europäischen Eltern- Kind-Trios. Meta-GWAS-Analysen ergaben signifikante Assoziation (p <5,0 x 10⁻⁸) mit GGE auf 2p16.1 (rs35577149, Meta-Analyse P = 1,65 × 10⁻⁸, oder [C] = 0,78, 95% CI von 0,71 bis 0,86). Signifikante Assoziation mit JME wurde auf 1q43 nachgewiesen (rs12059546, Meta-Analyse P = 2,27 × 10⁻⁸, OR [G] = 1,53, 95% CI 1,33 bis 1,78). Suggestive Assoziation (P <1,0 × 10⁻⁵) mit GGE wurde auf 8q12.2 gefunden (rs6999304, Meta-Analyse P = 1,77 × 10⁻⁶, oder [G] = 1,33, 95% CI 1,17 bis 1,51), sowie für GAE auf 2q22.3 (rs75917352, Meta-Analyse P = 1,41 × 10⁻⁷, oder [T] = 0,67, 95% CI 0,58 bis 0,79). Die damit verbundenen Regionen beherbergen hochrangige Kandidatengene: CHRM3 auf 1q43, VRK2 auf 2p16.1 und ZEB2 auf 2q22.3. Weitere Replikationsstudien sind notwendig, um herauszufinden, ob diese
positionellen Kandidatengene zur Erblichkeit von häufigen GGE-Syndromen beitragen.
Zur Erforschung der „common disease/rare variant“-Hypothese untersuchten wir den Einfluss von sechs rekurrenten Mikrodeletionen auf das genetische Risiko von GGE. Diese treten in genomischen „Hotspot“-Regionen bei 1q21.1, 15q11.2, 15q13.3, 16p11.2, 16p13.11 und 22q11.2 auf und waren zuvor als seltene genetische Risikofaktoren in einer Vielzahl von neurologischen Erkrankungen erkannt worden.
Die Untersuchung der rekurrenten Mikrodeletionen erfolgte primär mit hochauflösenden SNP-Mikroarrays in 1.497 europäischen GGE-Patienten, 5.374 Kontrollen und 566 GGE-Trios. Wenn alle sechs Mikrodeletions-Hotspots zusammen betrachtet wurden, zeigte sich eine signifikante Anhäufung dieser Mikrodeletionen in einer erweiterten Stichprobe von 2.563 GGE-Patienten im Vergleich zu 5.940 Kontrollen (P <2.20 × 10⁻¹⁶, OR = 7.65, 95% CI 4,59 bis 13,18). Einzeln betrachtet wurden signifikante Assoziationen mit GGE für die Mikrodeletionen auf 15q11.2 (P = 1.12 × 10⁻⁴, OR = 3.59, 95% CI 1.80 – 7.25), 15q13.3 (P = 5.48× 10⁻⁹) und 16p13.11 (P = 4.42× 10⁻⁶, OR = 17.39, 95% CI 3.86 – 159.88) gefunden.
In einem Kandidaten-Gen-Ansatz haben wir getestet, ob Multi-Exon-Deletionen in den Genen NRXN1 und RBFOX1 zur Suszeptibilität von GGE beitragen. An beiden Loci (NRXN1: P = 0,0049; RBFOX1: P = 0,0083) fanden wir eine signifikante Assoziation entsprechender Mikrodeletionen mit GGE. Allerdings deuten die beobachtete hohe phänotypische Variabilität und unvollständige Penetranz und die daraus resultierende unvollkommene Segregation in den betroffenen Familien darauf hin, dass partielle Deletionen von NRXN1 und RBFOX1 eher als Suszeptibilitäts-Faktoren denn als hoch-penetrante Mutationen zu betrachten sind.
Die vorliegende Studie belegt, dass sowohl genomische Mikrodeletionen als auch häufige Suszeptibilitätsvarianten eine wichtige Rolle für die genetische Prädisposition von häufigen GGE-Syndromen spielen. So gelang es, die statistische Evidenz für Assoziationen von genetischen Varianten auf 1q43, 2p16.1 und 2q23.2 mit GGE-Syndromen zu erhöhen und einen neuen Suszeptibilitätslokus auf 8q12.2 zu identifizieren. Ferner zeigte sich, dass seltene Mikrodeletionen auf 15q11.2, 15q13.3 und 16p13.3 sowie an den Genloci NRXN1 und RBFOX1 in ihrer Gesamtheit erheblich zur genetischen Varianz von GGE beitragen.
List of figures
Figure Title Page
Figure 1-1 Biological spectrum of epilepsy 3
Figure 1-2 Overlap of the complex phenotypes of most common genetic generalized epilepsies
4
Figure 1-3 Multifactorial-polygenic model of disease 7
Figure 2-1 Plot of principal components 1 and 2 from PCA 19
Figure 2-2 Simplified procedure of imputing 20
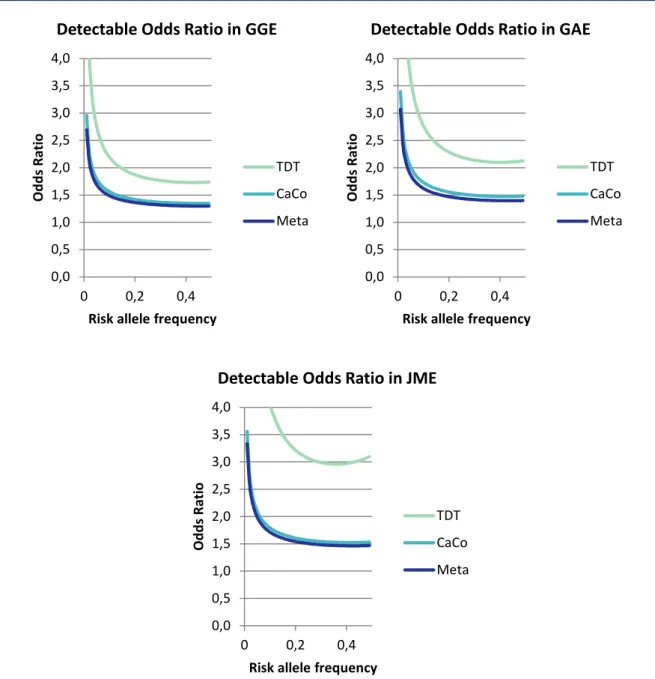
Figure 2-3 Detectable Odds Ratios for genome-wide association of TDT, case- control and meta-analysis in GGE, GAE and JME
27
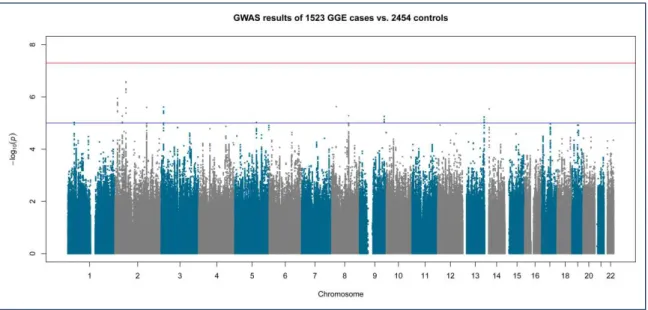
Figure 3-1 Manhattan plot of genome-wide association results in 1,523 GGE cases versus 2,454 controls
38
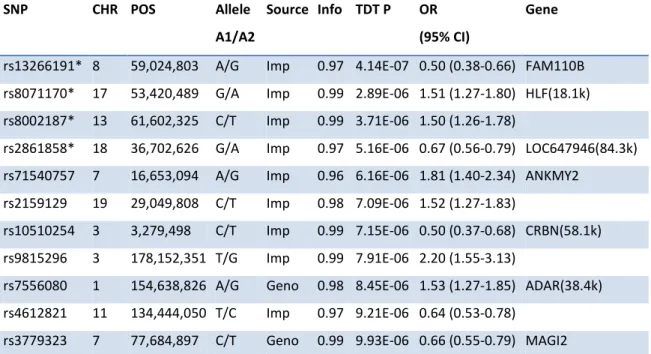
Figure 3-2 Manhattan plot of genome-wide association in 566 GGE trios 40 Figure 3-3 Manhattan plot of genome-wide association meta-analysis in 1,523
GGE cases, 2,454 controls and 566 GGE trios
41
Figure 3-4 Regional detail plot of the –log10 of LMM P-value of GGE for SNP rs35577149 on chromosome 2p16.1
42
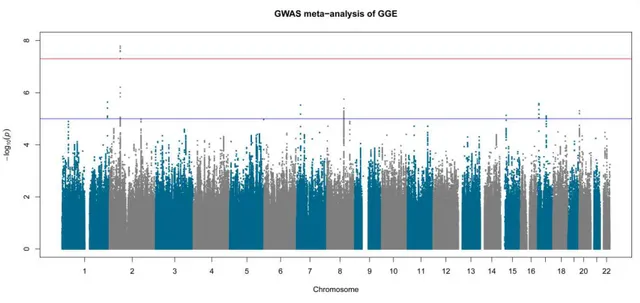
Figure 3-5 Manhattan plot of genome-wide association in 705 GAE cases versus 2454 controls
43
Figure 3-6 Manhattan plot of genome-wide association in 317 GAE trios 45 Figure 3-7 Manhattan plot of genome-wide association meta-analysis in 705 GAE
cases, 2,454 controls and 317 GAE trios
46
Figure 3-8 Manhattan plot of genome-wide association in 579 JME cases versus 2,454 controls
48
Figure 3-9 Manhattan plot of genome-wide association in 157 JME trios 49
Figure Title Page
Figure 3-10 Manhattan plot of genome-wide association meta-analysis in 579 JME cases, 2,454 controls and 157 JME trios
50
Figure 3-11 Regional detail plot of the –log10 of LMM P-value of JME subgroup for SNP rs12059546 on chromosome 1q43
51
Figure 3-12 Recurrent microdeletions at 1q21.1 54
Figure 3-13 Recurrent microdeletions at 15q11.2 54
Figure 3-14 Recurrent microdeletions at 15q13.3 55
Figure 3-15 Recurrent microdeletions at 16p13.11 55
Figure 3-16 Recurrent microdeletions at 16p11.2 56
Figure 3-17 Recurrent microdeletions at 22q11.2 56
Figure 3-18 Familial segregation of the microdeletions at 1q21.1, 15q11.2, 15q13.3, 16p11.2, 16p13.11 and 22q11.2
58,59
Figure 3-19 Genomic positions of the seven exon-ablating NRXN1 deletions 62 Figure 3-20 Familial segregation of exon-ablating NRXN1 deletions 63 Figure 3-21 Genomic positions of exon-ablating deletions in RBFOX1 65 Figure 3-22 Familial segregation of exon-ablating RBFOX1 deletions 66
Figure 6-1 QQ-plots of GWAS in GGE 107
Figure 6-2 QQ-plots of GWAS in GAE 108
Figure 6-3 QQ-plots of GWAS in JME 109
List of tables
Table Title Page
Table 2-1 Calculating risk ratio and odds ratio in a cohort study 24 Table 2-2 Candidate regions for recurrent microdeletions 33 Table 2-3 Position and inclusion criteria for LOH screening of deletion
candidates
35
Table 3-1 Genome-wide association results of LMM P < 1.0 × 10⁻⁵ in GGE 38 Table 3-2 Genome-wide association results of TDT P < 10-5 in GGE 39 Table 3-3 Genome-wide association meta-analysis results of P < 10-5 in GGE 41 Table 3-4 Genome-wide association results of LMM P < 10-5 in GAE 43 Table 3-5 Genome-wide association results of TDT P < 10-5 in GAE 44 Table 3-6 Genome-wide association meta-analysis results of P < 10-5 in GAE 46 Table 3-7 Genome-wide association results of LMM P < 10-5 in JME 48
Table 3-8 Top-ranked GWAS TDT results for JME 49
Table 3-9 Genome-wide association meta-analysis results of P < 10-5 in JME 50 Table 3-10 Recurrent microdeletions in 2,061 GGE patients and 5,940 controls 53 Table 3-11 Penetrance estimations of recurrent microdeletions 60
Table 6-1 Overview of seizure types 104,105
Table 6-2 Genomic regions excluded from PCA 106
Table 6-3 Samples with recurrent microdeletions 110-114
Table 6-4 Samples with exon-ablating microdeletions in NRXN1 115 Table 6-5 Samples with exon-ablating microdeletions in RBFOX1 115
List of abbreviations
Abbreviation Term
aCGH Array Comparative Genome Hybridization ADHD Attention Deficit/Hyperactivity Disorder
ASD Autism spectrum disorder
BAC Bacterial artificial chromosome
bp Base pairs
CAE Childhood absence epilepsy
CDCV "Common disease, common variant" hypothesis CDRV "Common disease, rare variant" hypothesis
CI Confidence Interval
CN Copy Number
CNP Copy Number Polymorphism
CNV Copy Number Variation
cQC Contrast Quality Control value
CR Call Rate
df Degree of freedom
DNA Deoxyribonucleic acid
DZ Dizygotic twins
EEG Electroencephalography
EGTCS Epilepsy with genetic tonic-clonic seizures GTCS Genetic tonic-clonic seizures
EM Expectation-Maximization algorithm
EPI Epilepsy
FoSTeS Fork Stalling and Template Switching FRET Fluorescence resonance energy transfer
FS Febrile seizure
GAE Genetic absence epilepsy
GC Genomic control
GEFS+ Genetic epilepsy with febrile seizures plus
Abbreviation Term
GGE Genetic generalized epilepsy GWAS Genome-wide association study
HMM Hidden Markov Model
HWE Hardy Weinberg Equilibrium
IBD Identity-By-Decent
ID Intellectual disability
ILAE International League Against Epilepsy
IMBIE Institute of Medical Biometry, Informatics and Epidemiology JME Juvenile myoclonic epilepsy
kb Kilo-base pairs
KORA Kooperative Gesundheitsforschung in der Region Augsburg
LCR Low-copy repeats
LD Linkage Disequilibrium
LMM Linear Mixed Model
LOH Loss-Of-Heterozygosity
MAF Minor Allele Frequency
Mb Mega-base pairs
MCMC Markov chain Monte Carlo method
MDS Multidimensional scaling
MZ Monozygotic twins
NAHR Non-allelic homologous recombination
NCBI National Center for Biotechnology Information
ng Nano gram
NHEJ Non-homologous end-joining
OR Odds Ratio
PCA Principal Component Analysis
PCR Polymerase Chain Reaction
PopGen Populations Genetik Biobank
QC Quality control
qPCR Quantitative Polymerase Chain Reaction
Abbreviation Term
QQ-plot Quantile-Quantile-plot RR Relative risk or risk ratio
SD Standard deviation
SHIP Study of Health in Pomerania SNP Single Nucleotide Polymorphism
SZ Schizophrenia
TDT Transmission Disequilibrium Test UCSC University of California, Santa Cruz
1 Introduction
1.1 Introduction to Epilepsy
Epilepsy is a remediless disorder of the brain, defined by the occurrence of at least one unprovoked epileptic seizure. These seizures appear as symptoms due to abnormal excessive or synchronous neuronal activity in the brain (Fisher et al., 2005). Approximately 3% of the general population are affected by an epilepsy during lifetime, making epilepsy one of the most common neurological diseases (Hauser et al., 1993; Freitag et al., 2001). The clinical condition may be seriously troubling for the patient and for his social environment, and result in increased morbidity and premature mortality (Duncan et al., 2006). Up to 50% of epilepsy patients show a comorbidity of other cognitive, behavioral, psychiatric and neurologic disorders, and even sudden death (Tellez-Zenteno et al., 2007; Jensen, 2011; Kanner, 2013).
A genetic background of epilepsy is unquestioned and has been represented in twin and family studies (Berkovic et al., 1998; Callenbach et al., 1998; Bianchi et al., 2003;
Johnson et al., 2003; Kjeldsen et al., 2003). Although 50% of epilepsies are genetically determined, monogenic epilepsies account only for 1-2% of all human epilepsies (Pandolfo, 2011). A number of causative genes have been identified for those forms with a clear family history and simple inheritance, many of them encoding for ion channels or other components of neuronal signaling (Meisler et al., 2001; Reid et al., 2009; Yalçın, 2012a). Despite these distinct findings, variable penetrance and expressivity could be shown for known epileptogenic mutations in animal models, depending on the genetic background (Bergren et al., 2005; Yu et al., 2006; Tan et al., 2008).
For sporadic epilepsies, a complex genetic component is obvious and a population- specific contribution most likely, although difficult to verify (Greenberg et al., 2000;
Cavalleri et al., 2007; Guo et al., 2012). Nonetheless, recent genome-wide association studies (GWAS) were able to successfully identify susceptibility loci for epilepsy (EPICURE Consortium et al., 2012a; Guo et al., 2012). Computational simulations indicate that even small simultaneous changes in several ion channel genes may
have a severe effect, modeling a complex genetic background for common epilepsies (Thomas et al., 2009).
A still increasing number of pathogenic genes, copy number variants and gene regulatory elements have been discovered that are not directly or not at all connected with ion channels or neuronal signaling (Gurnett and Hedera, 2007).
Therefore, the list of potential candidates for epilepsies is extraordinary large.
Despite technical innovations and their remarkable impact on epilepsy research in the past 3 to 15 years (Rees, 2010; Poduri and Lowenstein, 2011a; Hildebrand et al., 2013; Vorstman and Ophoff, 2013), the genetic factors predisposing to epilepsy remain mostly elusive (Helbig and Lowenstein, 2013).
The identification of additional genes influencing the risk for epilepsies has large potential for clinical applications. Diagnostic and predictive testing based on genetic information may help patients to make informed decisions about managing their health care, despite a primary benefit to pharmacogenomics (Ottman et al., 2010).
1.2 Classification of genetic generalized epilepsy (GGE) syndromes
The classification of epileptic syndromes is an outstanding challenge that has been faced for almost 50 years (Gastaut, 1964, 1969; ILAE, 1981, 1985, 1989).
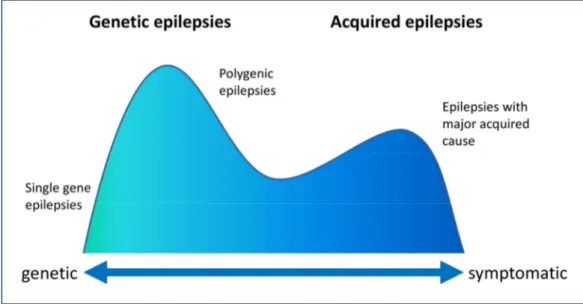
Progressions in the understanding of epilepsies induced several revisions and updates to the traditional classification (Engel, 2001, 2006; Nordli, 2005; Capovilla et al., 2009), and have now outdated former concepts. In 2010, the International League Against Epilepsy (ILAE) Classification Commission introduced a new proposal for new terms and concepts to describe seizures and epilepsies (Berg et al., 2010). The terms idiopathic, symptomatic and cryptogenic have been replaced by the terms genetic, structural/metabolic and unknown (Berg et al., 2010). In contrast to the structural/metabolic (former symptomatic) epilepsies, idiopathic or genetic epilepsies occur in the absence of neurological deficits, intellectual disability, or brain lesions and have no known or suspected external cause, and genetic factors are implicated (Figure 1-1) (Berkovic et al., 2006; Helbig et al., 2008).
Generalized epilepsies are divided into subgroups by seizure type. Those groups are represented by seizures with tonic and/or clonic manifestations (tonic-clonic seizures, clonic seizures, and tonic seizures), absences (typical absences, atypical
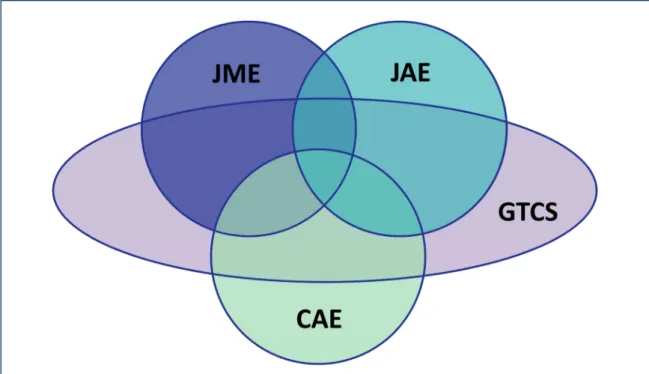
absences, and myoclonic absences), myoclonic seizure types (myoclonic seizures, myoclonic astatic seizures, and eyelid myoclonia), epileptic spasms and atonic seizures (Classification from Engel, 2006. See Suppl. 6-1 for a more detailed overview, including non-generalized forms). These groups may be further divided by age of onset and additional cofactors. Four of these subtypes account for more than 90% of GGEs: Childhood absence epilepsy (CAE), juvenile absence epilepsy (JAE), juvenile myoclonic epilepsy (JME) and epilepsy with generalized tonic-clonic seizures (EGTCS) (Mullins et al., 2007). Those subgroups are often easy to distinguish by age of onset (CAE: 4-8 years, avg. 7.5 years; JAE: 9-13 years, avg. 13.3 years; JME: 12-18 years, avg. 14.6 years; EGTCS: 6-28 years, peak at 17.1 years), electroencephalography (EEG) patterns and by type and occurrence of seizures (Janz, 1997; Nordli, 2005). There has been evidence that those four generalized epilepsy syndromes are closely related to each other, showing similar EEG patterns and excitability in neuronal networks (Moeller et al., 2011; Zambrelli and Canevini, 2011), analogous to family studies suggesting a close genetic relation between CAE and JAE (Marini et al., 2004). Despite these findings and a high rate for remission of 65% until adolescence in CAE, 15-18% of all CAE patients develop JME, demonstrating some connection between the syndromes (Wirrell et al., 1996;
Figure 1-1 | Biological spectrum of epilepsy (Adapted from Berkovic et al., 2006)
Martínez-Juárez et al., 2006). However, phenotypic heterogeneity can be observed within families, that are affected by differing seizure types (Kinirons et al., 2008).
GTCS alone is present in about 50% of the cases, while about 70% of patients with other syndromes experience GTCS at least once in their lifetime (Janz, 1997; Mullins et al., 2007). Several linkage studies support the hypothesis, that interactions and different combinations of common disease loci for GGE are responsible for the spectrum of heterogeneous phenotypes (Figure 1-2) (Sander et al., 2000; Durner et al., 2001; Hempelmann et al., 2006; EPICURE Consortium et al., 2012b).
1.3 Genetic factors of GGE syndromes
The incidence of GGEs is about 20-30%, depending on the tested population (Berg et al., 1999; Freitag et al., 2001; Jallon et al., 2001). About 4-8% of GGE patients have a family history of epilepsy, with most affected relatives having GGE as well (Callenbach et al., 1998; Bianchi et al., 2003).
Furthermore, offspring of GGE patients is reported to be three times more likely affected than expected by population incidence rates, with a recurrence risk of 4- 10% in siblings (Ottman et al., 1989; Bianchi et al., 2003). Several twin studies showed high concordance rates of generalized epilepsy phenotypes in monozygotic
Figure 1-2 | Overlap of the complex phenotypes of most common genetic generalized epilepsies (modified from Janz et al., 1997; Crunelli and Leresche, 2002).
twins (concordance rate of 0.65-0.82 in MZ and 0.12-0.26 in DZ), suggesting the strong influence of syndrome-specific susceptibility genes in the etiology of epilepsy (Berkovic et al., 1998; Kjeldsen et al., 2003). On the contrary, extensive family studies found high phenotype variability within pedigrees (Scheffer and Berkovic, 1997; Ottman et al., 1998). Concordance rates in families with myoclonic and/or absence seizure of 58-65% with seizure types led to the conclusion, that some genes confer susceptibility to only one specific GGE syndrome, while others contribute to a broader range of phenotypes (Winawer et al., 2002, 2005).
To date, the best characterized genes in GGE are EFHC1 (myoclonin-1), GABRA1 (gamma-aminobutyric acid (GABA) A receptor, alpha 1 subunit), GABRG2 (gamma- aminobutyric acid (GABA) A receptor, gamma 2 subunit), CACNA1A (calcium channel, voltage-dependent, P/Q type, alpha 1A subunit), CACNB4 (calcium channel, voltage-dependent, beta 4 subunit) and SLC2A1 (solute carrier family 2 (facilitated glucose transporter), member 1) (Pandolfo, 2011).
EFHC1 encodes for a calcium binding protein and is supposed to be involved in regulating cell division and neuronal migration during cortical development (de Nijs et al., 2009; Léon et al., 2010) and EFHC1 mutations were found co-segregating in unrelated families with JME (Suzuki et al., 2004). Disruption of EFHC1 causes subtle malformations occurring in cortical and subcortical development associated with JME (de Nijs et al., 2009, 2012; Wong, 2010).
GABAA receptor function was expected to play a role in epileptogenesis for a long time, because of its key function as in inhibitory synaptic neurotransmission (Olsen et al., 1999). The first genetic evidence was a GBARG2 mutation in a family with generalized epilepsy with febrile seizures (FS) (Baulac et al., 2001). Additional GBARG2 mutations were later reported in patients with CAE (Wallace et al., 2001;
Crunelli and Leresche, 2002), followed by a report of a GABRA1 mutation in family members with JME (Cossette et al., 2002). Both mutations of GABRA1 and GBARG2 has been found in families with different phenotypes including CAE, CAE with FS and generalized epilepsy with febrile seizures plus (GEFS+) (Crunelli and Leresche, 2002; Lachance-Touchette et al., 2011). Other GABAA receptor subunit mutations in GABRB3 and GABRD have been identified in diverging epilepsy phenotypes as well
(Macdonald et al., 2010), highlighting the strong impact of the GABAA receptor genes in epileptogenesis.
Genes of the voltage-dependent calcium channel complex proteins were identified in GGE syndromes. The effect of CACNB4 mutations were described in mice and in families with heterogeneous GGE phenotypes, respectively CAE with JME and GTCS, JME with GTCS, and ataxia (Escayg et al., 2000). Similarly, mutations in CACNA1A were found in patients with CAE and ataxia (Jouvenceau et al., 2001).
Several other mutations in ion channel genes were described for GGE subtypes that are not included in this study, appreciable mutations in KCNQ2 and KCNQ3 in benign familial neonatal convulsions and SCN1A, SCN2A, SCN1B mutations in GEFS+ and Dravet syndrome (Claes et al., 2001; Gardiner, 2005).
An important non-ion channel gene to the etiology of GGE is SLC2A1, encoding the GLUT1 glucose transporter. Mutations altering gene function have been detected in patients with early-onset absence epilepsy (Suls et al., 2009). Again, SLC2A1 shows a phenotypic spectrum besides GGE, including epileptic encephalopathy, GTCS as well as absence, myoclonic and atonic seizures associated with generalized spike-wave on EEG (Harkin et al., 2007; Mullen et al., 2011).
While the dogma of epilepsy in general as a channelopathy is put aside, newly discovered genes illustrate the importance of unstudied pathways in the etiology of epilepsy (Turnbull et al., 2005; Greenberg and Subaran, 2011; Poduri and Lowenstein, 2011b). As part of the GABA synthesis pathway, the genome-coded mitochondrial enzyme ME2 is strongly suggested to be predisposing to GGE (Pal et al., 2003). Accordingly, association with the BRD2 gene locus could be identified in patients with JME, although gene function is yet unknown (Pal et al., 2003). Other reports introduce other novel risk factors, for instance ARX to absence seizures and GTCS (Marsh et al., 2009), STXBP1 to genetic subtypes of Ohtahara syndrome (Saitsu et al., 2008), PNKP to a previously unknown syndrome (microcephaly, early-onset, intractable seizures and developmental delay, MCSZ) (Shen et al., 2010) and PCDH19 to epilepsy and mental retardation limited to females (Dibbens et al., 2008).
In most cases the relation between mutation and epilepsy phenotype is unclear, hindered by genetic heterogeneity with variable expressivity, emphasizing the
importance of genetic background to specific epilepsy phenotypes (Reid et al., 2009). Hence most epilepsy patients have no affected relatives, a genetically complex etiology for the majority of all epilepsies is most likely, with multiple genes of moderate effect contributing to disease risk and clinical outcome (Ottman, 2005;
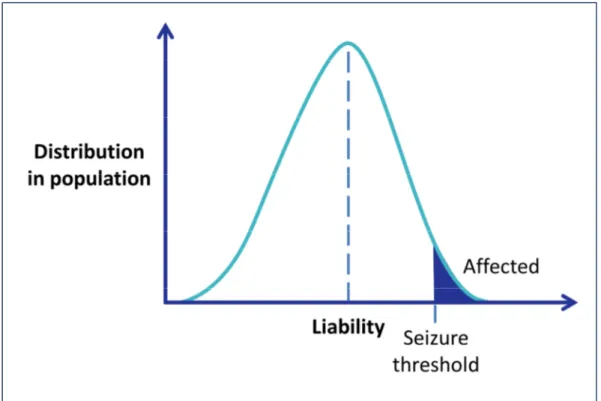
Johnson, 2011). This assumption favors the model of a polygenic and multifactorial etiology of common epilepsy syndromes, with multiple genes and environmental factors involved (Figure 1-3).
Genome wide linkage and association studies have reported a number of different loci for GGEs. Early linkage mapping studies found evidence for susceptibility loci on chromosomes 2q36, 6p21, 14q23 and 20q13 (Sander, 1996; Sander et al., 2000).
Association was found both in CACNA1A and CACNA1H, supporting the findings in Mendelian epilepsies (Chioza et al., 2001; Vitko et al., 2005). A recently published linkage study identified a novel risk loci at 5q34, close to several genes of the GABAA
receptor (GABRB2, GABRA6, GABRA1, GABRG2) (EPICURE Consortium et al., 2012b), and consenting evidence of prior reported susceptibility loci at 2q34 (Ratnapriya et
Figure 1-3 | Multifactorial-polygenic model of disease. Liability, an immeasurable quantitative trait, is normally distributed in the population. Individuals with liability above a threshold value are affected. With epilepsy, the threshold could be conceived of as a seizure threshold. Modified from Ottman et al., 2005.
al., 2010) and 13q31.3 (Tauer et al., 2005; Hempelmann et al., 2006). Replication in independent families/cohorts usually failed and no ‘common epilepsy genes’ could be identified (Mulley et al., 2005).
Association studies of candidate genes are based on the ‘common disease, common variant’ model (CDCV), assuming that common variations with moderate effect contribute to disease risk. The validity of this model was disputed after more than 50 studies without consisting results (Tan et al., 2004). In contrast, the ‘common disease, rare variant’ (CDRV) model, with rare variants with strong effects on disease outcome, was considered to be more fitting to complex epilepsy (Mulley et al., 2005). Besides, inadequate study designs might have contributed to the lack of success in epilepsy research (Kasperaviciūte et al., 2010; Tan and Berkovic, 2010;
Heinzen et al., 2012). Nonetheless, the identification of indisputable genetic risk factors warrant further association studies (Pandolfo, 2011; Hildebrand et al., 2013).
Association studies in Chinese population identified variants in CACNA1H for CAE (Liang et al., 2007) as well as CAMSAP1L1 and GRIK2 for general epilepsy (Guo et al., 2012). The to date largest GWAS in European population has found significant association in Linkage Disequilibrium (LD) blocks, including VRK2 and PNPO as potent candidate genes, as well as genetic susceptibility in SCN1A for GGE in general, as well as susceptibility alleles in ZEB2 for GAE, CHRM3 for JME (EPICURE Consortium et al., 2012a).
In the same way, gene-gene interactions and modifiers are important factors for epileptogenesis. As an example, combinations of mild phenotype alleles can result in a severe clinical phenotype (Reid et al., 2009). Mouse models have demonstrated the effect of gene-gene interactions (Kearney et al., 2006), as well as the impact of protective and modifier variants (Kim et al., 2001; Glasscock et al., 2007; Martin et al., 2007c; Jorge et al., 2011).
1.4 Structural genomic variations in human disease
Although pathogenic structural genomic variations are known for quite some time (given the 15q11-13 deletion and duplication syndromes as a prominent example) (Butler et al., 1986; Bundey et al., 1994), investigation was often difficult and limited to large structural variations with severe effects. Due to technological advances the
understanding of this variations, especially duplications and deletions that are collectively called Copy Number Variations (CNVs), has made huge progress. First databases were established in 2004 (Iafrate et al., 2004), soon followed by a better understanding of the underlying genetic framework of CNVs (Sebat et al., 2004;
Tuzun et al., 2005). Despite as assumed before, further mapping approaches showed that CNVs are not rare events, but are far more common than expected (Redon et al., 2006). CNVs contribute more to genomic diversity than any other genomic variation previously discovered (Redon et al., 2006; Korbel et al., 2007; Stranger et al., 2007).
Great efforts have been made to reveal the mechanisms underlying genomic rearrangements (Sebat et al., 2004; Tuzun et al., 2005), identifying three major principles that may cause CNVs (Gu et al., 2008). Regions with low-copy repeats (LCRs) can mediate non-allelic homologous recombination (NAHR) events. NAHRs mostly account for recurrent CNVs, which share the same breakpoint positions and sizes, resulting in almost identical events in multiple individuals. Non-recurrent CNVs, that may be stimulated by LCRs, do not share the same breakpoints or size, but still may show some overlap or redundant core regions in different samples. In rare cases, no-recurrent NAHRs may be caused as well by highly homologous repetitive sequences like Alu or LINE elements (Gu et al., 2008; Slavotinek, 2008).
Non-recurrent CNVs may as well be caused by non-homologous end-joining (NHEJ), which occurs during DNA double-strand break repair. NHEJ may lead to modification of broken DNA strands to allow for ligation of the breakpoints, that may add or delete several base pairs (Gu et al., 2008).
Other non-recurrent events may be mediated by replication Fork Stalling and Template Switching (FoSTeS) (Lee et al., 2007; Gu et al., 2008). During DNA replication, the replication fork may pause, the lagging strand disconnecting from the template and annealing to another replication fork due to microhomology. The replication would then continue at the new position, creating a duplication by switching to an upstream replication fork, or a deletion by switching to a downstream position. The orientation of the replication fork may cause inversions in addition any may occur several times in a row.
Large CNVs may encompass a high number of genes, without any apparent phenotype (Iafrate et al., 2004; Sebat et al., 2004; Redon et al., 2006). On the contrary, CNVs may affect gene functions in different ways (Cook and Scherer, 2008), commonly considered as changes in gene dosage or expression (Gu and Lupski, 2009; Itsara et al., 2009). Pathogenic CNVs that are too small to be detected with conventional cytogenic methods, but are above level of InDel-variants, are called microdeletions or microduplications vice versa. The simplest scenario is the deletion or disruption of one or more genes, which result in a functional loss. A microdeletion may lead to haploinsufficiency, unmasking pathogenic recessive mutations on the remaining homologues segment that have been silent in previous generations. Furthermore, regulatory elements may be disrupted or deleted, fusion genes can be generated at CNV breakpoints and lead to a gain-of-function mutation, or positional effects may influence gene expression of more distant genes unaffected by any CNV (Lupski and Stankiewicz, 2005; Feuk et al., 2006). Even a “two-hit”
model of additional pathogenic CNVs contributing to a phenotype is conceivable (Girirajan et al., 2010, 2012). Pathogenic genomic duplications appear to be less common and seem to develop less severe phenotypes than microdeletions, although they might be under-diagnosed so far (Cook and Scherer, 2008; Slavotinek, 2008).
Since only a limited number of rare CNVs have been successfully associated with disease, it is most likely that considerable amount of rare CNVs account for the
‘common disease-rare variant’ hypothesis (Itsara et al., 2009).
1.5 Genomic microdeletions in genetic generalized epilepsy
The first pathogenic CNV locus that was associated with GGE was a recurrent microdeletion at 15q13.3, which was found in 12 of 1,223 and none of 3,699 controls (Helbig et al., 2009). Despite being the first CNV associated with GGE, this microdeletion is still the most prevalent risk factor for common epilepsies. The reported 15q13.3 microdeletion has been reported before in association with mental retardation and seizures (Sharp et al., 2008), and schizophrenia (Schizophrenia Consortium, 2008; Stefansson et al., 2008). Following studies emphasized the pathogenicity of the reported microdeletion (Dibbens et al., 2009) and highlighted its phenotypic variability (Miller et al., 2009; Pagnamenta et al., 2009).
Association with GGE was subsequently detected with microdeletions at 15q11.2 and 16p13.1 (de Kovel et al., 2010), both microdeletions previously reported in neuropsychiatric disorders; microdeletions at 15q11.2 associated with schizophrenia (Stefansson et al., 2008; Kirov et al., 2009; Need et al., 2009), microdeletions at 16p13.11 associated with autism spectrum disorder (Sebat et al., 2007; Ullmann et al., 2007), mental retardation (Ullmann et al., 2007; Hannes et al., 2009), and with schizophrenia (Need et al., 2009). In addition, microdeletions at 1q21.1 previously reported in schizophrenia and mental retardation (Brunetti-Pierri et al., 2008; Mefford et al., 2008; Schizophrenia Consortium, 2008; Stefansson et al., 2008; Need et al., 2009), microdeletions at 16p11.2 identified in autism and mental retardation (Sebat et al., 2007; Kumar et al., 2008; Marshall et al., 2008; Weiss et al., 2008), and microdeletions at 22q11.1 associated with schizophrenia, mental retardation and autism (Bassett et al., 2008; Schizophrenia Consortium, 2008; Kirov et al., 2009; Need et al., 2009), showed some suggestive evidence, but no association with GGE. Altogether, CNVs associated with GGE collectively explain a larger portion of the genetic variance epilepsy syndromes than any single gene (de Kovel et al., 2010; Poduri and Lowenstein, 2011b).
Recurrent microdeletions associated with genomic disorders share similar mechanisms and structures and are mostly mediated by NAHR (Mefford and Eichler, 2009), although they show a high variability in phenotypes (Mefford et al., 2010).
Therefore other risk factors, environmental and genetic modifiers are likely to contribute to the outcome of disease (Mefford and Eichler, 2009; Mefford and Mulley, 2010).
In addition, smaller structural aberrations have been reported that only affect single genes or only single exons. Deletions in NRXN1 have been associated with a broad spectrum of neurodevelopmental and psychiatric disorders including schizophrenia, autism spectrum disorder, and intellectual disability (Kirov et al., 2009; Rujescu et al., 2009; Ching et al., 2010). In some cases, comorbidity of epilepsy was reported (Ching et al., 2010; Gregor et al., 2011) and compound NRXN1 mutations combining heterozygous exonic microdeletions and nonsense or splice-site mutations have been described in individuals with severe early onset epilepsy and mental retardation (Harrison et al., 2011; Duong et al., 2012). Neurexins are neuronal
adhesion molecules, required for synaptic contacts and efficient neurotransmission in the brain. They are located in the presynaptic terminal where they interact with postsynaptic neuroligins to form a transsynaptic complex (Südhof, 2008).
Structural variations disrupting the gene encoding the neuronal splicing regulator RBFOX1 have been reported in three patients exhibiting epilepsy in comorbidity with autism, intellectual disability, or pontocerebellar hypoplasia (Bhalla et al., 2004; Martin et al., 2007a; Gallant et al., 2011). Additionally, a linkage locus for photoparoxysmal response in GGE families has been mapped to the genomic region of RBFOX1 at 16p13.3 (Pinto et al., 2005). RBFOX1 is a splicing regulator gene, involved in the splicing of many neuronal transcripts, binding the sequence (U)GCAUG in introns flanking alternative exons (Jin et al., 2003; Auweter et al., 2006;
Voineagu et al., 2011; Fogel et al., 2012). It is crucial for regulation of neuronal excitation and has a notably impact on susceptibility of epilepsy (Gehman et al., 2011; Voineagu et al., 2011), as several target transcripts of RBFOX1 (for example, DCX, GABRG2, GAD2, GRIN1, KCNQ2, SCN8A, SLC12A5, SNAP25, SV2B, and SYN1) are correlated with epileptogenesis (Barnby et al., 2005; Corradini et al., 2009; Papale et al., 2009; Pandolfo, 2011; Fogel et al., 2012; Veeramah et al., 2012). Brain-specific homozygous and heterozygous Rbfox1 knockouts in mice do not alter brain morphology, but show differentially spliced RNA transcripts and display spontaneous seizures and a dramatic epileptogenic response to kainic acid resulting in status epilepticus (Gehman et al., 2011). Consequently, RNA interference–
mediated 50% knockdown of RBFOX1 transcripts in human neurons changes the alternative splicing pattern and expression of primarily neuronal genes involved in synapse formation and function (Voineagu et al., 2011; Fogel et al., 2012).
1.6 Objectives
This study was aimed at the identification of novel genomic loci associated with common GGE syndromes. To achieve this goal, two strategies for identifying genetic factors underlying complex disease were pursued:
i) GWAS meta-analyses of two primary GWAS GGE data sets comprising a GGE case- control cohort and a family-based study group. In addition to the global analysis, phenotypically distinct GGE subgroups, such as genetic absence epilepsies (GAE,
comprising CAE and JAE) and juvenile myoclonic epilepsies (JME), were to be analyzed separately to distinguish genetic factors, which may differentially predispose to particular GGE subtypes.
ii) candidate variant/gene testing to investigate the impact of structural microdeletions on the etiology of common genetic epilepsies. Large recurrent microdeletions previously reported in neuropsychiatric disease were to be analyzed to detect association with GGE. Additionally, two potential candidate genes for GGE (NRXN1, RBFO1) were to be screened for exonic microdeletions to identify novel risk factors for epileptogenesis.
2 Methods and Materials
2.1 Study Participants
Epilepsy patients of European ancestry with common GGE syndromes (GAE with age-at-onset 3-20 years, JME with age-at-onset 6-20 years and EGTCS alone with age-at-onset 8-30 years) were recruited in a multi-center effort from the European EPICURE Project (http://www.epicureproject.eu). Phenotyping and diagnostic classification of GGE syndromes were carried out according to EPICURE guidelines and standardized phenotyping protocols (http://portal.ccg.uni-koeln.de/ccg/
research/epilepsy-genetics/sampling-procedure/) (ILAE, 1989; Nordli, 2005; Berg et al., 2010). All study participants gave informed consent according to the regulations at their local institutional review boards. Individuals with a history of major psychiatric disorders (autism spectrum disorder, schizophrenia and affective disorder) or severe intellectual disability were excluded.
Two independent, unrelated sample cohorts were available for analysis. First, a case-control study cohort consisting of 1,569 unrelated GGE cases of European ancestry (600 males, 969 females; Austria, n = 197; Belgium, n = 53; Denmark, n = 95; Germany, n = 933; and The Netherlands, n = 291) and 6,201 German controls (3,142 males, 3,059 females). The epilepsy patients comprised the following GGE syndromes: 693 GAE, 625 JME, and 251 patients with EGTCS alone. The control cohort of 6,201 unscreened German controls were collected from Southern (PopGen, n = 1,625) (Wichmann et al., 2005), Northern (KORA, n = 1,163) (Krawczak et al., 2006), and North-Eastern (SHIP, n = 3,413) (Völzke et al., 2011) regions of Germany.
In addition, 566 parent-offspring trios of European origin with children affected by GGE were available for family-based association analysis (216 male trio children, 350 females). Trios were recruited from Australia (n = 98), Austria (n = 3), Bulgaria (n=4), Denmark (n = 20), Finland (n=1), France (n=16), Germany (n = 15), Italy (n = 272), Spain (n=4), and Turkey (n = 133). The trio sample cohort contained following syndromes: 317 GAE, 157 JME, and 92 trios with EGTCS alone.
2.2 Array-based SNP genotyping
Microarrays for SNP genotyping usually have a similar design. An acryl or glass surface is carrying a large number of unique oligomer probes that are specific to a defined position on the genome, for example a SNP or a copy number region. Large groups of unique probes are forming so called features on the array surface. Sample DNA is amplified, fragmented and hybridized to complementary probes on the array surface. DNA fragments are stained with fluorescent nucleotides and/or with fluorescent antibodies. A laser based imaging system is used to collect fluorescent signals. Genotypes can be distinguished by the position of the signal, corresponding to the position of a probe feature, by signal intensity and by color if a two colored assay is used. Imaging data can now be analyzed by the software provided by the array manufacturer and is transformed into genotype, copy number or other applicable data.
2.2.1 DNA preparation and quality control
All DNA samples provided by the participating centers were quantified using the NanoDrop 1000 photometer (NanoDrop products, Wilmington, DE, USA) and the presence of high-molecular weight genomic DNA was examined by gel electrophoresis on 1%-agarose gels. DNA samples exhibiting a high degree of degradation (no distinct fragment band > 10 kb) were excluded from the experimental investigations.
2.2.2 SNP genotyping using the Affymetrix Genome-Wide SNP Array 6.0
The Affymetrix Genome-Wide Human SNP Array 6.0 (Affymetrix, Santa Clara, CA, USA) offers oligonucleotide probe features for 1.8 million specific genetic markers.
Of those, more than 906,600 account for SNPs and 946,000 for non-polymorphic probes to detect copy number variations (CNVs). A total of 500 ng high quality genomic DNA is split in two aliquots and digested in parallel with two restriction enzymes (Nsp and Sty). The fragments are ligated to adaptors that recognize the cohesive 4 bp restriction overhangs. A generic primer that recognizes the adaptor sequence is used to amplify DNA fragments by Polymerase Chain Reaction (PCR) (Kennedy et al., 2003). PCR conditions have been optimized to preferentially amplify fragments in the 200 to 1,100 bp size range. PCR amplification products for each
restriction enzyme digest are combined and purified using polystyrene beads. The amplified DNA is then fragmented, labeled, and hybridized to a SNP6.0 microarray (Matsuzaki et al., 2004). After ligation, the arrays are stained and imaged.
Raw data analysis and genotyping is performed by the Affymetrix Genotyping Console software (Affymetrix, Santa Clara, CA, USA). Raw data analysis is required to assure sufficient quality of the processed arrays, by evaluation of probe set signal intensity. Signal intensity is crucial for correct genotype calling. On the Affymetrix SNP6.0 array, the contrast QC value (cQC) represents the distribution of signal intensities for subset of representative SNPs. The same accounts for Nsp and Sty specific values, cQC-Nsp and cQC-Sty. Samples with any cQC value ≤ 0.4 have been excluded due to expected low raw signal quality. Genotyping is performed after filtering for quality of raw signal intensities.
SNP genotyping is performed using the Birdseed algorithm (Korn et al., 2008), integrated in the Affymetrix Genotyping Console. Birdseed uses a customized (EM) algorithm to fit two-dimensional Gaussians to SNP data, producing genotypes and confidence scores for every individual at every SNP.
2.2.3 SNP genotyping using the Affymetrix Axiom® Genome-Wide SNP array
The Affymetrix Axiom® Genome-Wide HU genotyping array (Affymetrix, Santa Clara, CA, USA) is a two color, ligation-based assay utilizing 30-mer oligonucleotide probes synthesized in situ on a microarray substrate, with automated, parallel processing of 96 samples per plate (Hoffmann et al., 2011). The Axiom® Genome-Wide Reagent v1 array used in this study is carrying specific probe features for 567,096 SNPs. An amount of 200 ng high quality DNA is amplified by Whole Genome Amplification and digested by restriction Enzyme into fragments of 25-125 bp in size. DNA fragments form a probe-target complex on the array surface and are hybridized with SNP-site specific probes and ligated for specificity. Arrays are washed, stained and imaged after ligation.
Raw data analysis is performed by the Affymetrix Genotyping Console software, similar to the Affymetrix SNP6.0 array. For evaluation of signal intensities of the Axiom® Genome-Wide array, the corresponding value is called DishQC.
Manufacturer’s threshold for sample exclusion is specified at ≤ 0.82, although the
given threshold is not definitive. For the Axiom® array, samples with a marginal DishQC values have been genotyped and excluded on account of the Call Rate (CR) per sample.
Genotyping is performed after filtering for quality of raw signal intensities by the Affymetrix Genotyping Console software, using the Birdseed algorithm (Korn et al., 2008).
2.3 Genome-wide association studies
2.3.1 Array and SNP and quality control
SNP microarray data required extensive quality control (QC) to ensure high data quality and to avoid formation of artifacts during imputing. Only samples with sufficient signal intensity ratio were used for further QC filtering (see 2.2.2, 2.2.3).
Samples with CR < 95%, and excessive heterozygosity rate of autosomal SNPs >
29.5%, were excluded from analysis. Unsuccessful gender assignment led to exclusion of the sample as contamination or bad sample quality was expected.
Remaining samples were genotyped again to improve cluster distribution of the high quality samples.
Within the family-based data set, trio pedigree structure and relationship of all trio members was checked with PedigreeExplorer (Steffens 2007; Institute for Medical Biometry, Informatics and Epidemiology (IMBIE) of the "Medizinische Einrichtungen der Universität Bonn", Bonn, Germany; http://pedigreeexplorer.
meb.uni-bonn.de/) and by IBD-estimation in PLINK (Purcell et al., 2007;
http://pngu.mgh.harvard.edu/purcell/plink/). Based on this information, pedigree structure and sample permutations were corrected if possible or pedigrees excluded if necessary.
SNPs with high genotyping accuracy were selected for SNP imputation according to the following QC criteria, with respect to the sample cohort and array type.
Affymetrix SNP6.0 QC criteria: i) minor allele frequency (MAF) < 5% in cases or controls, ii) CR < 98% for SNPs with MAF > 10% and CR < 99% for SNPs with MAF <
10% in either cases or controls, ii) difference of missing data >1% between the cases and controls, iv) deviation from the Hardy–Weinberg equilibrium (HWE) with P <
1.0 × 10⁻⁴ in the controls. Affymetrix Axiom QC criteria: i) MAF < 5%, ii) CR < 95%, iii) HWE with P < 1.0 × 10⁻⁶, Mendelian error rate > 5% with remaining Mendelian errors set to missing.
2.3.2 Principal component analysis
A study cohort with samples from different populations may be prone to effects by reason of differing SNP allele frequencies in those populations, called population stratification. Population stratification may occur due to geographical and cultural barriers that lead to discrete mutation, selection and genetic drift in separated populations. Thereby the founding of subpopulations is likely. Subpopulations can often be distinguished as ethnic groups, but further stratification may be hidden beneath an obvious superstructure. Those groups may differ crucial in their allele frequencies for genetic variations. As association analysis statistics are based on the comparison of differing allele frequencies, distinct origins in samples and especially between cases and controls may lead to false-positive results (Thomas and Witte, 2002). In this case, association would display the difference between populations and no association with disease.
Existing genome-wide SNP genotypes can be used to detect and correct for population stratification. Established methods are principal component analysis (PCA) and multidimensional scaling (MDS). As both methods yield comparable results (Wang et al., 2009) and genetic and geographical distances are well correlated in European populations, we decided to perform a PCA analysis with the EIGENSTRAT v3.0 software (Patterson et al., 2006; Price et al., 2006). The principle used by both methods is the summarization of available data (i.e. genotype information of a sample cohort) in principal components (PCA) or dimensions (MDS). Those are sorted by their amount of variance and correlated. The first dimensions are carrying the mayor information about the sample, with later dimensions tending towards 0. To assure that true population effects are explored, a high quality data set (SNP quality filters: CR > 0.99, MAF > 0.15, HWE with P > 10-3) is created with exclusion of markers in tight Linkage Disequilibrium (LD; r2> 0.1), markers that are located in known regions of long range LD patterns (Suppl. 6-2) and common inversion polymorphisms.
2.3.3 SNP imputing
Imputing is a useful multipoint method that can detect causal variants that have not been directly genotyped by, for example, SNP-based DNA microarrays (Marchini et al., 2007). This approach improves statistical power of association analysis by predicting unobserved SNP genotypes using existing catalogs of variation and known haplotypes, such as the HapMap project (Altshuler et al., 2010) and the 1000genomes project (Abecasis et al., 2012), as a reference panel. Equally important, imputation is an indispensable step for later meta-analysis, if studies based on different genotyping methods or arrays are combined. Different genotyping arrays only have a fraction of their SNPs overlapping in general. The reduction of a joined data set is avoided by imputing to a much larger marker set with a considerably increased marker overlap.
Figure 2-1 | Plot of principal components 1 and 2 from PCA. Exemplary data plotted of principal components with largest effect in PCA. Cases in red, controls in black.
Imputation in this study was accomplished using IMPUTE v2 (http://mathgen.stats.ox.ac.uk/impute/impute_v2.html) (Howie et al., 2009), a method that uses a Markov chain Monte Carlo (MCMC) framework to predict untyped SNPs by combining a reference panel of individuals genotyped at a dense set of SNPs with a study sample collected from a genetically similar population and genotyped at a subset of these sites. The approach is based on an approximate population genetics model that gives more weight to genotypes that are consistent with the local patterns of LD. This approach uses information from all markers in LD with an untyped SNP, decreasing with genetic distance from the SNP being imputed (Marchini et al., 2007). The SNPTEST v2 software was used to calculate frequentist and bayesian tests used for quality filtering of SNP markers (Marchini et al., 2007).
SNP markers were filtered for minor allele frequency, proportion of missing genotypes, and info score. The info score is a measure of the observed statistical information for the estimate of allele frequency of a SNP. All individuals in the sample are used to test each SNP with a maximum value of 1 for perfect information.
Figure 2-2 | Simplified procedure of imputing (modified from Marchini et al., 2007, https://mathgen.stats.ox.ac.uk/impute/impute_v1.html)
Quality control of imputed data
Imputed SNP genotypes were quality filtered again to maintain a high quality data set. Quality filtering of imputed data done with IMPUTE dosage data using SNPTEST v2 (Marchini et al., 2007). SNPs were excluded from further analysis according the following QC criteria: i) SNPtest info quality value < 0.9, ii) MAF < 3% (for cases and controls separately in the case-control cohort), iii) missing data proportion > 1%, iv) HWE deviation with P < 10-6 (in the case-control cohort, with P < 10-6 in the cases and P <10-4 in the controls).
Imputing of Affymetrix SNP 6.0 array case-control data
After SNP genotyping, the quality filtered data set consisted of 1523 cases and 2454 controls (579 males, 944 females; cases with 705 GAE, 579 with JME, and 239 with EGCTS alone) with 572,071 SNP markers. The data set was imputed using IMPUTE v2, based on the reference panel: 1000 Genomes Phase I (interim) release in NCBI build 37 (hg19) coordinate (update 05 Mar 2012) by Dr. Carolien deKovel at the Department of Medical Genetics, Section Complex Genetics, University Medical Center Utrecht, The Netherlands. Imputed data was transferred to Cologne for further QC and association analysis. The final data set consisted of 5, 564,553 SNPs after post-imputing QC.
Imputing of Affymetrix Axiom® SNP array trio data
The quality filtered data set consisted of 566 trios and 553,012 SNP markers after SNP genotyping. The data set was imputed using IMPUTE v2, based on the reference panel 1000 Genomes Phase I (interim) release in NCBI build 37 (hg19) coordinate (update 19 Apr 2012) by Dr. Markus Leber at the IMBIE of the "Medizinische Einrichtungen der Universität Bonn", Bonn, Germany. Imputed data was transferred to Cologne for further QC and analysis. The final data set consisted of 5,776,102 SNPs after post-imputing QC.