23
Logistik und Supply Chain ManagementMobility in a Globalised World 2019
Jan Werner, Niels Biethahn, Reinhard Kolke, Eric Sucky, Wilfried Honekamp (Hg.)
Band 23
2020
Herausgegeben von Prof. Dr. Eric Sucky
2020 Jan Werner, Niels Biethahn, Reinhard Kolke, Eric Sucky, Wilfried Honekamp (Hg.)
Deutschen Nationalbibliographie; detaillierte bibliographische Informationen sind im Internet über http://dnb.d-nb.de/ abrufbar.
Das Werk ist als freie Onlineversion über das Forschungsinformationssystem (FIS; fis.uni-bamberg.de) der Universität Bamberg erreichbar. Das Werk – ausge- nommen Cover, Zitate und Abbildungen – steht unter der CC-Lizenz CC-BY.
Lizenzvertrag: Creative Commons Namensnennung 4.0 http://creativecommons.org/licenses/by/4.0
Herstellung und Druck: docupoint, Magdeburg Umschlaggestaltung: University of Bamberg Press
© University of Bamberg Press, Bamberg 2020 http://www.uni-bamberg.de/ubp/
ISSN: 2191-2424
ISBN: 978-3-86309-731-8 (Druckausgabe) eISBN: 978-3-86309-732-5 (Online-Ausgabe) URN: urn:nbn:de:bvb:473-irb-476706
DOI: http://dx.doi.org/10.20378/irb-47670
Logistik und Supply Chain Management
Herausgegeben von
Prof. Dr. Eric Sucky
Kontakt
Univ.-Prof. Dr. Eric Sucky, Otto-Friedrich-Universität Bamberg, Lehrstuhl für BWL, insb. Produktion und Logistik,
Feldkirchenstr. 21, 96052 Bamberg
Das erfolgreiche Management sowohl unternehmensinterner als auch unternehmensübergrei- fender Wertschöpfungsprozesse, Wertschöpfungsketten und ganzer Wertschöpfungsnetzwerke basiert im Besonderen auf dem zielgerichteten Einsatz von bestehenden und weiterentwickel- ten Methoden und Konzepten des Produktions- und Logistikmanagements sowie des Operati- ons Research, dem Einsatz von innovativen Informations- und Kommunikationstechnologien sowie theoretischen und praktischen Erkenntnissen des Kooperationsmanagements. Die Schrif- tenreihe dient der Veröffentlichung neuer Forschungsergebnisse auf den Gebieten Logistik und Supply Chain Management. Aufgenommen werden Publikationen, die einen Beitrag zum wis- senschaftlichen Fortschritt in Logistik und Supply Chain Management liefern.
Mobility in a
Globalised World 2019
The term mobility has different meanings in the following science disciplines. In eco- nomics, mobility is the ability of an individual or a group to improve their economic status in relation to income and wealth within their lifetime or between generations.
In information systems and computer science, mobility is used for the concept of mobile computing, in which a computer is transported by a person during normal use.
Logistics creates by the design of logistics networks the infrastructure for the mobility of people and goods. Electric mobility is one of today’s solutions from an engineering perspective to reduce the need of energy resources and environmental impact. More- over, for urban planning, mobility is the crunch question about how to optimise the different needs for mobility and how to link different transportation systems.
In this publication we collected the ideas of practitioners, researchers, and govern- ment officials regarding the different modes of mobility in a globalised world, focus- ing on both domestic and international issues.
Eric Sucky received his PhD from the School of Economics and Business Administration at the Johann Wolfgang Goethe Uni- versity Frankfurt, Germany. Currently, he is Professor of Oper- ations Management and Logistics at the University of Bamberg, Germany.
Reinhard Kolke holds a PhD in engineering from the mechani- cal engineering faculty at Otto-von-Guericke University in Magdeburg, Germany. In 2007, he became the Director of ADAC’s strategic business unit Test and Technical Services.
Furthermore, he is a Director in the Euro NCAP Board and cur- rently chairman of the FIA Technical Working Group of the European Automobile Clubs. 2012 – 2016 he also became a Professor for Automotive Technology Management at the Busi- ness and Information Technology School, Iserlohn. Currently he gives lectures at the University of Applied Science in Kempten.
Univ.-Prof. Dr.
Eric Sucky
Dr.-Ing. Reinhard Kolke
sitions in business consultancy, he significantly contributed to a restructuring process for a medium-sized automobile supplier as its Commercial Managing Director. Since 2009, he has been a lecturer, starting at the Business and Information Technology School in Iserlohn. He has been a professor at the DHBW Heil- bronn since September 2018 and is responsible for the degree course Service Management - Service and Sales - Automotive there. Additional to his task as a professor he is one of the founders of the “Institut für Automobil Forschung” in Dort- mund. Moreover, he is one of the owners of the CoCos man- agement simulation.
Jan Werner holds a PhD in Economics from the Johann Wolf- gang Goethe University in Frankfurt, Germany. He has worked inter alia for the World Bank, UNDP, the Asian Development Bank, the European Parliament and the GIZ. He was a Guest Professor at the Université Lumière de Lyon 2, France and at the Istanbul Bilgi Universit, Turkey. Currently, he is the Lead Economist at the Institute of Local Public Finance in Langen, Germany as well as Professor of Economics at the Cologne Business School, University of Applied Sciences, Germany.
Wilfried Honekamp has been a professor in applied computer science at the University of Applied Police Sciences of the Academy of Hamburg Police since 2014. His focus areas in teaching and research are cybercrime, computer forensics, IT security, as well as IT systems and procedures of the police. He received a PhD from the Tyrolian University for Health Sci- ences, Medical Informatics and Technology and started his ac- ademic career 2010 as a professor in software engineering and programming at the University of Applied Sciences Zittau/Gör- litz.
Prof. Dr. Niels Biethahn
Prof. Dr. Jan Werner
Prof. Dr.
Wilfried Honekamp
Die zunehmende Verknüpfung von Mobilität und Sicherheitsakten zog sich wie ein roter Faden durch die Panels „Mobility in Computer Science“, „Mobility in Logis- tics“, „Mobility in Engineering“ sowie das doppelt besetzte Panel „Mobility in Urban Economics“ der 9. Mobility in a Globalised World-Konferenz, welche in September 2019 in Hamburg stattfand.
Für die vielen Beiträge, die gleichermaßen exzellent und aktuell waren, danken die Herausgeber allen beteiligten Kolleginnen und Kollegen. Eine internationale Konfe- renz ist immer die Zusammenarbeit vieler Engagierter. All denjenigen, die uns in den verschiedensten Bereichen unterstützt haben, wollen wir danken.
Unser besonderer Dank gilt hierbei der Akademie der Polizei in Hamburg für die Unterstützung und die Bereitstellung der Räumlichkeiten sowie Professorin Kristin Pfeffer, die uns in ihrer Funktion als Dekanin der Akademie der Polizei sehr herzlich begrüßte. Die lokale Ausrichtung durch Profssor Wilfried Honekamp war exzellent und insbesondere der gemütliche „Hamburg Evening“ im Restaurant Waterkant so- wie die eindrucksvolle Führung im Hamburger Polizei Museum bleiben allen Teil- nehmern und Teilnehmerinnen der Konferenz positiv in Erinnerung.
Zu Dank verpflichtet sind wir auch den Mitgliedern des Scientific Committee, die viel Zeit für die Prüfung der eingegangenen Abstracts aufgewendet haben, und den Modulleitern, die für die Ausgestaltung des Programms zuständig waren.
Herzlicher Dank gilt dem Team des Lehrstuhls für BWL, insbesondere Produktion und Logistik an der Universität Bamberg, insbesondere Sophie Kurbjuhn und Vanessa Felch, die in vielen Stunden aus unzähligen Einzelteilen ein druckreifes Ge- samtwerk erstellt haben.
Bamberg, Mai 2020
Jan Werner, Niels Biethahn, Reinhard Kolke, Eric Sucky, Wilfried Honekamp
Die Herausgeber und Unterstützer der MIGW trauern um unseren Freund, Kollegen und wissenschaftlichen Ratgeber Prof. Dr. Volker Busch.
Volker unterstützte und begleitete die MIGW-Konferenzserie von Anfang an. Schon die erste Konferenz im Jahr 2011 wäre ohne seine Hilfe als damaliger Rektor der BiTS-Hochschule nicht zustande gekommen.
Viele Teilnehmerinnen und Teilnehmer hatten im Laufe der Jahre Gelegenheit, wäh- rend der MIGW-Konferenzen die optimistische, kluge und charmante Ausstrahlung von Volker kennenzulernen. In den letzten vier Jahren war er jedes Mal mit einem eigenen Vortrag oder Panel vertreten.
Doch vor allem war er vielen von uns als ein wirklich guter Freund verbunden. Wir werden seinen Humor, seine Ausgeglichenheit und sein großes Herz nie vergessen.
Volker Busch wurde am 10. Dezember 2019 unerwartet aus dem Leben gerissen.
Ohne seine Unterstützung würde es die MIGW heute nicht geben. Daher ist dieser Konferenzband ihm gewidmet.
Jan Werner, Niels Biethahn, Reinhard Kolke, Eric Sucky, Wilfried Honekamp
Mobility in Computer Science ... 1 Wilfried Honekamp, Günter Koch
Simulative Workload Analysis of Police Forces ... 7 Tobias Cors, Kai Hoth, Martin Tschöke, Malte Fliedner, Knut Haase, Wilfried Honekamp
Port Logistic IT Security Monitoring ... 17 Wilfried Honekamp, Lars Damm, Torsten Fokuhl
Risk Analysis of NFC Payment Systems ... 27 Jonathan Reimers, Wilfried Honekamp
Mobility in Urban Economics ... 39 Jan Werner
Local Public Finance in Libya: Learn to Walk before You Run ... 43 Jan Werner
Diffusion einer disruptiven Innovation am Beispiel der E-Mobilität in
Deutschland ... 65 Christian Lucas
The Internationalisation Process of German Enterprises in Brazil ... 81 Mariana Fleischhauer Corrêa da Costa, Jan Werner
Mobility in Logistics & Business Models ... 93 Ivonne Honekamp
Ivonne Honekamp, Liesa Fichtner
Bundesstaatliches Buy-Out – Die Bewegung in der Finanzverfassung bringt den Bundesländern mehr finanzielle Sicherheit ... 107 Florian Kempf
Mobility in Logistics ... 117 Eric Sucky
Stand der empirischen Forschung im Supply Chain Management – Eine
systematische Literaturanalyse ... 121 Larissa Schneider, Eric Sucky
Intralogistik 4.0: Die unternehmensinterne Logistik im Kontext der
Digitalisierung und Industrie 4.0 ... 163 Stefan Motschenbacher, Vanessa Felch
Der prozessuale und technologische Stand von Essenslieferdiensten in
Deutschland – Eine explorative Studie mit zwölf Experteninterviews und zwei Time-Motion-Studien ... 187 Julia Metz, Christian Straubert
Die Akzeptanz webbasierter EDI-Anwendungen durch kleine
Unternehmen ... 225 Andreas Ott, Alexander Dobhan
Mobility in Technology ... 257 Reinhard Kolke
Thomas Willner
Fuels from Waste and Hydrogen – The HAW Hamburg Approach ... 291 Anika Sievers, Thomas Willner
Mobility in
Computer Science
Prof. Dr. Wilfried Honekamp
Academy of Hamburg Police, Carl-Cohn-Straße 39, 22297 Hamburg, wilfried.honekamp@polizei-studium.org
Prof. Günter Koch
Humboldt Cosmos Multiversity, Tenerife, Canary Islands, Spain
Mobility in modern times is almost always accompanied by the application of com- puter science. In relation to this year’s focus on mobility and security, the following three contributions show one commonality: different aspects of organising, exercis- ing and maintaining security in the public space. The scope of the three topics reached from protection of public infrastructure, in concrete the Hamburg Sea Port and its logistics, then switch to the aspect of police force operation planning, and finally ending at the individual level of protection of individuals using near-field communi- cation (NFC) technology in payment systems infrastructure.
A different aspect in applying automated algorithms is presented by Tobias Cors and his co-authors: They describe their approach on how to find an optimal solution in making best use of capacities of police force organised in so-called shifts, in combin- ing a multitude of aspects to be considered as are
district organisation (technically defined by radio areas),
availability of police forces in the districts,
availability of patrol cars,
distances to arrive at a location of incident,
frequency and intensity of occurrences – predictable, e.g. in case of events and by daily profiles, as well as unpredictable caused by random incidents,
type of mission (162 mission causes have been identified), and
mission variances and mission mixes.
The approach taken by the simulation building team is to conceive a simulation solu- tion based on a stochastic process model which includes the following functions in stepwise sequence:
ABC classification of incident = mission cause,
analysing probability of mission occurrence by matching it against profile data available,
travelling time calculated taking into account the resources available as well as using empirical data,
identifying the mission profile fitting to the given case, also using prior cases for comparison, and
documentation effort in the course of finalising a mission.
The simulation program is instantiated by a discrete event simulation model which, for inputs, uses the many different aspects mentioned above and tries to bring them in balance thereby finding the optimum. No question that the “algorithmisation” must be based on rules as have been designed by the programmers versus human-based experience. I.e. the validity of the solution by the simulation developed is to be meas- ured by comparing the prediction made by the simulation program versus the real case. As for now, the predictions by simulation prove to come close to the real cases, however, this comparison also provides hints which parameters need special attention to be adapted. Future improvements are foreseen w.r.t. a) target KPI values making best use of the police force, b) inclusion of heuristics and c) finding best solutions by playing with a variety of capacity plans. As a consequence from this experiment, op- timisation considerations will be started on the organisation and dimensioning of dis- tricts, as well as to find optimal shift plans.
The contribution by Lars Damm and Wilfried Honekamp starts from the widest per- spective addressing the vulnerability of large and complex infrastructures as is the Hamburg Sea Port, Europe’s second largest port after Rotterdam. The Hamburg port logistics is operated by the HHLA (Hamburger Hafen und Logistik AG) and its IT department which covers the operation of the whole process from the container ship, via the container bridge, the container portal crane transport to the storage location and finally to the transfer of the containers to trucks and trains in their specific sta- tions. From a data perspective three dimensions need to be covered which are
workflow data for managing the different processes steering the flow of con- tainers,
allocation data maintaining the consistency between storage location and spe- cific containers, and
business data associated with the contents of containers.
All software and data are run in the HHLA-own system, the HHLA network. Due to the size and complexity of this system there exists a multitude of points of attack for outside intruders which may enter e.g. through web portals or communication con- nections as well as through usual user interfaces. Malware from outside can be infil- trated potentially through mail attachments, mobile data media (e.g. USB flash drive) or by access processes attempting phishing attacks or simply by human operators with doubtful intentions. In consequence the management of the HHLA IT is challenged to monitor and to discover cyberattacks applying a variety of methods as are
general risk analysis,
integrative analysis of data received from end points and sensors,
intelligent combination of recognising different occurrences indicating an at- tack,
identification of risks / attacks by means of artificial intelligence (AI), especially deep learning algorithms usually implemented through neural networks, and
permanent observation of data traffic and identifying abnormalities at the fire- wall interface.
The challenge is not only to apply these different techniques rather than a) to contin- uously build or purchase own intelligent algorithms for recognition and defence of attacks, b) to exchange information with other institutions employed in defending against cyberattacks as are malware defence software producers, internet security ser- vice providers or partnering companies with which complementary insights gained on their side is being exchanged. Acquiring information, data and software for de- fending cyberattacks is a permanent activity operated by HHLA’s IT, i.e. a permanent activity in producing prototype algorithms to be tested in different scenarios and, of course, even more in the case of a current attack. In order to obtain an idea on the dimension of damage produced by a cyberattack, the authors quote cases in which a container transport company had to suffer a decrease in turnover of up to $ 300 Mio.
or cases when drug trafficking using containers remained undiscovered due to ma- nipulations introduced by hackers smuggled into the IT organisation.
A case touching the question of personal risk management is discussed in the paper of Jonathan Reimers and Wilfried Honekamp on the use of near-field communication (NFC) in payment applications, first hand using credit cards. NFC is based on RFID (Radio Frequency Identification) and allows two types of communication
peer-to-peer: two active NFC units communicate actively with each other, and
reader/writer mode: an active NFC unit communicates with a passive one which acts as a transponder.
The second case is the most commonly used application in practice and is best known by using credit cards with an element for touchless communication for payment e.g.
at cashpoints. The point discussed in this paper in respect of security is that the phys- ical radio signal distance between an active reader and a corresponding passive unit can be > 50 cm, however, in practice 30 cm and less are common. Such distance is large enough so that a person with an active reader as could be a smart phone can interfere with the transponder on a credit card.
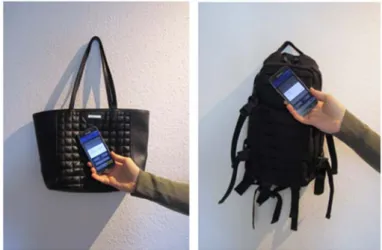
The project reported is about tests reading data from a credit card using a smart phone with an NFC reader function as is available for free as an app (e.g. “Contactless Credit Card Reader”). The number of tests under each condition were 100 and the objective
was, if and how much and which data could be read from a corresponding transponder on a credit card under different physical circumstances. In the different conditions in the test series it turned out, that a single credit card with transponder function could be read with success at ~ 80% if loosely carried e.g. in a jeans or jacket or backpack pocket. Success in building communication goes down at < 25% if carried in a leather bag and is 0% when protected by an aluminium foil or a special protection box.
The paper describes which data can be extracted from a credit card and how this data can be used for credit card payment e.g. for internet orders. The objective of this research project is to identify and to recommend protection measures to avoid NFC data stealing, as are
usage of special credit card boxes blocking RFID communication,
putting credit cards in bigger container units such as large handbags,
observing credit card transaction on bank account, and
creating public awareness on the possibility of being pickpocketed.
In sum, as pointed out at the beginning, this panel session covered all dimensions from very large infrastructures down to urban districts and further down to a personal level discussing the question of how to protect against criminal data theft, data ma- nipulation and cyberattacks. All the three papers explore “objects on the move” and how criminal intervention can damage the moving targets. The excitement of this panel is to learn about the dimensionalities of such problems as well as about the methodologies to cope with the challenges raised.
Tobias Cors
Hamburg University, Moorweidenstraße 18, 20148 Hamburg, tobias.cors@uni-hamburg.de
Kai Hoth
Hamburg University, Moorweidenstraße 18, 20148 Hamburg, kai.hoth@uni-hamburg.de
Dr. Martin Tschöke
Hamburg University, Moorweidenstraße 18, 20148 Hamburg, martin.tschoeke@uni-hamburg.de
Prof. Dr. Malte Fliedner
Hamburg University, Moorweidenstraße 18, 20148 Hamburg, malte.fliedner@uni-hamburg.de
Prof. Dr. Knut Haase
Hamburg University, Moorweidenstraße 18, 20148 Hamburg, knut.haase@uni-hamburg.de
Prof. Dr. Wilfried Honekamp
Academy of Hamburg Police, Carl-Cohn-Straße 39, 22297 Hamburg, wilfried.honekamp@polizei-studium.org
1 Introduction ... 9 2 Data Analysis ... 9 3 Stochastic Process Models ... 12 4 Concept of the Simulation Model ... 13 5 Discussion of Results and Future Work ... 15 6 References ... 15
Abstract:
This chapter discusses a simulation model for conducting workload analyses of po- lice forces. Due to the high operational heterogeneity and variability, determining reliable profiles for resource utilization and establishing their relationship to re- sponse times is a challenging task in and of itself that requires an adequate consid- eration of several sources of stochastic influence. Prior approaches from police prac- tice mainly consider static ratios (e.g. resources per number of inhabitants or calls for service) in order to estimate capacity demand. Based on an extensive dataset comprising more than two million data points, we derive stochastic process models for all relevant police operations in a major metropolitan area and use a discrete- event simulation to analyse the effects on workloads and capacity utilization of a given fleet of police cars. The simulation model predicts the spatial and temporal occurrence of police operations and dispatches available vehicles from different dis- tricts, in order to model resource sharing in emergency response. This provides key insights into the required capacity over time and constitutes a crucial first step for an adequate capacity planning.
JEL Classification: O21, J21, M54
Keywords: Police force planning, stochastic processes, simulation, capacity planning.
1 Introduction
A crucial task in the planning of police forces is guaranteeing an adequate allocation of resources (personnel, vehicles, etc.) to police districts such that an effective and robust service can be provided and emergency response times are kept as low as pos- sible. The vast majority of planning approaches in practice makes use of static ratios that determine the number of personnel or police cars based on the number of resi- dents in a district or the number of calls for service over time (McCabe, 2012). While these static approaches are easy to handle, they are typically not able to provide reli- able estimates that capture the heterogeneity and variability of police work (Wilson and Weiss, 2014). There is thus a general demand for more comprehensive ap- proaches that model the effects of different calls for service on workloads and conduct capacity planning with respect to these relationships.
In other areas of application, such as logistics, staffing decisions in complex dynamic systems are often carried out by integrating simulation studies into capacity planning (see for instance Mason et al., 1998). The major advantage of such simulative anal- yses is that they are able to capture the interaction effects of different sources of sto- chastic influence and allow a study of the system’s behaviour over time. Only re- cently, Zhang et al. (2012) demonstrated the superiority of simulation driven planning in the field of hospital resource planning when compared to a set of static ratio ap- proaches quite similar to those used in police staffing. Nonetheless, reports of simi- larly advanced approaches in the field of policing are rare. Edleston and Bartlett (2012) are among the very few documented authors that use more advanced optimi- zation techniques coupled with simulation analysis to support police staffing deci- sions.
In this work we will line out a simulation model that seeks to address the identified need for more comprehensive planning tools in policing. We study a major German metropolitan area that consists of 24 police districts that need to be equipped with an adequate number of police cars over the week. At the time of the project, resource allocation is carried out by a static ratio approach based on the average number of calls per district and hour thereby ignoring individual characteristics of different dis- tricts and the dynamic interactions in the arrival patterns of incoming calls. The major aim of the simulation model is to adequately capture these relationships to better sup- port capacity decisions.
2 Data Analysis
One of the central challenges of police force planning is dealing with the considerable operational heterogeneity of calls for service that typically vary structurally over time and space. On the one hand, this makes deriving reliable estimates for capacity utili- zation much more difficult, on the other hand it typically leads to considerable varia- tions in capacity demand over time and thus increases the complexity of an adequate
shift and fleet planning. In order to derive insights into the service structure, we there- fore first carried out a comprehensive data analysis of more than 1.5 mio real-world calls for service, comprising information about the time and place of occurrence, call type, priority and number of assigned police cars over time. In addition to that, we conducted several workshops with police experts in order to obtain time estimates for all further service dependent tasks, in particular related to documentation and admin- istrative work. Both analyses and their main results are explained in more detail in the following.
2.1 Analysis of Calls for Service
In a first step of the analysis, the call data was screened for incomplete and misre- ported data using both standard statistical outlier detection and expert analysis and depending on the extent either replaced by mean value estimates or removed from further analysis. Approximately, 5% of data entries were removed by this procedure.
The remaining data was then analysed using means and variance analysis, which con- firmed the following four core hypotheses:
(1) Occurrence frequencies of calls for service vary heavily over time of day and police district
(2) On scene resolution times vary heavily with respect to the type of call, but also albeit less distinctly with respect to place
(3) Associated workload also varies heavily over time of day and police district yet characteristic workload profiles can be derived for each weekday and dis- trict that are stable over time
(4) Police districts make extensive use of resource sharing in emergency re- sponse, such that police cars of a given district respond to calls for service in another district if no alternative is available
The analysis further revealed structural differences in occurrence of calls for service and on-scene resolution times between the warmer and the colder months of the year, which further results to systematically different workload profiles for summer and winter shifts.
2.2 Analysis of administrative work
The central information system that records data on calls for service does not cover any additional administrative tasks that are for instance required to document the on- site events or to file the necessary paperwork for law enforcement. Therefore, we used a Delphi method to determine theses times depending on the type of police op- eration. Häder (2014) considers the classic Delphi method to be a comparatively, highly structured group communication process. Facts about which insecure and in- complete knowledge exists are judged by experts. The basic aspects of this method are group communication and the structuring of unknown information. The collected
information of the experts receives a higher qualification through the multi-level questioning. The classic Delphi process according to Webler et al. (1991) is charac- terized by a multi-step approach. At least four, but no more than five steps must be completed. The first step is the development of the questionnaire, in the second step the first survey of the experts, in the third step the evaluation by the research team and in the fourth step the second survey of the experts. Due to time and personnel constraints we chose a procedure where a questionnaire is delivered to experts in ad- vance of and after one workshop. The process of our application of the Delphi method is depicted in Figure 1.
Figure 1: Applied Delphi method
The questionnaire was developed in order to request an estimate of the percentage share for the entire process production and post-processing per type of operation in addition to the function group. For the 48 most common types of operations, covering 85% of all missions, three questionnaires with 16 types of use were created. In order not to burden the experts inappropriately, everyone randomly received one of the three questionnaires. For each type of operation, three estimates of the further tasks should be made in minutes, for a task with:
• simple effort,
• average effort, and
• high effort.
This method is based on the three-point estimate in which experts give an optimistic, a pessimistic and a realistic estimate. This often determines the costs of the entire project in project groups. The advantage of this estimation is the simple and easy to understand application. As experts, 96 experienced police officers of four groups were selected from all police districts, each: a service group leader, a watch officer, one from the career sections 1 and 2. The experts were supposed neither to state their names nor to which district they belonged. The results showed coefficients of varia- tion of 0.4 to 1.0. After the questionnaires had been evaluated, the four groups were invited to separate workshops. Each group discussed the consolidated average time
of their group for the three estimates (simple, average, and high effort) in four hours in the afternoon. After the discussion, the experts were questioned again in the same way as before. By this, the coefficients of variation could be reduced to 0.2 to 0.3.
3 Stochastic Process Models
In this section we describe how stochastic process models for workload estimation were derived on the basis of the conducted data analysis, as summarized in Figure 2.
In a first step, calls for service were combined to appropriate reference classes when- ever possible to reduce the number of necessary estimates in the following steps. Next we estimated occurrence probabilities from historic data over time and space and the time necessary to approach the site of the call. Finally, the distribution over workload profile of the call was determined as well as the time for administrative work.
Figure 2: Process Model
3.1 Classification of calls for service
In order to reduce the complexity of the considered system, we first set out to reduce the number of reference classes of calls for service by conducting a Pareto analysis.
For this purpose, all calls were ranked with respect to their total effect on workloads and then assigned to three distinct categories. The 37 calls that comprised more than 80 % of the workload were assigned to category ‘A’ and modeled individually. The next 32 calls that utilized another 15 % of the workload were assigned to category
‘B’ and the remaining calls to category ‘C’. Calls in category B were analyzed with respect to their characteristics and merged to classes of calls with similar profiles whenever possible. Calls in category C were subsumed under a single class due to their low impact on workloads. All in all, we were able to reduce the number of clas- ses to a third of the total number of calls in this way (54 classes instead of 162 calls).
3.2 Occurrence model and transit estimation
As was established in the data analysis, relative frequencies of calls for service vary heavily over time and place. Occurrence probabilities were thus modelled as non- stationary Poisson processes and estimated separately for all districts and weekly hours.
In many of the less frequent calls for service relative occurrence rates were less than one per hour, so that sampling was conducted on the underlying binomial distribution using per minute approximations:
1 1 /
where X represents the time of the next occurrence and λ is the hourly arrival rate of the call.
Transit times of assigned police cars were estimated for each district individually to account for the considerable differences in size and traffic flows. We found that most transit times could be adequately approximated by lognormal distributions. Distribu- tion parameters were estimated after conducting an additional outlier analysis that accounted for the observed shapes of distributions.
3.3 Capacity profiles and administrative work
Different calls for service can vary heavily with respect to average resolution times as well as the number of police cars assigned to the call. What is more, the dynamic nature of police work sometimes makes it necessary to further assign additional po- lice cars to an ongoing call or to withdraw police cars that are not needed any further.
Due to the extensive number of interaction effects; estimating these relationships and approximating them by stochastic distributions proved challenging and carries the additional risk of introducing structural biases that are not borne out in the data. We thus decided for a boot strapping approach that draws realistic capacity profiles for each reference class out of a set of observed calls for service. While this has the dis- advantage that the simulation will not be able to generate call profiles that were not yet observed, it rules out the possibility of constructing unrealistic resolution dynam- ics. The extensive number of observations in the reference classes further make sure that the represented variability remains sufficiently high.
Administrative work was assigned to police staff that as mean estimates without con- sidering the inherent real-world variability. Since the process model assumes that ad- ministrative work can be interrupted in case of emergency calls, the variability of the administrative time will not affect response times of critical calls anyway and thus mean estimates are sufficient for any long-term analysis.
4 Concept of the Simulation Model
The stochastic process model described in the previous section adequately captures the demand side. In order to assess the system performance accurately in light of the demand, it is further necessary to model how calls for service are handled by the system. For this purpose, a discrete event simulation (DES) has been developed based on queue modelling with spatial and temporal differentiation. This allows determin-
ing the burden put on the system according to current capacity plans and further al- lows deriving hints with respect to performance-based capacity adjustment. Thus, workload-appropriate capacity plans can be suggested by leveraging the gained in- sights of the data analysis in the simulation.
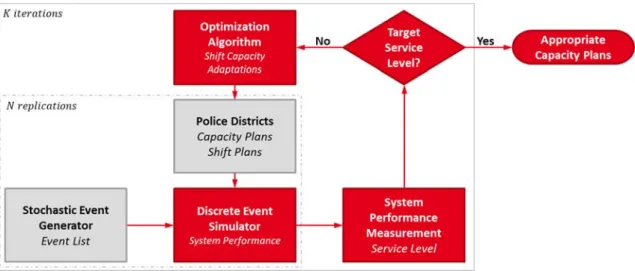
The Stochastic Event Generator in Figure 3 builds upon the developed process model and is the starting point for the simulation. Based on the past data it generates N weekly load profiles in minute resolution. These provide the discrete demand events as calls for service in the simulation. To satisfy the demand in the simulation, capacity plans and respective shift plans of all police districts provide the supply side in form of police cars. Demand and supply are represented as grey input data blocks for the DES model in Figure 3.
Figure 3: Overview of the blocks and processes of the higher-level simulation and planning task
A weekly load profile comprises about 9000 missions. For each mission the data of the occurrence (district, time, day of the week, month), the type (call for service, po- lice car requirement, priority) and the operation (travel time, duration of operation on-site, administrative work) are saved as attributes and considered in the simulation.
On the supply side, for all districts capacity plan data (day, time, shift, number of police cars) is used in minute resolution. Additionally, for each district an individu- ally ordered list of backup districts reproduce the identified resource sharing patterns in the simulation.
With these data sets and implemented logic, the DES model tries to serve the demand with the given capacity. In the process the system performance for each of the N replications, which represent different realizations of load profiles, is measured and service levels for all call priorities are determined. If service level targets are not met, the capacities can be (spatially and temporally) adapted with respect to observed per- formance. With the resulting new capacity plans, the simulation is repeated in the next iteration. This process continues until, after K iterations of capacity adjustments
or until the target service levels are reached and thus adequate capacity plans have been created.
5 Discussion of Results and Future Work
The simulation model was validated against real data comprising three weeks of rec- orded calls and managed to reproduce all main measures of system performance (re- sponse times, calls not answered within x minutes, capacity exchange between dis- tricts) with high reliability. We further conducted separate workload analyses for rep- resentative summer and winter months and were able to show that prior capacity plans that were generated by a static ratio approach systematically fail to capture the diver- sity between districts and times of day, whereas the simulation approach does provide robust insights into the diverging workload structure.
In the next phase, we seek to employ the simulation model for deriving adequate capacity plans that account for the aforementioned structural differences. It is further planned to implement staffing changes on the basis of these insights, in order to fur- ther test the generated model predictions of the system performance against the real dynamics in practice.
6 References
Häder, M. (2014): Delphi-Befragungen: Ein Arbeitsbuch. Springer VS: Wiesbaden.
Mason, A.J.; Ryan, D.M.; Panton, D.M. (1998): Integrated Simulation, Heuristic and Optimisation Approaches to Staff Scheduling, Operations Research 46(2), 161–
175.
McCabe, J. (2013): An analysis of police department staffing: How many officers do you really need?, ICMA Center for Public Service Management, White Paper.
Webler, T.; Levine, D.; Rakel, H.; Renn, O. (1991): The Group Delphi: A Novel Attempt at Reducing Uncertainty. Technological Forecasting and Social Change 39, 253–263.
Wilson, J.M.; Weiss, A. (2014): Police Staffing Allocation and Managing Workload Demand: A Critical Assessment of Existing Practices, Policing: A Journal of Policy and Practice 2, 96–108.
Edleston, O.S.S.T.; Bartlett, L.M. (2012): A tabu search algorithm applied to the staffing roster problem of Leicestershire police force; Journal of the Operational Research Society 63, 489–496.
Zhang, Y., Puterman, M.L.; Nelson, M.; Atkins, D. (2012): A Simulation Optimiza- tion Approach for Long-Term Care Capacity Planning, Operations Research 60(2), 249–261.
Port Logistics IT Security Monitoring
Prof. Dr. Wilfried Honekamp
Academy of Hamburg Police, Carl-Cohn-Straße 39, 22297 Hamburg, wilfried.honekamp@polizei-studium.org
Lars Damm
Hamburger Hafen und Logistik AG, Bei St. Annen 1, 20457 Hamburg, Damm-L@hhla.de
Torsten Fokuhl
DAKOSY Datenkommunikationssystem AG, Mattentwiete 2, 20457 Hamburg, Fokuhl@DAKOSY.de
1 Introduction ... 18 2 Background ... 19 3 Approaches ... 21 4 Outlook ... 24 5 Acknowlegements ... 24 6 References ... 24
Abstract:
Hackers and cyber-attacks are becoming an increasing threat to the port industry, whose progressive digitisation further increases sensitivity to such risks. An innova- tive, cross-company linkage of the various existing IT security tools will substantially improve the detection and defence against cyber-attacks on the IT systems of the Ger- man port handling companies. Therefore, the partners Hamburger Hafen und Logis- tik AG (HHLA), DAKOSY AG and Hamburg University as well as EUROGATE and the Academy of Hamburg Police as associate partners have come together in the three-year program “HITS-Moni” to bundle the different competencies and re- sources to develop new concepts and procedures and to evaluate them with a software demonstrator.
JEL Classification: R49, O33, K39
Keywords: Security, IT, monitoring, deep learning, SmartPort.
1 Introduction
Cyber- and hacker attacks are becoming an increasing threat to companies in the port industry, whose progressive digitisation is further increasing their sensitivity to such risks. By implementing the SmartPort, i.e. the networking of the port and logistics sector with just-in-time production of industry, a cyber-attack can cause enormous economic costs. The shipping company and container terminal operator A.P. Møller Mærsk was targeted at the end of June 2017 by a cyber-attack by NotPetya, which significantly disrupted the operational processes for a period of several weeks. This attack resulted in costs of around USD 300 million.
Port industry companies have numerous powerful IT security tools that do not ade- quately reflect port-specific security requirements. In addition, coordination of vari- ous IT security tools currently cannot be reliably assured. Carefully executed attacks, that are at most visible in a few anomalies, are not or too late detected. The Federal Government has set the framework conditions for the protection of IT in ports with the 2015 national port concept. The aim is to secure business processes and promote international competitiveness. In addition, the ability to analyse and respond on the ground is to be strengthened and law enforcement in cyberspace is to be intensified.
Cyber espionage and cyber sabotage should be effectively combated.
HHLA, as a major port and logistics service provider, has numerous IT security tools that show good results in limited areas of responsibility, but are very time-consuming to look after and evaluate while imposing heavy burden on employees. Complex standard IT security products only insufficiently consider port-specific IT require- ments. A higher-level, systematic and preferably automatic correlation as well as a coordination of the various IT security tools does not currently take place, but would significantly increase the effect of the entire information security system. Detecting attacks that are made up of different anomalies, each below the triggering threshold of a singular system, are not yet apparent with traditional IT standard solutions, yet can lead to massive disruptions in availability or data integrity.
The German Federal Office for Information Security (BSI) Act requires in §8a (1) that operators of critical infrastructures implement appropriate organisational and technical arrangements to prevent disruptions to the availability, integrity, authentic- ity and confidentiality of their IT systems, components or processes that are relevant to the functioning of their critical infrastructures. The state of the art should be ad- hered, too. The implementation of this law will be relevant for HHLA as the largest operator of container terminals in Germany. The BSI is designated as the central re- porting office for security in the information technology of critical infrastructures (§8b BSIG). In addition to the compulsory notifications specified in §8b (4) BSIG for certain situations, the BSI is responsible for the creation of the situation report (§8b (2) section 3) as complete, qualified and easily usable as possible, even by companies
whose transport or transshipment volumes are below the threshold values of the BSI- KritisV. With the implementation of this research project, HHLA will be able to send considerably more extensive and qualified data to the BSI. This will hopefully im- prove the federal situation on cybercrime and substantially support the work of the BSI. In addition, a way will be shown to extend the exchange to other port handling companies (horizontally) or corresponding links in the process chain (vertically, such as IT service providers, authorities, railway operators, shipping companies, haulers).
With respect to the above-mentioned challenges the project aims at the following goals:
early detect and defend port-specific cyber-attacks by monitoring with innova- tive algorithms
improve the recognisability of novel attacks
develop a concept for the ergonomic representation of possible attacks (avoid- ance of neurostress among employees)
structure and promote exchanges on cyber-attacks between logistic companies.
2 Background
The industry offers a wide range of classic firewalls and anti-virus software products that can generally fend off standardized and untargeted hacker attacks. However, pro- fessional IT specialists or job hackers are able to circumvent these well-known indi- vidual tools, or deliberately undercut the usual warning threshold. Anomalies in the information system of a company always occur; many are even caused by their own users. Around 20% of the attacks or abuses come from employees within the com- pany, while most of these irregularities or anomalies may occur unintentionally. It has since been found that there are always external cyber-attacks or accesses that are not recognized for a long time, before it comes to the actual attack with visible nega- tive effects. Very often unauthorized external access to an IT system is already estab- lished long before detection occurs. According to a recent study a median of 78 days is needed before companies detect such intruders and only then can take counter- measures (FireEye 2019).
Even a vulnerability and risk analysis tailored to port logistics does not currently ex- ist. Software specifically tailored to the needs of port logistics can specifically address the systems used in port logistics and address the specific threats in this industry, such as: moving goods, layer 7 attacks on data elements along the process chain, and in- terference in payments and politically motivated attacks (hacktivism) focus. Port lo- gistics uses a variety of tools to improve IT security. These include e.g. proxies, mail gateways, virus scanners, USB locks, monitoring, firewalls, and intrusion prevention systems. These different systems require different operators and create diverse, some- times even contradictory messages. The correlation and coordination of the different messages takes time, which may be missing in the fight against cyber-attacks. Unified
security management tools are available on the market (e.g. Alienvault, LogRhythm), but they have weaknesses, especially in the combination of information and the sim- plicity of the presentation of results. In addition, port logistics security requirements in the fields of device control and the multi company business process are too short.
On the other hand, technologies for processing log files (Graylog, Elasticsearch) are available, but they do not focus on security aspects or ready-made forms of presenta- tion. All available solutions lack the reduction of the number of less relevant mes- sages, the early identification of attack preparations, e.g. automatic baselining, and the identification of novel attack patterns.
Disterer (2015) calls for systematically addressing and differentiating IT security risks in order to be able to plan, develop, control and monitor measures specifically for specific risk areas. The BSI (2012) recommends a vulnerability analysis with the software tool OpenVAS (or the commercial implementation Greenbone). This is now available in version 9. For risk analysis, the BSI (2008) published the standard 100- 3 and in November 2017 transferred it to the standard 200-3 into a simplified hazard model. Due to increasing complexity of the systems Schaumüller-Bichl and Kol- berger (2016) propagate a scenario-based impact analysis. Different scenarios are thought through and their effects on the protection goals are estimated. However, an industry-specific security standard for critical infrastructure in the transport and lo- gistics sector does not yet exist. Nor is there currently any literature on vulnerability or risk analysis specifically focused on IT in port logistics.
There are a number of Security Information and Event Management (SIEM) tools available for managing IT security information and events. Cam et al. (2016) cite OSSIM, ArcSight, and Splunk as the top three. OSSIM is the open source variant of AlienVault’s commercial tool. The implementation and use requires a considerable amount of time and personnel for document verification, communication in Alien- Vault’s online forums and research. However, this effort can be outsourced to exter- nal service providers. Hewlett Packard’s ArcSight is the most widely used SIEM tool.
Like OSSIM, ArcSight is rule-based. Splunk, on the other hand, works with indexed databases that are searched for specific correlation-based patterns based on their own Search Processing Language (SPL). All tools have in common that they only react to known patterns and are not capable of learning.
Detken et al. (2017) also mention the open-source SIEM of rt solutions.de GmbH.
However, this does not provide “guaranteed event processing”, which raises doubts about reliability. The group is working in the CLEARER project on the development of network access control systems with SIEM functionality for small and medium- sized enterprises. A self-learning SIEM tailored to IT in port logistics does not cur- rently exist.
3 Approaches
In this part the approaches to work on the project goals are described. The chapter starts with the early detection and defence by monitoring with innovative algorithms.
Then the evaluation process of novel attacks is described. This is followed by the description of the ergonomic representation of possible attacks. Finally, the data ex- changes between companies are depicted.
3.1 Early detect and defend by monitoring with innovative algorithms
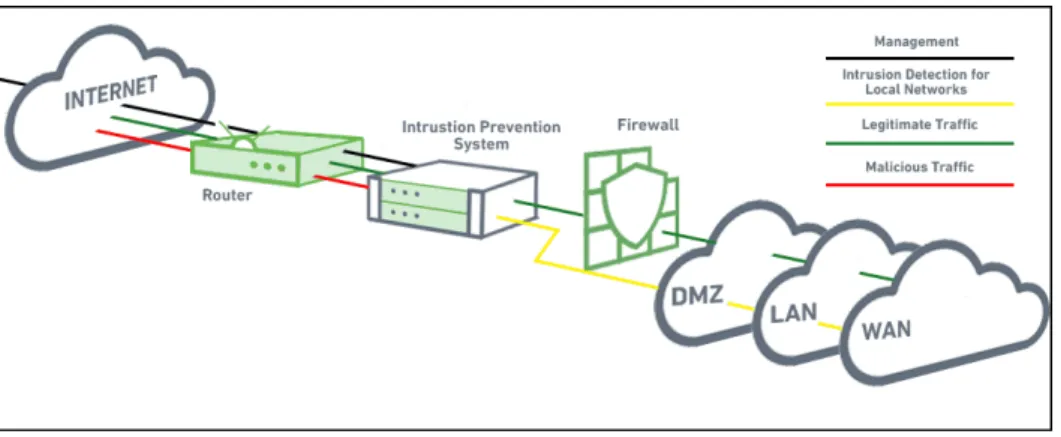
In a first step, all internal and external interfaces must be taken into account across the company. It is all about the question of what data is available in the system, can be collected technically and meaningfully processed. This requires a comprehensive analysis of all existing systems supporting the business processes under considera- tion. These are, among others, services on servers and workstations such as anti-virus programs and firewalls, decentralised (network) intrusion detection systems (IDS) and prevention systems (IPS). Figure 1 depicts an IPS in a company network.
Figure 1: Intrusion prevention system (Borkar 2019)
Furthermore, information, that can be collected, has to be assessed and analysed for its relevance to incident detection and investigation within and for the systems under consideration, as well as how data collection and storage may affect the usability of the systems to users at runtime. This assessment is supported by the identification of potential vulnerabilities in the overall system, which already provides evidence of critical parts of the system and thus show the significance of the monitoring data of these parts of the system.
In a second step, the data must be reduced to the essentials so that forensic investiga- tions become possible. For comprehensive analysis of all data of the individual send- ing IT elements it is mandatory to set up a common database with a uniform format for all data. In particular, the semantics of the field names must be uniform, so that comprehensive analyses can be meaningfully carried out. The existing data of all IT elements involved must be examined for structure and content, and data elements important for IT security monitoring must be identified. In addition to collecting low-
level technical elements, the performance and health data of the relevant business processes (within IT systems) must be observed and aggregated in the same way.
Then, for each IT element, a process must be developed that receives and extracts the necessary content from the raw data, transforms it into the common format, and sub- mits the record to the database. The entries of this database can then be used as input vectors of a multilayer neural network establishing deep learning. Figure 2 maps deep learning into machine learning and artificial intelligence.
Figure 2: Artificial intelligence, machine learning, and deep learning (Aunkofer 2018)
This approach allows additional correlation of the data and possibly results in an alert.
Thus, despite expected flood of data, it will be possible to detect attacks early and precisely.
3.2 Evaluate novel attacks
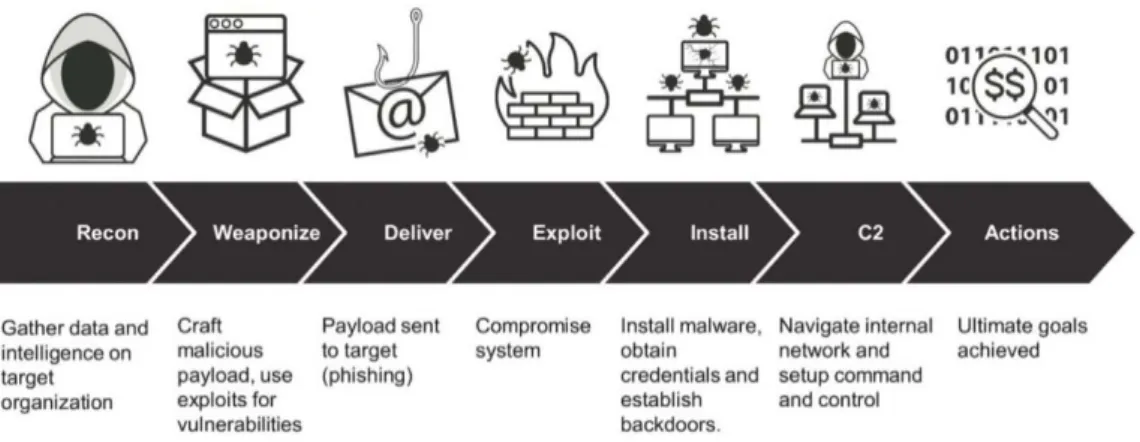
To detect new attack patterns, a robust cyber-attack kill chain analysis is necessary.
Figure 3 shows the kill chain first published by Hutchins, Cloppert and Amin (2011).
Subsequently, the above-mentioned additions of intelligent components are to make, by which reaction and communication options could be shown. The automated ac- tions of the protection systems are applied in the different phases. In the reconnais- sance phase, firewalls and access control lists (ACL) could deny access, web analyt- ics could detect attacks. In the weaponisation phase network IPS and IDS could be effective. The delivery phase can at best be detected by vigilant users (Lovinus 2016).
Filters could deny and antivirus systems could disrupt the delivery. By putting soft- ware deliveries into monitored queues, an attack could be degraded.
Figure 3: Cyber-attack chain (Lockheed Martin 2018)
The exploitation could be prevented by keeping the system hard- and software up to date, closing known security flaws. Furthermore, exploitation could be detected by host IDS and disrupted by data execution prevention. In the installation phase, the attacker could be kept in a sandbox, e.g. by a chroot jail (Badjatiya 2019), detected by a host IDS or disrupted by an antivirus system. In the command and control (C2) phase, firewalls that control outgoing traffic and ACL could prevent the hostile ac- tion. Network IDS and IPS also could be effective. As more and more traffic is en- crypted in https a decryption at a central proxy server with forwarding of the payloads to an analysing engine should be evaluated. A tarpit could degrade the attack (Maxi- mov, Sokolovsky, Gavrilov 2017) and a domain name service redirection could de- ceive the attacker. Finally, the actions on the targeted objectives could be detected by auditing, degraded by quality of service and deceived by honypots. All these measures are initiated only if a single system’s detection is sufficiently reliable. Their combination with the broad set of further observed data below the single elements’
thresholds could be combined in a system of systems supported by machine learning with deep learning algorithms.
3.3 Ergonomic representation of possible attacks
Ergonomic aspects of information representation have been discussed in science for many years. Bruyas, Le Breton, and Pauzié (1998, p. 412) conclude that graphical
“representation of an object should be quickly understood, with no ambiguity, […]
when considering the high time constraint context of some situations”. Visual repre- sentation and interaction mechanisms have been identified as decisive criteria (Luz- zardi, Dal Sasso Freitas (2003). In control rooms, where an application of our moni- toring system is to be implemented, responsible control system design with imple- mentation of ergonomic aspects according to ISO 9241 is required. Human-centred design is also required (Skřehot, Marek, Houser 2016).
3.4 Exchanges between companies
Threat intelligence is a commodity. There are several threat intelligence sharing plat- forms with different standards for describing threats. One, the intrusion detection message exchange format (IDMEF) is described in RFC 4765 by Debar, Curry and Feinstein (2007). It is to be evaluated whether this format is suited to share harbour related security information. More recently, the malware information-sharing plat- form (MISP) has gained in maturity and interest since the beginning of the project in 2011, not least among public IT security authorities in Europe (Dulaunoy et al. 2019).
The BSI evaluates operating models to exchange such information with operators of critical infrastructures in Germany (BSI 2019, p. 59).
4 Outlook
In the project, the cooperators work on the above mentioned challenges along the information processing path, beginning with the basic information elements, the ag- gregation phase and the learning system to the output handling like automated ac- tions, visualisation and situation reporting to third parties. The project is scheduled until February 2022, further results are to be published.
5 Acknowlegements
The project is founded by the German Federal Ministry of Transport and Digital In- frastructure in line with the financial assistance programme for innovative port tech- nologies (IHATEC).
6 References
Aunkofer, B. (2018): Machine Learning vs Deep Learning – Wo liegt der Unter- schied? Accessed on 13.10.2019 at https://data-science-blog.com/blog/
2018/05/14/machine-learning-vs-deep-learning-wo-liegt-der-unterschied/.
Badjatiya, P. (2019): Linux Virtualization - Chroot Jail - GeeksforGeeks. Accessed on 13.10.2019 at https://www.geeksforgeeks.org/linux-virtualization-using- chroot-jail/.
Borkar, P. (2019): IPS Security: How Active Security Saves Time and Stops At- tacks in their Tracks. Accessed on 13.10.2019 at https://www.exa-
beam.com/ueba/ipssecurity-how-active-security-saves-time-and-stop-attacks- in-their-tracks/.
Bruyas, M.-P.; Le Breton, B. and Pauzié, A. (1998): Ergonomic guidelines for the design of pictorial information. International Journal of Industrial Ergonomics 21 (1998) p. 407–413.
BSI (2008): BSI-Standard 100-3: Risikoanalyse auf der Basis von IT-Grundschutz, Version 2.5.