www.nature.com/scientificreports
Ocean acidification reduces transfer of essential biomolecules in a
natural plankton community
J. Rafael Bermúdez1,2, Ulf Riebesell1, Aud Larsen3 & Monika Winder1,4
Ocean acidification (OA), a process of increasing seawater acidity caused by the uptake of
anthropogenic carbon dioxide (CO2) by the ocean, is expected to change surface ocean pH to levels unprecedented for millions of years, affecting marine food web structures and trophic interactions.
Using an in situ mesocosm approach we investigated effects of OA on community composition and trophic transfer of essential fatty acids (FA) in a natural plankton assemblage. Elevated pCO2 favored the smallest phytoplankton size class in terms of biomass, primarily picoeukaryotes, at the expense of chlorophyta and haptophyta in the nano-plankton size range. This shift in community composition and size structure was accompanied by a decline in the proportion of polyunsaturated FA (PUFA) to total FA content in the nano- and picophytoplankton size fractions. This decline was mirrored in a continuing reduction in the relative PUFA content of the dominant copepod, Calanus finmarchicus, which primarily fed on the nano-size class. Our results demonstrate that a shift in phytoplankton community composition and biochemical composition in response to rising CO2 can affect the transfer of essential compounds to higher trophic levels, which rely on their prey as a source for essential macromolecules.
Biomolecules synthesized by primary producers such as fatty acids (FA), and in particular polyunsaturated FA (PUFA), are considered essential metabolites for zooplankton and fish larvae1. As most consumers cannot syn- thesize these compounds de novo, they have to acquire them through their diet1. Laboratory experiments on the PUFA composition of microalgal cultures under different CO2 scenarios revealed a range of responses, ranging from increased2, to stable3, to reduced PUFA fractions4–6. Considering that food quality, including the FA com- position, can be as important as food quantity for the transfer efficiency up the food web and the productivity of higher trophic levels7, a better understanding of OA effects on the biochemical composition of primary producers and the trophic transfer of this signal seems essential.
At community level, the food quality to a large extent is determined by the phytoplankton species compo- sition, as different algal taxonomic groups have distinct biochemical signatures8. Experiments with natural plankton assemblages indicate that changing pCO2 can have pronounced impacts on phytoplankton community structure9,10, particularly small-sized algae like picoeukaryotes and cyanobacteria11,12. Thus, OA can affect the quality and quantity of food available for upper trophic levels by changing both the taxonomic composition and the biochemical signature of primary producers.
To investigate the effects of OA on phytoplankton species composition and consequences of biochemical transfer to upper trophic levels, we conducted an in situ mesocosm study enclosing a natural North Sea plankton community. The carbonate chemistry in the mesocosms was manipulated via the addition of CO2-saturated sea- water to yield pCO2 ranging from current to projected levels by end of this century13, plus two extreme treatments beyond projected levels. We monitored the plankton community composition, FA content of three size fractions (micro: 100–10 μ m, nano: 10–2.7 μ m, pico: 2.7–0.3 μ m), as well as zooplankton FA in the dominant copepod Calanus finmarchicus over the course of the experiment, and classified FA as PUFA, MUFA (monounsaturated fatty acids) and SFA (saturated fatty acids).
1GEOMAR | Helmholtz Centre for Ocean Research Kiel, Germany. 2Facultad de Ingeniería Marítima, Ciencias Biológicas, Oceánicas y Recursos Naturales. Escuela Superior Politécnica del Litoral, ESPOL, Guayaquil, Ecuador.
3The Hjort Centre for Marine Ecosystem Dynamics, Uni Research Environment, 5008 Bergen, Norway. 4Department of Ecology, Environment and Plant Sciences, Stockholm University, Sweden. Correspondence and requests for materials should be addressed to J.R.B. (email: jrbermud@espol.edu.ec)
Received: 06 January 2016 Accepted: 24 May 2016 Published: 21 June 2016
OPEN
Results and Discussion
The size structure of the phytoplankton community shifted during the experiment in the different CO2 treat- ments. A Mixed Effect Model (MEM) analysis from sampling day 3 to sampling day 25 performed by size fraction revealed that plankton biomass in the micro- (Fig. 1a, Fig. S1) and nano-size (Fig. 1b, Fig. S1) fractions changed significantly through time at different pCO2 treatments (MEM micro: pCO2 F = 12.95, p < 0.0001, df = 85; time F = 24.32, p < 0.0001, df = 85; pCO2: time interaction F = 12.09, p < 0.0001, df = 85. MEM Nano: pCO2 F = 28.73, p < 0.000, df = 81; time F = 5.17, p = 0.025, df = 81; pCO2: time interaction F = 42.37, p < 0.0001, df = 81), while the pico-size fraction biomass (picocyanobacteria and picoeukaryotes) showed a fast change with pCO2, reach- ing a significantly higher abundance at elevated treatments in a short time (pico: pCO2 F = 74.47, p < 0.0001, df = 85; time p = 0.8496; pCO2: time interaction F = 3.6873, p = 0.0582) (Fig. 1c; Fig. S1). These observations are consistent with some studies showing that small-sized phytoplankton benefit from high pCO2 levels in terms of growth rate and biomass accumulation11,12. A Mann-Kendall trend analyses over the duration of the experiment revealed that this change was due to differential responses of major taxonomic groups to elevated pCO2 (Fig. 2a).
Chlorophyta (mostly Prasinophyecea in the nano-size range), the most abundant group, gradually increased sig- nificantly (p < 0.05) in low pCO2 treatments and did not change at intermediate and high pCO2 conditions over the experimental duration (Fig. 2a). Haptophyta, dominated by the coccolithophore Emiliania huxleyi in the nano-size class, increased significantly at low pCO2 levels, were unaffected at intermediate values and signifi- cantly declined at high CO2 treatments (Fig. 2a). The negative CO2 effect on the coccolithophores observed in the present experiment is consistent with other mesocosm studies that showed a diminished abundance of calcifying algae at high pCO2 levels attributed to reduced growth rates at increased CO2 conditions14. The same pattern was Figure 1. Average calculated biomass of the phytoplankton between sampling days 3 and 25, by size fraction:
(a) microplankton (> 10 μ m), (b) nanoplankton (10–2.7 μ m) and (c) picoplankton (< 2.7 μ m) in the CO2
gradient treatments during the experiment. A Mixed Effect Model analysis showed that all size fractions had significant differences in biomass between the pCO2 treatments. The x-axes display the mean CO2 levels (μ atm) during the analyzed time period in each mesocosm, bars show standard error.
www.nature.com/scientificreports/
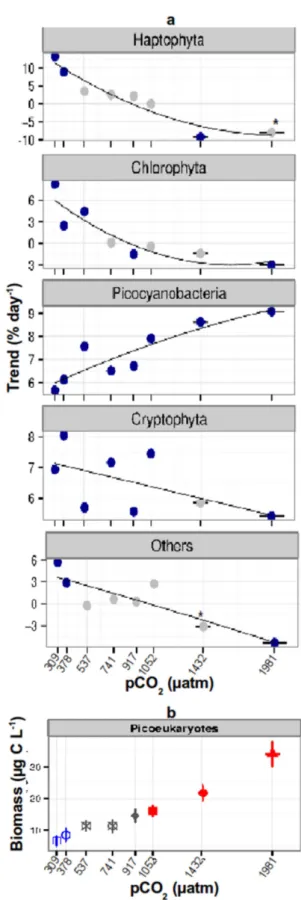
Figure 2. (a) Mann Kendall trend statistics of major phytoplankton taxonomic group biomass, between sampling days 3 and 25, across mesocosm treatments. Trends are shown as percent change per day (Trend
%day-1); blue dots indicate significant trends (p < 0.05), grey dots no significant change (* p-value = 0.056). The x-axes display the mean pCO2 levels (μ atm) during the analyzed time period in each mesocosm. (b) Mean of picoeukaryote biomass between day 3 and 25 during the experiment. A Mixed Effect Model analysis revealed a significant increase at elevated pCO2 levels in the biomass between the different treatments (pCO2: F = 83.2834, p < 0.0001, df = 84; time: p = 0.360; pCO2: time interaction, p = 0.102). Man Kendall trend test could not be applied to this group, as biomass increased non-monotonic during the experiment. Bars show standard error.
observed for the sum of miscellaneous phytoplankton taxa (Euglenophyta, Heterokontophyta and Dinophyta in the micro-size range) (Fig. 2a, Others), which comprised only a small fraction of algal biomass in all mesocosms.
Cryptophyta in the nano-size fraction increased significantly over time with no consistent pattern between pCO2
treatments (Fig. 2a). Picocyanobacteria (Synechococcus) increased significantly over the course of the experiment in all mesocosms with a stronger increase at high pCO2 but represented a small fraction of the total biomass (Fig. 2a, Fig. S1). Picoeukaryote biomass, as indicated by a mixed model effect, increased with the treatment gra- dient and became the most dominant taxa at elevated pCO2 towards the end of the experiment (Fig. 2b, Fig. S1).
The change of the community composition in terms of species biomass over time and CO2 was confirmed by a Non-metrical Multidimensional Scaling analysis, which showed a strong gradual shift (Fig. S2) confirmed by an Analysis of Similarity (R = 0.40; p < 0.001), while the change associated with CO2 was comparatively smaller although significant (R = 0.18; p < 0.001).
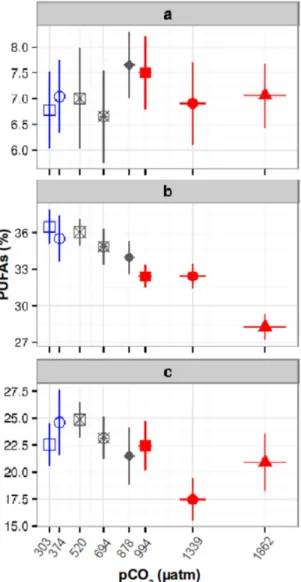
The change in the plankton community composition was accompanied with a change in the FA composition of the different plankton size fractions. The relative content of the ecologically important PUFA group revealed marked differences between size fractions, with ~7% (3 ± 2 ng L−¹) of total FA in the micro-, ~34% (39 ± 14 ng L−¹) in the nano- and ~20% (21 ± 15 ng L−¹) in the pico-size fraction. The PUFA content of the micro-size plankton fraction did not change with pCO2 (Fig. 3a), while there was a significant negative pCO2 effect at the nano- and pico-size fraction (Fig. 3b,c) at low pCO2 levels. In the pico and nano- size fractions the most important PUFA where Eicosapentaenoic (20:5n3, EPA), Eicosatrienoic (20:3n3, ETE) and Docosahexaenoic (22:6n3, DHA) acids (Fig. S3a,b), representing ~60% of the total PUFA. The CO2-related PUFA decrease in the nano- and pico-size fractions was associated with an increase of both SFA and mostly MUFA (Fig. S4).
Figure 3. Relative Polyunsaturated Fatty Acids (PUFAs) content in (a) microplankton (> 10 μ m; no significant difference), (b) nanoplankton (10–2.7 μ m; MEM, F = 14.70, p < 0.001, df = 44) and (c) picoplankton (< 2.7 μ m;
MEM, F = 6.58, p = 0.013, df = 42) size fractions over the pCO2 gradient treatments between sampling days 5 and 29.
The x-axes display the mean pCO2 levels (μ atm) during the analyzed time period in each mesocosm. Bars show standard error.
www.nature.com/scientificreports/
The reduced PUFA content in the nano-size fraction is likely a result of the change in plankton community composition, especially due to the reduced Haptophyta biomass at high pCO2 level, which are a very good sources of PUFA8. The reduced PUFA content in the pico-size fraction can be due to an increase of picocyanobacteria and picoeukaryotes abundance. The first are known for being a poor PUFA source15, while the high abundance of the later at elevated pCO2 suggests a PUFA loss in this group. Although we have not identified the species composition of the picoeukaryote group, significant increases of pico- chlorophyta (Prasinophyecea) have been observed in plankton assemblages at elevated CO2 conditions11. Chlorophyta have a relatively low PUFA content8, which may contribute to the reduced PUFA content at high pCO2. Given that our experiment did not allow the distinction between an indirect effect on PUFA concentration through shifts in species composition and a direct CO2 response on cell physiology, the latter cannot be excluded. It has been shown for both, Chlorophyta and the Haptophyte Emiliania huxleyi that culturing at high CO2 reduced their PUFA content4,16. This suggests that the relative PUFA decrease in both size fractions is most likely a combination of a change in community composition and a direct CO2 effect on cell physiology.
Our results showing low PUFA levels at high pCO2 are contrasting the response of an Arctic plankton commu- nity, in which relative PUFA content increased at elevated pCO2 levels17. The divergent results can be attributed to the different plankton community compositions8. However, this can also be due to the size-fractionation of the samples for FA analysis in the present experiment, which was not done in in the Arctic study. A change in the FA of a single species within the community, especially if it has a large biomass, may mask changes in other size classes or taxonomic groups. The observed PUFA increment in the Arctic was associated to an elevated abun- dance of large-sized dinoflagellates17, which are typically high in PUFA content8 and therefore may not reflect a net positive CO2 effect on all primary producers, but rather in this specific group. Thus, biochemical changes of primary producers belonging to different size fractions may affect higher trophic levels differently as aquatic predators are size-selective18.
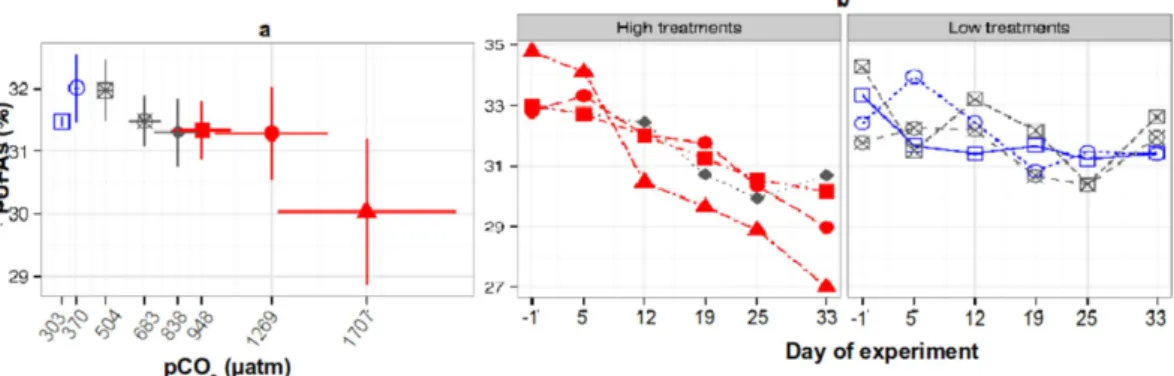
The decrease of PUFA in the nano-size fraction observed in this study affected the PUFA profile of the dom- inant copepod species. The PUFA content in C. finmarchicus represented ~32% (120 ± 40 ng ind.−¹) of total FA, and the relative PUFA content decreased significantly with higher pCO2 levels (Fig. 4a). While staying con- stant at low pCO2 levels, it gradually and significantly decreased at pCO2 treatments of 1120 μ atm and higher, with an average loss of ~4%, and strongly declined (~10%) at the highest pCO2 treatment over the course of the experiment (Fig. 4b). In the copepod, like in the plankton size fractions, the Eicosapentaenoic (20:5n3, EPA), Eicosatrienoic (20:3n3, ETE) and Docosahexaenoic (22:6n3, DHA) acids where the most abundant (Fig. S3c) and represented around ~90% of the total PUFA. The relative PUFA decline was associated with an increase of MUFA and SFA (Fig. S5). The ratio of the different FA classes (PUFA, MUFA, and SFA) in copepods closely resembled the corresponding proportions in the nano-size phytoplankton fraction (Table 1). This close resemblance was Figure 4. (a) Relative Polyunsaturated Fatty Acids (PUFAs) content in the copepod Calanus finmarchicus across the different CO2 treatments (MEM, F = 80.74, p = 0.001, df = 31). The x-axes display the mean pCO2
levels (μ atm) between days 5–33 in each mesocosm. Bars show standard error. (b) Relative PUFAs content of C. finmarchicus between days 1–33 across CO2 treatments. High pCO2 treatments (left) showed a significant decrease through time (Linear regression, 1120: R2= 0.73, p = 0.017; 1400: R2= 0.97, p = < 0.001; 2000:
R2= 0.86, p < 0.01; 3000: R2= 0.93, p = 0.001).
SFA:PUFA sd SFA:MUFA sd MUFA:PUFA sd
Calanus 1.67 0.14 3.48 1.03 0.48 0.1
Micro-fraction 12.13 4.32 5.74 2.1 2.3 0.96
Nano-fraction 1.41 0.33 3.19 1.37 0.52 0.22
Pico-fraction 3.2 1.24 3.1 1.36 1.12 0.54
Table 1. Ratios of FA in the copepod Calanus finmarchicus to different phytoplankton size fractions (micro: 10–100 μm, nano: 2.7–10 μm, pico: 0.3–2.7 μm). Ratios are shown for different FA classes: Saturated (SFA), Monounsaturated (MUFA) and Polyunsaturated (PUFA). Bold values show the similarity between C.
finmarchicus and the nano-size phytoplankton fraction.
small-sized cells can cause a decline in feeding efficiency of large copepods, such as C. finmarchicus, irrespective of their feeding mechanism18. Therefore, the observed decrease in the C. finmarchicus PUFA content at high pCO2 conditions may be a combined consequence of a CO2-driven deterioration of the food quality and prey availability.
Our study provides the first evidence that a CO2-driven shift in community composition and associated change in food quality in terms of FA at the base of the food web can be transferred to primary consumers in a natural marine assemblage. A diatom grown at 750 μ atm pCO2 showed a PUFA decrease of ~20% that, when used to feed a copepod, produced a ~29% PUFA reduction in them with a concomitant decline in both somatic growth and egg production of ~85%19. For fish it has been shown that a decrease of just 0.6% in the amount of n-3 FA in the food source can reduce their egg viability by ~10% and larval survival by ~15%22. Given that fish is a critical natural resource24, acidification-driven FA quality deterioration may reduce the availability of essential PUFA in human diets25. Nonetheless, the plankton community response to OA will strongly depend on how changes in CO2 affect species composition of primary producers, whereby genetic and physiological diversity in natural assemblages may buffer adverse CO2 effects17,26.
Methods
An in situ mesocosm CO2 perturbation experiment in Raunefjord, southern Norway was performed during late spring 2011 using nine enclosures with a length of 25 m containing ~75 m3 of natural seawater. The mesocosms were set up and manipulated as described in detail by Riebesell et al.27. The carbonate system was manipulated through the addition of CO2-saturated seawater to seven of the nine mesocosms in four steps between days 0 to 3 to achieve target values of 380, 560, 840, 1120, 1400, 2000 and 3000 μ atm plus one control unit with a natural concentration of 280 μ atm. Samples for the calculation of the pCO2 in each mesocosm were taken every sampling day, and was calculated based on measurements of total alkalinity, pH (in total scale), salinity and temperature, using the computer program CO2SYS28. Samples for total alkalinity measurements were filtered on a Whatman GF/F filter and measured by open-cell acidimetric titration as describes by Dickson (2010)29. pH was measured spectrophotometrically with a VARIAN Cary 100 in 10 cm cuvette at 25°C and then recalculated to in-situ tem- perature as described in Dickson (2010)29. The precision on the pH measurements was typically over 0.001 units at high and 0.002 units at low pH. Vertical profiles of temperature and conductivity were taken daily in each mesocosm with a CTD60M (Sun and Sea Technologies). The measurements of pCO2, pH and inorganic nutrients for all nine mesocosm are provided in Table S2.
On day 14, nitrate and phosphate were added to all mesocosms to a final concentration of 5 and 0.2 μ mol l−1, respectively. Samples for phytoplankton counts and flow cytometry were taken every second day and for fatty acids every fourth day using a depth-integrated water sampler (Hydrobios, Kiel, Germany) covering the upper 20 m of the water column from days 1 to 25; integrated zooplankton net tows were taken every 7th day starting the day before the CO2 manipulation (day-1) until day 33. Phytoplankton cell counts were carried out from 50 ml sample water, fixed with alkaline Lugol’s iodine (1% final concentration) using an Utermöhl chamber with an inverted microscope (ZEISS Axiovert 100) and identified up to species level when possible (Table S3).
Picoplankton cells were enumerated using a bench-top Becton Dickinson FACSCalibur flow cytometer (FCM) equipped with a 488 nm argon laser. Biovolume was calculated according to geometric shapes and converted to cellular organic carbon using taxon-specific conversion equations; for micro- and nanophytoplankton accord- ing to Menden-Deuer30, and for picophytoplankton according to Worden et al.31. For algal FA, 1 L of seawater was filtered in three size fractions: 100 to 10 μ m (micro), 10 to 2.7 μ m (nano) and 2.7 to 0.3 μ m (pico) by using, non-combusted Millipore NY1002500 (10 μ m ø pore), Whatman GF/D (2.7 μ m ø pore) pre-combusted (450 °C, 6 h) and Advantec Grade GF 75 (0.3 μ m ø pore) filters, respectively. Individuals of the copepod Calanus finmarchicus (copepodite stage V) were sorted for FA measurements. All samples were immediately stored at − 80°C until analysis. FA were measured by gas chromatography as fatty acid methyl esters (FAME) fol- lowing Klein Breteler et al.32. FAME were analyzed by a Thermo GC Ultra gas chromatograph equipped with a non-polar column (RXI1-SIL-MS 0.32 μ m, 30 m, company Restek) and Flame ionization detector and were clustered according to their degree of saturation: saturated (SFA), monounsaturated (MUFA) and polyunsatu- rated (PUFA).
To identify differences in the relative content of FAs between the treatments a nested Mixed Effects Model (MEM) was used to determine the differences in relative fatty acid content (%) between the CO2 treatments (μ atm) through time, with the treatment level as nested random variable (random distribution of CO2 treatments among the mesocosm). Mann-Kendall trend test was applied to analyze for monotonic trends in the data to determine the temporal change for plankton taxonomic groups in terms of calculated biomass throughout the
www.nature.com/scientificreports/
experiment. Slopes were expressed as % day−1 by dividing the experimental mean of the variable; in the case of the picoeukaryotes, where the biomass distribution was non-monotonic, MEM analysis as described above was per- formed. The similarity in the structure of the plankton community between the treatments in terms of calculated species biomass in the mesocosm was analyzed by Non Metrical Multidimensional Scaling (NMDS) with Bray distance, auto-transformation and 4 dimensions (k = 4). An analysis of similarity (ANOSIM) using a Bray-Curtis distance matrix and 5000 permutations was used to corroborate the NMDS results. All statistical analyses were done using the R software environment 3.0.133.
References
1. Arts, M. & Kohler, C. In Lipids in aquatic ecosystems 1st edn (eds Arts, M. et al.) Ch. 9, 237–256 (Springer, 2009).
2. Hoshida, H. et al. Accumulation of eicosapentaenoic acid in Nannochloropsis sp. in response to elevated CO2 concentrations. J. Appl.
Phycol. 17, 29–34 (2005).
3. Tsuzuki, M. et al. Effects of CO2 concentration during growth on fatty acid composition in microalgae. Plant Physiol. 93, 851–6 (1990).
4. Fiorini, S., Gattuso, J.-P., van Rijswijk, P. & Middelburg, J. Coccolithophores lipid and carbon isotope composition and their variability related to changes in seawater carbonate chemistry. J. Exp. Mar. Bio. Ecol. 394, 74–85 (2010).
5. Torstensson, A. et al. Synergism between elevated pCO2 and temperature on the Antarctic sea ice diatom Nitzschia lecointei.
Biogeosciences 10, 6391–6401 (2013).
6. Bermúdez, R. et al. Long-term conditioning to elevated pCO2 and warming influences the fatty and amino acid composition of the diatom Cylindrotheca fusiformis. PLoS One 10, e0123945 (2015).
7. Müller-Navarra, D. C. et al. Unsaturated fatty acid content in seston and tropho-dynamic coupling in lakes. Nature 427, 69–72 (2004).
8. Galloway, A. W. E. & Winder, M. Partitioning the relative importance of phylogeny and environmental conditions on phytoplankton fatty acids. PLoS One 10(6), e0130053, doi: 10.1371/journal.pone.0130053 (2015).
9. Feng, Y. et al. Effects of increased pCO2 and temperature on the North Atlantic spring bloom. I. The phytoplankton community and biogeochemical response. Mar. Ecol. Prog. Ser. 388, 13–25 (2009).
10. Tatters, A. et al. Short-and long-term conditioning of a temperate marine diatom community to acidification and warming. Phil.
Trans. R. Soc. B. 368, 20120437 (2013).
11. Newbold, L. K. et al. The response of marine picoplankton to ocean acidification. Environ. Microbiol. 14, 2293–307 (2012).
12. Brussaard, C. P. D. et al. Arctic microbial community dynamics influenced by elevated CO2 levels. Biogeosciences 10, 719–731 (2013).
13. Pörtner, H. O. et al. in Climate change 2014: Impacts, adaptation and vulnerability (eds Drinkwater, K. et al.) Ch. 6. 1–138 (Cambridge University Press, 2014).
14. Engel, A. et al. Testing the direct effect of CO2 concentration on a bloom of the coccolithophorid Emiliania huxleyi in mesocosm experiments. Limnol. Oceanogr. 50, 493–507 (2005).
15. Patil, V. et al. Fatty acid composition of 12 microalgae for possible use in aquaculture feed. Aquac. Int. 15, 1–9 (2006).
16. Sato, N., Tsuzuki, M. & Kawaguchi, A. Glycerolipid synthesis in Chlorella kessleri 11 h II. Effect of the CO2 concentration during growth. Biochim. Biophys. Acta 1633, 35–42 (2003).
17. Leu, E. et al. Effect of ocean acidification on the fatty acid composition of a natural plankton community. Biogeosciences 10, 1143–1153 (2013).
18. Kiørboe, T. How zooplankton feed: mechanisms, traits and trade-offs. Biol. Rev. 86, 311–39 (2011).
19. Rossoll, D. et al. Ocean acidification-induced food quality deterioration constrains trophic transfer. PLoS One 7(4), e34737, doi:
10.1371/journal.pone.0034737 (2012).
20. Nejstgaard, J., Båmstedt, U. & Bagøien, E. Feeding and reproduction by Calanus finmarchicus, and microzooplankton grazing during mesocosm blooms of diatoms and the coccolithophore Emiliania huxleyi. Mar. Ecol. Prog. Ser. 147, 197–217 (1997).
21. Harris, R. et al. Feeding, growth, and reproduction in the genus Calanus. ICES J. Mar. Sci. 57, 1708–1726 (2000).
22. Izquierdo, M., Fernández-Palacios, H. & Tacon, A. G. Effect of broodstock nutrition on reproductive performance of fish.
Aquaculture 197, 25–42 (2001).
23. Mayor, D. et al. CO2-induced acidification affects hatching success in Calanus finmarchicus. Mar. Ecol. Prog. Ser. 350, 91–97 (2007).
24. Food and Agriculture Organization of the United Nations. in The State of World Fisheries and Aquaculture 2014 1st edn. Ch. 1, 62–68 (FAO, 2014).
25. Kang, J. X. Omega-3: a link between global climate change and human health. Biotechnol. Adv. 29, 388–90 (2011).
26. Rossoll, D., Sommer, U. & Winder, M. Community interactions dampen acidification effects in a coastal plankton system. Mar. Ecol.
Prog. Ser. 486, 37–46 (2013).
27. Riebesell, U. et al. Technical Note: A mobile sea-going mesocosm system – new opportunities for ocean change research.
Biogeosciences 10, 1835–1847 (2013).
28. Lewis, E. & Wallace, D. in Program developed for CO2 system calculations ORNL/CDIAC-105. 54 pp. (U.S. Department of Energy, 1998).
29. Dickson, A. G. in Guide to Best Practices in Ocean Acidification Research and Data Reporting 1st edn. (eds Riebesell, U. et al.) Ch. 1, 17–40 (Publications Office of the European Union, 2010).
30. Menden-Deuer, S. & Lessard, E. J. Carbon to volume relationships for dinoflagellates, diatoms, and other protist plankton. Limnol.
Oceanogr. 45, 569–579 (2000).
31. Worden, A. Z., Drive, G., Jolla, L. & Nolan, J. K. Assessing the dynamics and ecology of marine picophytoplankton : The importance of the eukaryotic component. Limnol. Oceanogr. 49, 168–179 (2004).
32. Breteler, W., Schogt, N. & Baas, M. Trophic upgrading of food quality by protozoans enhancing copepod growth: role of essential lipids. Mar. Biol. 191–198 (1999).
33. R Development Core Team. R: A language and environment for statistical computing. (2013) Available at: http://www.r-project.org/
(Accesed 10th September 2014).
Acknowledgements
We thank Daniela Freese, Hendrik Schultz, Andrea Ludwig and Thomas Hansen for laboratory and technical assistance. This work is a contribution to the BMBF coordinated projects “Surface Ocean Processes in the Anthropocene” (SOPRAN), and “Biological Impacts of Ocean Acidification” (BIOACID) funded by the German Federal Ministry of Education and Research (BMBF) under contract numbers 03F0611C and 03F0608B, and to the Marie Curie IRG grant No. 276917.
or other third party material in this article are included in the article’s Creative Commons license, unless indicated otherwise in the credit line; if the material is not included under the Creative Commons license, users will need to obtain permission from the license holder to reproduce the material. To view a copy of this license, visit http://creativecommons.org/licenses/by/4.0/