Supplementary Information
Ocean acidification reduces transfer of essential biomolecules in a natural plankton community
J. Rafael Bermúdez1,2*, Ulf Riebesell1 , Aud Larsen3, Monika Winder1,4
1GEOMAR | Helmholtz Centre for Ocean Research Kiel, Germany.
2Facultad de Ingeniería Marítima, Ciencias Biológicas, Oceánicas y Recursos Naturales. Escuela Superior Politécnica del Litoral, ESPOL, Guayaquil, Ecuador.
3The Hjort Centre for Marine Ecosystem Dynamics, Uni Research Environment, 5008 Bergen, Norway.
4Department of Ecology, Environment and Plant Sciences, Stockholm University, Sweden.
*Contact: jrbermud@espol.edu.ec
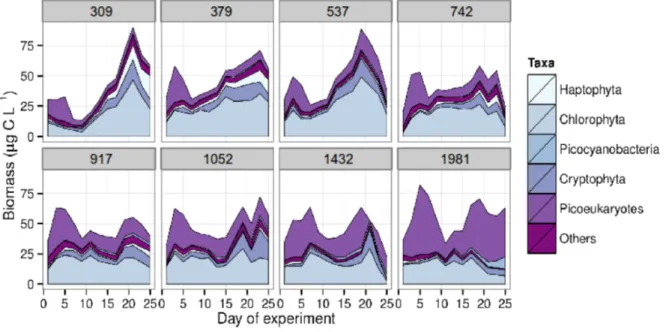
Figure S1: Plankton biomass of the dominant taxonomic groups in the different CO2 treatments. Each treatment is labelled with its target CO2 level (top, µatm).
Nutrients were added at day 14. Phytoplankton biomass displayed a short-lived small bloom at the start of the experiment and a more pronounced bloom after
nutrient addition.
Figure S2: Non Metrical Multidimensional Scaling (NMDS) of the plankton community composition in terms of calculated biomass change through sampling
days and CO2 treatment. The NMDS 1 axis show that the phytoplankton communities strongly diverge through time, while the NMDS 2 axis show that the communities split between high (top) and low (bottom) CO2 treatment levels. An Analysis of Similarity showed a significant difference on community composition
between days (ANOSIM statistic R: 0.4, p= 0.0002) while the analysis between CO2 treatments although significant was weaker (ANOSIM R: 0.17, p= 0.0002).
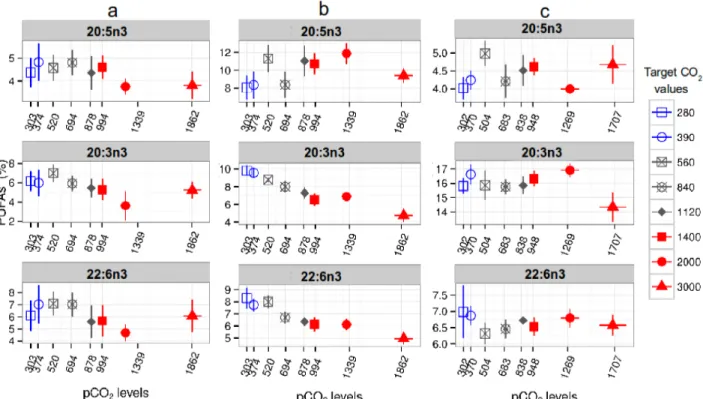
Figure S3: Relative content of the most abundat PUFA in the pico-size (a), nano- size (b) and Calanus finmarchicus (c) during the experiment (pico-size: 0.3-2.7
µm, nano-size: 2.7-10 µm) in the different pCO2 treatments during the experiment. A mixed effect model analysis (MEM) showed that 20:5n3 presented
no CO2 related effect in any group (p>0.05). The 20:3n3 showed a CO2 effect in the nano size fractions (MEM, F=10.33, p<0.05) and C. finmarchicus (MEM, F=8.21, p<0.05). The 22:6n3 showed a significant CO2 effect only in the Nano-
size fraction (MEM, F=11.86, p< 0.05).
a
b
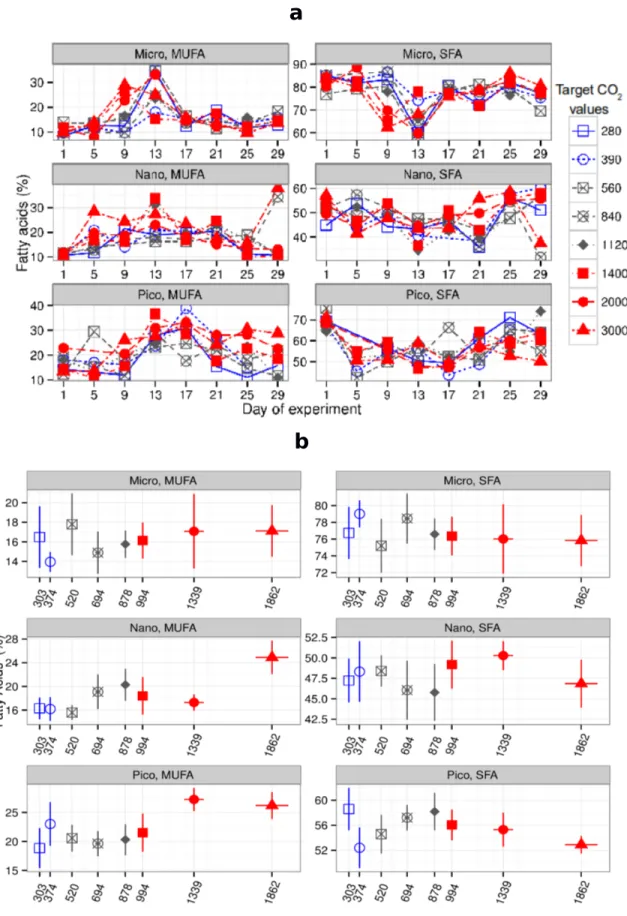
Figure S4: Relative plankton MUFA and SFA content during the experiment in different size fractions (micro: 10-100 µm, nano: 2.7-10 µm,pico: 0.3-2.7 µm) a)
through time, and b) in the different pCO2 treatments.
a
b
Figure S5: Relative MUFA and SFA content in the copepod Calanus finmarchicus a) through time, and b) in the different pCO2 treatments.
Table S1: Ratios of different FA classes of the copepod Calanus finmarchicus and to different phytoplankton size fractions (micro: >10 µm, nano: 2.7-10 µm,pico:
<2.7 µm) at day 1 and day 25. Ratios are shown for Saturated (SFA), Monounsaturated (MUFA) and Polyunsaturated (PUFA) fatty acids. Values in bold
font type highlighted the similarity between C. finmarchicus and the nano-size phytoplankton fraction.
Day 1 SFA:PUFA sd SFA:MUFA sd MUFA:PUFA sd
Calanus 1.56 0.12 3.58 0.28 0.44 0.04
Micro-fraction 14.69 3.7 8.05 1.39 1.75 0.45
Nano-fraction 1.38 0.21 4.67 0.54 0.29 0.02
Pico-fraction 5.06 1.37 4.35 1.06 1.25 0.59
Day 25
Calanus 1.81 0.04 3.82 0.33 0.48 0.05
Micro-fraction 13.28 3.01 6.79 1.25 1.95 0.16
Nano-fraction 1.74 0.26 4.45 1.09 0.41 0.12
Pico-fraction 3.44 0.78 3.43 1.58 1.19 0.62
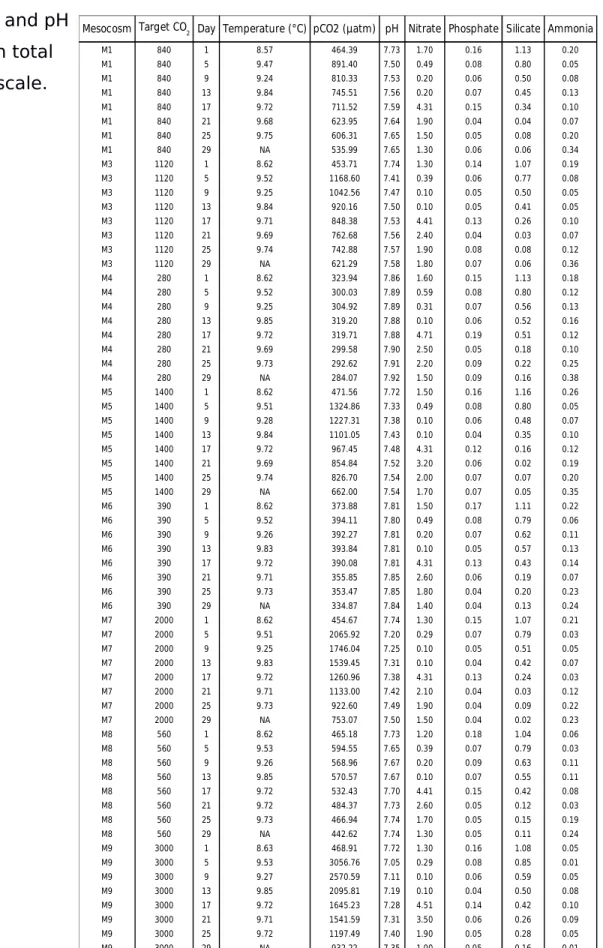
Table S2: Physical variables measured during the experiment when FA seston samples were taken. Nitrate, phosphate, silicate and ammonia are given in μmol l−1 and pH
in total scale.
Mesocosm Day Temperature (°C) pCO2 (µatm) pH Nitrate Phosphate Silicate Ammonia
M1 840 1 8.57 464.39 7.73 1.70 0.16 1.13 0.20
M1 840 5 9.47 891.40 7.50 0.49 0.08 0.80 0.05
M1 840 9 9.24 810.33 7.53 0.20 0.06 0.50 0.08
M1 840 13 9.84 745.51 7.56 0.20 0.07 0.45 0.13
M1 840 17 9.72 711.52 7.59 4.31 0.15 0.34 0.10
M1 840 21 9.68 623.95 7.64 1.90 0.04 0.04 0.07
M1 840 25 9.75 606.31 7.65 1.50 0.05 0.08 0.20
M1 840 29 NA 535.99 7.65 1.30 0.06 0.06 0.34
M3 1120 1 8.62 453.71 7.74 1.30 0.14 1.07 0.19
M3 1120 5 9.52 1168.60 7.41 0.39 0.06 0.77 0.08
M3 1120 9 9.25 1042.56 7.47 0.10 0.05 0.50 0.05
M3 1120 13 9.84 920.16 7.50 0.10 0.05 0.41 0.05
M3 1120 17 9.71 848.38 7.53 4.41 0.13 0.26 0.10
M3 1120 21 9.69 762.68 7.56 2.40 0.04 0.03 0.07
M3 1120 25 9.74 742.88 7.57 1.90 0.08 0.08 0.12
M3 1120 29 NA 621.29 7.58 1.80 0.07 0.06 0.36
M4 280 1 8.62 323.94 7.86 1.60 0.15 1.13 0.18
M4 280 5 9.52 300.03 7.89 0.59 0.08 0.80 0.12
M4 280 9 9.25 304.92 7.89 0.31 0.07 0.56 0.13
M4 280 13 9.85 319.20 7.88 0.10 0.06 0.52 0.16
M4 280 17 9.72 319.71 7.88 4.71 0.19 0.51 0.12
M4 280 21 9.69 299.58 7.90 2.50 0.05 0.18 0.10
M4 280 25 9.73 292.62 7.91 2.20 0.09 0.22 0.25
M4 280 29 NA 284.07 7.92 1.50 0.09 0.16 0.38
M5 1400 1 8.62 471.56 7.72 1.50 0.16 1.16 0.26
M5 1400 5 9.51 1324.86 7.33 0.49 0.08 0.80 0.05
M5 1400 9 9.28 1227.31 7.38 0.10 0.06 0.48 0.07
M5 1400 13 9.84 1101.05 7.43 0.10 0.04 0.35 0.10
M5 1400 17 9.72 967.45 7.48 4.31 0.12 0.16 0.12
M5 1400 21 9.69 854.84 7.52 3.20 0.06 0.02 0.19
M5 1400 25 9.74 826.70 7.54 2.00 0.07 0.07 0.20
M5 1400 29 NA 662.00 7.54 1.70 0.07 0.05 0.35
M6 390 1 8.62 373.88 7.81 1.50 0.17 1.11 0.22
M6 390 5 9.52 394.11 7.80 0.49 0.08 0.79 0.06
M6 390 9 9.26 392.27 7.81 0.20 0.07 0.62 0.11
M6 390 13 9.83 393.84 7.81 0.10 0.05 0.57 0.13
M6 390 17 9.72 390.08 7.81 4.31 0.13 0.43 0.14
M6 390 21 9.71 355.85 7.85 2.60 0.06 0.19 0.07
M6 390 25 9.73 353.47 7.85 1.80 0.04 0.20 0.23
M6 390 29 NA 334.87 7.84 1.40 0.04 0.13 0.24
M7 2000 1 8.62 454.67 7.74 1.30 0.15 1.07 0.21
M7 2000 5 9.51 2065.92 7.20 0.29 0.07 0.79 0.03
M7 2000 9 9.25 1746.04 7.25 0.10 0.05 0.51 0.05
M7 2000 13 9.83 1539.45 7.31 0.10 0.04 0.42 0.07
M7 2000 17 9.72 1260.96 7.38 4.31 0.13 0.24 0.03
M7 2000 21 9.71 1133.00 7.42 2.10 0.04 0.03 0.12
M7 2000 25 9.73 922.60 7.49 1.90 0.04 0.09 0.22
M7 2000 29 NA 753.07 7.50 1.50 0.04 0.02 0.23
M8 560 1 8.62 465.18 7.73 1.20 0.18 1.04 0.06
M8 560 5 9.53 594.55 7.65 0.39 0.07 0.79 0.03
M8 560 9 9.26 568.96 7.67 0.20 0.09 0.63 0.11
M8 560 13 9.85 570.57 7.67 0.10 0.07 0.55 0.11
M8 560 17 9.72 532.43 7.70 4.41 0.15 0.42 0.08
M8 560 21 9.72 484.37 7.73 2.60 0.05 0.12 0.03
M8 560 25 9.73 466.94 7.74 1.70 0.05 0.15 0.19
M8 560 29 NA 442.62 7.74 1.30 0.05 0.11 0.24
M9 3000 1 8.63 468.91 7.72 1.30 0.16 1.08 0.05
M9 3000 5 9.53 3056.76 7.05 0.29 0.08 0.85 0.01
M9 3000 9 9.27 2570.59 7.11 0.10 0.06 0.59 0.05
M9 3000 13 9.85 2095.81 7.19 0.10 0.04 0.50 0.08
M9 3000 17 9.72 1645.23 7.28 4.51 0.14 0.42 0.10
M9 3000 21 9.71 1541.59 7.31 3.50 0.06 0.26 0.09
M9 3000 25 9.72 1197.49 7.40 1.90 0.05 0.28 0.05
M9 3000 29 NA 932.22 7.35 1.00 0.05 0.16 0.01
Target CO2
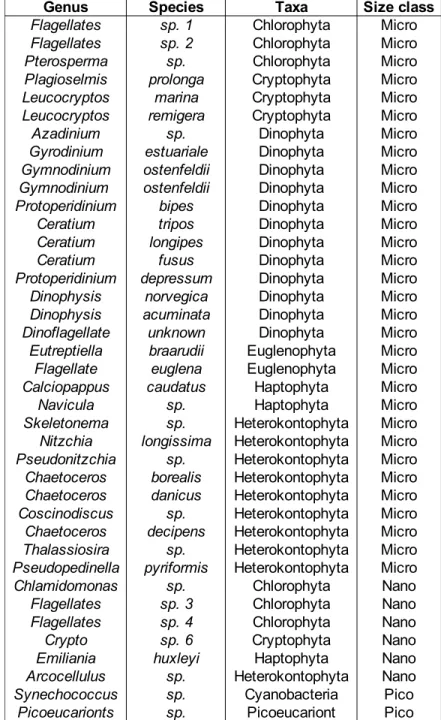
Table S3: Phytoplankton species identified in the mesocosms and their size class.
Genus Species Taxa Size class
Flagellates sp. 1 Chlorophyta Micro
Flagellates sp. 2 Chlorophyta Micro
Pterosperma sp. Chlorophyta Micro
Plagioselmis prolonga Cryptophyta Micro Leucocryptos marina Cryptophyta Micro Leucocryptos remigera Cryptophyta Micro
Azadinium sp. Dinophyta Micro
Gyrodinium estuariale Dinophyta Micro Gymnodinium ostenfeldii Dinophyta Micro Gymnodinium ostenfeldii Dinophyta Micro
Protoperidinium bipes Dinophyta Micro
Ceratium tripos Dinophyta Micro
Ceratium longipes Dinophyta Micro
Ceratium fusus Dinophyta Micro
Protoperidinium depressum Dinophyta Micro Dinophysis norvegica Dinophyta Micro Dinophysis acuminata Dinophyta Micro Dinoflagellate unknown Dinophyta Micro Eutreptiella braarudii Euglenophyta Micro Flagellate euglena Euglenophyta Micro Calciopappus caudatus Haptophyta Micro
Navicula sp. Haptophyta Micro
Skeletonema sp. Heterokontophyta Micro Nitzchia longissima Heterokontophyta Micro Pseudonitzchia sp. Heterokontophyta Micro Chaetoceros borealis Heterokontophyta Micro Chaetoceros danicus Heterokontophyta Micro Coscinodiscus sp. Heterokontophyta Micro Chaetoceros decipens Heterokontophyta Micro Thalassiosira sp. Heterokontophyta Micro Pseudopedinella pyriformis Heterokontophyta Micro
Chlamidomonas sp. Chlorophyta Nano
Flagellates sp. 3 Chlorophyta Nano
Flagellates sp. 4 Chlorophyta Nano
Crypto sp. 6 Cryptophyta Nano
Emiliania huxleyi Haptophyta Nano
Arcocellulus sp. Heterokontophyta Nano
Synechococcus sp. Cyanobacteria Pico
Picoeucarionts sp. Picoeucariont Pico