www.biogeosciences.net/13/4707/2016/
doi:10.5194/bg-13-4707-2016
© Author(s) 2016. CC Attribution 3.0 License.
Ocean acidification decreases plankton respiration: evidence from a mesocosm experiment
Kristian Spilling1,2, Allanah J. Paul3, Niklas Virkkala2, Tom Hastings4, Silke Lischka3, Annegret Stuhr3, Rafael Bermúdez3,5, Jan Czerny3, Tim Boxhammer3, Kai G. Schulz6, Andrea Ludwig3, and Ulf Riebesell3
1Marine Research Centre, Finnish Environment Institute, P.O. Box 140, 00251 Helsinki, Finland
2Tvärminne Zoological Station, University of Helsinki, J. A. Palménin tie 260, 10900 Hanko, Finland
3GEOMAR Helmholtz Centre for Ocean Research Kiel, Düsternbrooker Weg 20, 24105 Kiel, Germany
4Department of Biology, University of Portsmouth, University House, Winston Churchill Avenue, Portsmouth PO1 2UP, UK
5Facultad de Ingeniería Marítima, Ciencias Biológicas, Oceánicas y Recursos Naturales, ESPOL, Escuela Superior Politécnica del Litoral, Guayaquil, Ecuador
6Centre for Coastal Biogeochemistry, Southern Cross University, Military Road, East Lismore, NSW 2480, Australia Correspondence to:Kristian Spilling (kristian.spilling@environment.fi)
Received: 27 November 2015 – Published in Biogeosciences Discuss.: 15 January 2016 Revised: 27 July 2016 – Accepted: 28 July 2016 – Published: 22 August 2016
Abstract. Anthropogenic carbon dioxide (CO2) emissions are reducing the pH in the world’s oceans. The plankton com- munity is a key component driving biogeochemical fluxes, and the effect of increased CO2 on plankton is critical for understanding the ramifications of ocean acidification on global carbon fluxes. We determined the plankton commu- nity composition and measured primary production, respira- tion rates and carbon export (defined here as carbon sink- ing out of a shallow, coastal area) during an ocean acidi- fication experiment. Mesocosms (∼55 m3)were set up in the Baltic Sea with a gradient of CO2levels initially rang- ing from ambient (∼240 µatm), used as control, to high CO2 (up to ∼1330 µatm). The phytoplankton community was dominated by dinoflagellates, diatoms, cyanobacteria and chlorophytes, and the zooplankton community by pro- tozoans, heterotrophic dinoflagellates and cladocerans. The plankton community composition was relatively homoge- nous between treatments. Community respiration rates were lower at high CO2 levels. The carbon-normalized respira- tion was approximately 40 % lower in the high-CO2 envi- ronment compared with the controls during the latter phase of the experiment. We did not, however, detect any effect of increased CO2on primary production. This could be due to measurement uncertainty, as the measured total particu- lar carbon (TPC) and combined results presented in this spe- cial issue suggest that the reduced respiration rate translated
into higher net carbon fixation. The percent carbon derived from microscopy counts (both phyto- and zooplankton), of the measured total particular carbon (TPC), decreased from
∼26 % at t0 to ∼8 % at t31, probably driven by a shift towards smaller plankton (< 4 µm) not enumerated by mi- croscopy. Our results suggest that reduced respiration leads to increased net carbon fixation at high CO2. However, the increased primary production did not translate into increased carbon export, and consequently did not work as a negative feedback mechanism for increasing atmospheric CO2 con- centration.
1 Introduction
The ocean is a large sink of carbon dioxide (CO2)and ab- sorbs around 25 % of annual anthropogenic CO2emissions (Le Quéré et al., 2009). CO2is a weak acid when dissolved in water, and the increasing global atmospheric CO2concen- tration has reduced the average pH in the ocean by approx- imately 0.1 since the start of the Industrial Revolution (Orr, 2011). This pH reduction, with a concurrent increase in dis- solved inorganic carbon, is called ocean acidification. Fol- lowing the same trajectory, the pH could decline further by as much as 0.7 by 2300 (Zeebe et al., 2008).
The topic of ocean acidification has received a lot of at- tention over the past decade. There is a relatively good un- derstanding of the rate of change in pH and the effects on the ocean’s carbon chemistry (Zeebe and Ridgwell, 2011).
There are also a range of studies documenting the effects of decreasing pH on marine life, but the effect studied is often species- or ecosystem-specific and based on short-term per- turbation experiments (Riebesell and Tortell, 2011). There are still a lot of uncertainties as to what effect ocean acidifi- cation has on biological processes.
The key driving force in marine biogeochemical element cycling is the planktonic community that occupies the sunlit surface of the ocean. Primary producers use the energy from sunlight to take up CO2 and fix carbon into organic com- pounds. Respiration is the opposite process, where organic carbon is oxidized, providing energy and releasing CO2. This takes place at all trophic levels, from bacteria through to zoo- plankton, fish and marine mammals. At steady state, produc- tion and respiration are balanced. On a global scale, there is presently a surplus of organic matter being produced in the upper ocean through photosynthesis. The extra organic car- bon is exported out of the surface layers to the deep ocean, where it is sequestered for the foreseeable future, a process referred to as the biological carbon pump (Volk and Hof- fert, 1985; Siegenthaler and Sarmiento, 1993; Ducklow et al., 2001). In the case of coastal seas, part of the carbon is buried at the sea floor (Dunne et al., 2007).
The greater the difference between primary production and respiration, the more carbon can potentially be exported, and ocean acidification has the potential to affect this bal- ance. Generally, more CO2 stimulates photosynthetic car- bon fixation, as CO2becomes more readily available for the key photosynthetic enzyme RuBisCO (Falkowski and Raven, 2013); however, increased primary production at high CO2 concentration is not always recorded (Sobrino et al., 2014) and the response is variable between different taxa (Mackey et al., 2015). In cases where additional carbon is fixed, it may be excreted as dissolved organic carbon (DOC), pro- viding carbon for bacterial growth, and also increasing bac- terial respiration (Grossart et al., 2006; Piontek et al., 2010).
Changes in pH might also directly affect both primary pro- duction (Spilling, 2007) and respiration (Smith and Raven, 1979).
The Baltic Sea is an almost landlocked sea with low alka- linity (Beldowski et al., 2010) and is thus particularly suscep- tible to variation in seawater pH. Because of the reduced wa- ter exchange with the North Atlantic and the large catchment area (population∼80 million), it is also subjected to a range of other environmental pressures, in particular increased nu- trient inputs from human activities, i.e., eutrophication. Eu- trophication has led to increased primary production and chlorophylla (Chla)biomass over the past decades in the Gulf of Finland (Raateoja et al., 2005), benefitting chrys- ophytes, chlorophytes and cyanobacteria (Suikkanen et al., 2007). Dense blooms of diazotroph cyanobacteria are com-
mon in the summer, which further aggravates the eutroph- ication problem as nitrogen fixation introduces substantial amounts of new nitrogen into the system (Savchuk, 2005).
The effect of ocean acidification on this type of system is largely unexplored. In order to investigate the effect of in- creased CO2(and lower pH) on primary production and total plankton respiration in the pelagic zone, we measured car- bon fixation, oxygen consumption and export/sedimentation rates during a CO2-manipulation study set up in the Gulf of Finland, Baltic Sea (further references within this special is- sue).
2 Materials and methods 2.1 Experimental setup
Six pelagic mesocosms (approximately 55 m3)were moored at Storfjärden, on the southwest coast of Finland (59◦51.50N, 23◦15.50E), on 12 June 2012. The water depth at the moor- ing site is approximately 30 m and the mesocosms extended from the surface down to 19 m depth. A more detailed de- scription of the mesocosm bags and the experimental area can be found in Paul et al. (2015), and the data in Paul et al.
(2016) and Spilling et al. (2016b).
Ont−5 (17 June 2012, 5 days before the first CO2 en- richment), the mesocosms were bubbled with compressed air to break down any existing pycnocline and ensure homoge- neous water mass distribution. Different CO2concentrations in the bags were achieved by adding filtered (50 µm), CO2- saturated seawater. This was done stepwise in four separate additions to reduce the shock of rapid change in pH for the plankton community. The first addition took place after sam- pling ont0; thus,t1 was the first day with a CO2treatment.
The CO2-enriched water was evenly distributed over the up- per 17 m using a specially designed distribution device, i.e.,
“spider” (Riebesell et al., 2013). Two controls and four treat- ment mesocosms were used. Filtered water (with ambient CO2 concentration) was added to the control mesocosms at the time when CO2was manipulated in the treatment meso- cosms. The CO2fugacity gradient ont4, after the four addi- tions, ranged from ambient (∼240 µatmfCO2)in the two control mesocosms (M1 and M5) to∼1650 µatmfCO2, but we used the averagefCO2 throughout the relevant part of this experiment (from t1–t31) to denote the different treat- ments: 346 (M1), 348 (M5), 494 (M7), 868 (M6), 1075 (M3) and 1333 µatmfCO2(M8). Ont15, additional CO2-enriched seawater was added to the upper 7 m in the same manner as the initial enrichment to counteract outgassing of CO2. The mesocosm bags were regularly cleaned to prevent wall growth. A more detailed description of the treatment and cleaning can be found in Paul et al. (2015).
Mesocosm sampling was carried out every day (or ev- ery second day for some variables) in the morning. Two different depth-integrated water samples (0–10 and 0–17 m)
were taken using integrating water samplers (IWS, HYDRO- BIOS, Kiel). The water was collected into plastic carboys (10 L) and brought to the laboratory for subsampling and subsequent analysis of plankton community composition and carbon concentration, as well as for respiration and primary production incubations. Sub-samples for primary production and respiration measurements were treated and stored min- imizing the contact with air in order to prevent any gas ex- change.
Settling particles were quantitatively collected in the sedi- ment traps at the bottom end of the mesocosm units at 19 m depth. Every 48 h the accumulated material was vacuum- pumped through a silicon tube to the sea surface and trans- ferred into 5 L glass bottles for transportation to the labora- tory. For a more detailed description of the sampling proce- dure and sample processing of the sediment see Boxhammer et al. (2016).
2.2 Phytoplankton community
Phytoplankton cells were counted in 50 mL subsamples, which were fixed with acidic Lugol’s iodine solution (1 % final concentration) with an inverted microscope (Zeiss Axiovert 100) after Utermöhl (1958). The cells > 20 µm were counted either from half of the chamber at 100-fold or on three to four strips at 200-fold magnification. Filamentous cyanobacteria were counted in 50 µm length units. Cells 12–
20 µm were counted at half of the chamber at 200-fold mag- nification, and cells 4–12 µm were counted at 400-fold mag- nification on two radial strips. The phytoplankton counts of the smaller size classes (< 20 µm) stopped ont29, and these results have been used together with thet31 results for larger (> 20 µm) phytoplankton as the end date of the experiment.
Further details can be found in Bermúdez et al. (2016) Phytoplankton, heterotrophic dinoflagellates and protozoa were identified with the help of Tomas (1997), Hoppen- rath et al. (2009) and Kraberg et al. (2010). Biovolumes of counted plankton cells were calculated according to Olenina et al. (2006) and converted to cellular organic carbon quotas by the equations of Menden-Deuer and Lessard (2000).
2.3 Microzooplankton community
Ciliates were enumerated from 50 mL subsamples every second day with a Zeiss Axiovert 100 inverted micro- scope (Utermöhl 1958) at 200-fold magnification. At high cell numbers (> 400 cells), half the bottom plate area was counted. If less than 400 cells were found in the first half of the bottom plate area, the entire chamber was counted.
Rare species were counted on the whole bottom plate. Cil- iates were identified to the lowest possible taxonomic level (genus/species) according to Setälä et al. (1992) and Telesh et al. (2009) as well as description plates found on the Plank- tonic Ciliate Project website (http://ciliate.zooplankton.cn/).
For more details see Lischka et al. (2015) in this issue.
2.4 Mesozooplankton community
The term zooplankton includes here all metazoan species, i.e., organisms belonging, strictly speaking, to either the micro- or mesozooplankton. Zooplankton samples were col- lected by net hauls from 17 m depth with an Apstein net of 17 cm diameter and 100 µm mesh size. After closing of the mesocosm bags, zooplankton samples were taken prior to the CO2 addition on t0 and at t17 and t31 (there were also other sampling days for zooplankton, but these are not included here). Samples were preserved in 70 % ethanol.
Zooplankton was counted assuming 100 % filtering effi- ciency of the net. The samples were divided with a Fol- som plankton splitter (1:2, 1:4, 1:8, 1:16, and 1:32) and aliquots were counted using a WILD M3B stereo mi- croscope. Abundant species/taxa were enumerated from sub- samples (> 30 individuals in an aliquot), while less abundant and rare species/taxa were counted from the whole sample.
For more details on mesozooplankton collection, processing and species determination, see Lischka et al. (2015). Carbon biomass (CB) in µmol C L−1 was calculated using the dis- placement volume (DV) and the equation of Wiebe (1988):
(Log DV+1.429)/0.82=log CB. (1) 2.5 Total particulate carbon
Samples for total particulate carbon (TPC) measurements were subsampled from 10 L carboys and filtered onto GF/F filters (Whatman, nominal pore size of 0.7 µm, diame- ter=25 mm) under reduced vacuum (< 200 mbar). Sampling for TPC occurred every second day fromt−3 until the end of the experiment. Filters were stored in glass Petri dishes at−20◦C directly after filtration until preparation of sam- ples for analyses. Petri dishes and filters were combusted at 450◦C for 6 h before use.
Samples were analyzed for TPC (organic+inorganic) as no acidifying step was made to remove particulate inorganic carbon. Filters were dried at 60◦C and packed into tin cap- sules and stored in a desiccator until analysis on an elemental analyzer (EuroEA) as described by Sharp (1974).
The particles collected from the sediment traps were al- lowed to settle down in the sampling flasks at in situ temper- ature before separation of supernatant and the dense parti- cle suspension at the bottom. TPC content of the supernatant was analyzed from 10–50 mL subsamples as described above for water column measurements. The dense particle suspen- sion was concentrated by centrifugation, then freeze-dried and ground to a very fine powder of homogeneous compo- sition. From this material, small subsamples of 1–2 mg were transferred into tin capsules and TPC content was analyzed analogously to the supernatant and water column samples.
Vertical carbon flux was calculated from the two measure- ments and is given as the daily amount of TPC (mmol) col- lected in the sediment traps per square meter of mesocosm surface area (3.142 m2).
2.6 Dissolved inorganic carbon
Samples for dissolved inorganic carbon (DIC) were gently pressure-filtered (Sarstedt Filtropur 0.2 µm) before measure- ments to remove all particulates. DIC concentrations were determined by infrared absorption (LICOR LI-7000 on an AIRICA system, Marianda). Four (2 mL) replicates were measured, and the final DIC concentration was calculated from the mean of the three most consistent samples.
2.7 Plankton community respiration
Samples for respiration rate measurements were subsampled from the depth integrated sample from the entire water col- umn (0–17 m). Oxygen was measured using a fiber opti- cal dipping probe (PreSens, Fibox 3), which was calibrated against anoxic (0 % O2, obtained by adding sodium dithion- ite) and air-saturated water (obtained by bubbling sampled water with air for 5 min followed by 15 min of stirring with a magnetic stirrer). The final O2concentration was calculated using the Fibox 3 software including temperature compensa- tion.
We filled three replicate 120 mL O2 bottles (without headspace) for each mesocosm. After the initial O2determi- nation, the bottles were put in a dark, temperature-controlled room, set to the ambient water temperature at the surface.
The O2concentration was determined again after an incuba- tion period of 48 h, and the oxygen consumption (i.e., res- piration rate) was calculated from the difference between the O2concentration before and after the incubation period. Res- piration rates were measured every dayt−3 tot31, with the exception of dayst2 andt14 because of technical problems.
2.8 Primary production
Primary production was measured using radio-labeled NaH14CO3(Steeman-Nielsen, 1952) from the 0–10 m depth integrated sample. The rational for using the upper (0–10 m) part of the mesocosm was the low light penetration depth, and 0–10 m was representative of the euphotic zone. The wa- ter was gently filled into 12 small (8 mL) scintillation vials per mesocosm, and 10 µL of14C bicarbonate solution (DHI Lab; 20 µCi mL−1) was added. The vials were filled com- pletely, and after adding the cap there was only a very small (2–3 mm) air bubble remaining corresponding to∼0.1 % of total volume.
Duplicate samples for each mesocosm were incubated just below the surface and at 2, 4, 6, 8 and 10 m depths for 24 h on small incubation platforms moored next to the mesocosms (Fig. S1 in the Supplement). In addition, a dark incubation (vials covered with aluminum foil) was carried out at the same location at 11 m depth.
After incubation, 3 mL of the sample was removed from each vial and acidified with 100 µL of 1 mol L−1HCl and then left without a lid for 24 h to ensure removal of remaining
inorganic 14C. Four milliliters of scintillation cocktail (In- stagel Plus, Perkin Elmer) was added, and the radioactivity was determined using a scintillation counter (Wallac 1414, Perkin Elmer). Primary production was calculated knowing the14C incorporation (with dark values subtracted) and the fraction of the14C addition to the total inorganic carbon pool according to Gargas (1975). The primary production incuba- tions were set up at the same time as the respiration incu- bations, but here we missed measurements for two periods, t1–t3 andt6–t8, due to loss of the incubation platform.
2.9 Data treatment
The average of the three respiration bottles was used to calcu- late the respiration rate. There were 2 days without measure- ments,t2 andt14, and for these days we estimated the respi- ration rate by using the average of the day before and after this day. TPC was measured only every second day, there- fore for the days without TPC measurements we normalized respiration to average TPC from the day before and the day after the respiration measurement.
The cumulative respiration was calculated by adding the total oxygen consumption for each day. When evaluating the data, there were two clear periods emerging from the exper- iment: the initial period t0 tot16 (Phase I) and the period fromt17 tot31 (Phase II), when the effect of the CO2 ad- dition was more evident. This division was also seen in, for example, Chla and temperature (Paul et al., 2015). Using the respiration data from Phase II we calculated the average respiration for each treatment by linear regression. From the linear regression, the standard error (SE) from the residuals and the coefficient of determination (R2)were calculated, in addition to a statistical test comparing the linear regression with a flat line, using SigmaPlot software.
The areal primary production was calculated based on a simple linear model of the production measurements from the different depths (Fig. S2). The cumulative primary pro- duction was carried out similar to respiration, but as the two missing periods were > 1 day, we did not estimate missing values, and the final cumulative production is therefore a slight underestimate (missing 6 days of production). We nor- malized the production data to the TPC in the euphotic zone, defined by the areal production model (Fig. S2).
From the two different phases of the experiment (Phases I and II;t0–t16 andt17–t31, respectively) we calculated the average for the different parameters and SE, with 9 and 7 sampling points during Phase I and II, respectively.
3 Results
3.1 Phytoplankton community composition
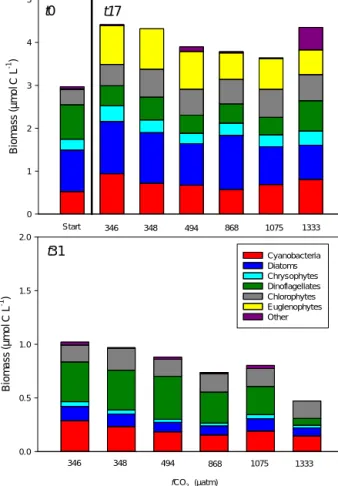
The phytoplankton community in the mesocosms was dom- inated by dinoflagellates, cyanobacteria, diatoms, chryso- phytes and chlorophytes at the start of the experiment
(Fig. 1). The two latter groups consisted almost exclusively of small cells (< 20 µm). There was an initial increase in phy- toplankton biomass from an average of 3 µmol C L−1 to a maximum of∼4.1 µmol C L−1in the two controls (M1 and M5), but at the end of Phase I (t0–t16) the biomass had de- clined and att17 it ranged between 3.2 and 3.5 µmol C L−1. During Phase I, large (> 20 µm) diatoms decreased in abun- dance and euglenophytes increased from a negligible group initially (0.5 % of the biomass) to constituting 15–25 % of the autotrophic biomass at t17. It was, however, the small (< 20 µm) phytoplankton cells (small diatoms, chrysophytes and chlorophytes) that made up the majority (70–80 %) of the counted autotroph biomass during Phase I.
During Phase II (t17–t31), there was a decline in phyto- plankton biomass to 0.5–1 µmol C L−1 and att31 dinoflag- ellates had become the dominating group in all treatments except at the highest CO2 level. Cyanobacteria and chloro- phytes were also abundant and the dominating groups in the highest CO2. There was no consistent difference between phytoplankton communities in the different CO2treatments, but dinoflagellate abundance was lower in the highest CO2 treatment (M8), and consequently the total phytoplankton biomass was lower in this treatment at t31. The relative in- crease in large dinoflagellates decreased the contribution of the smaller autotroph size class (4–20 µm) to 40–60 % of the counted phytoplankton biomass att31.
3.2 Zooplankton community composition
Protozoans, ciliates and heterotrophic dinoflagellates dom- inated the microzooplankton and constituted a major part (2.8 µmol C L−1) of the whole zooplankton community at the start of the experiment (Fig. 2). Protozoans, dominated by the choanoflagellateCalliacantha natans, decreased from the initial high concentrations during Phase I, in particular in the M1 control bag. The photosynthesizingMyrionecta rubra (i.e., Mesodinium rubrum) made up approximately half of the ciliate biomass att0, but both this species and the total biomass of ciliates decreased during Phase I. The biomass of heterotrophic dinoflagellates was relatively stable throughout Phase I but started to decrease during Phase II.
The mesozooplankton community was initially dominated by copepods, cladocerans and rotifers (Fig. 2). The aver- age initial biomass was 0.05 µmol C L−1 and increased to 0.13 µmol C L−1 at t17. During Phase I, copepods became the dominating group with > 50 % of the mesozooplankton biomass. In Phase II of the experiment, mesozooplankton biomass increased and was on average 0.27 µmol C L−1 at t31. This was caused by an increase in cladocerans, mainly Bosmina sp., whereas copepod biomass was more constant over the course of the experiment. The population peak of Bosmina sp. had slightly different timing in the different mesocosms but was higher in the mesocosms with added CO2, except for the highest CO2addition (M8).
Biomass(µmolCL-1)
0 1 2 3 4 5
Cyanobacteria Diatoms Chrysophytes Dinoflagellates Chlorophytes Euglenophytes Other
Start 346 348 494 868 1075 1333
Biomass(µmolCL-1 )
0.0 0.5 1.0 1.5 2.0
346 348 494 868 1075 1333
t0 t17
t31
fCO2 (µatm) 1
Fig 1 2 3
Figure 1.The main phytoplankton groups at the start of the exper- iment,t0, andt17 (upper panel) andt31 (lower panel). The initial (t0) was the average of all mesocosm bags. A more detailed descrip- tion of the temporal development in the phytoplankton community can be found in Bermúdez et al. (2016).
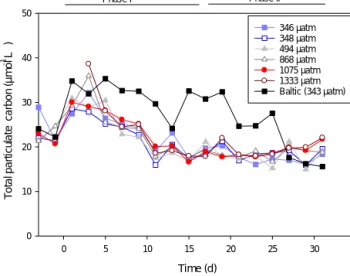
3.3 Total particulate carbon and export of carbon Average TPC was 22.5 µmol C L−1 at the beginning of the experiment, and after an initial increase to 32 µmol C L−1it decreased to 19.2 µmol C L−1att17 (Fig. 3). In the beginning of Phase II it was relatively stable and with no clear effect of CO2treatment, but at the end of the study period (t31) there was more TPC in the higher CO2treatments, and the increase in TPC during Phase II was highest in the CO2additions (Ta- ble 1). Att31 the average TPC was 19.9 µmol C L−1, rang- ing from 18.9±0.6 (SE) µmol C L−1in the two controls to 22.1 µmol C L−1in the highest CO2treatment.
The carbon accounted for by biologically active organisms counted in the microscope (phytoplankton and zooplankton) was initially 26 % of the TPC. Att17 andt31 this percentage decreased to∼20 and∼8 %, respectively.
The export of carbon, defined here as carbon settling out of the mesocosms, decreased during the experiment, and there was no effect of CO2concentration. The average export of TPC was in the range of 6.1–7.4 mmol C m−2d−1 during
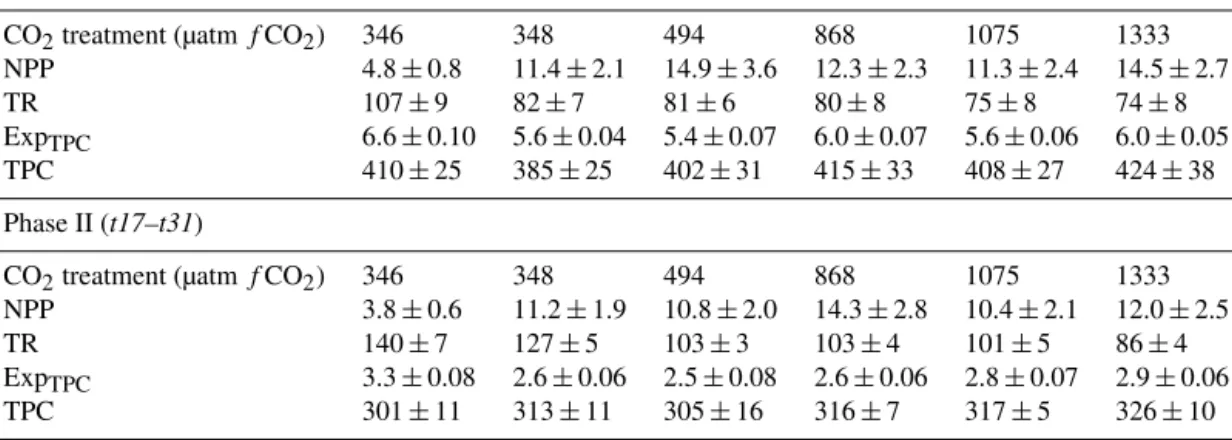
Table 1. Average net primary production (NPP), total respiration (TR) and exported total particulate carbon (ExpTPC) in mmol C m−2d−1±SE during Phase I and Phase II of the experiment. The pool of total particulate carbon (TPC) is the average during the two periods in mmol C m−2±SE. The standard error was calculated throughout the period: Phase I,n=9; Phase II,n=7. NPP and TR were corrected for the missing measuring days during Phase I. TR was measured as O2consumption and for comparison with carbon fixation we used a respiratory quotient (RQ) of 1.
Phase I (t0–t16)
CO2treatment (µatmfCO2) 346 348 494 868 1075 1333
NPP 4.8±0.8 11.4±2.1 14.9±3.6 12.3±2.3 11.3±2.4 14.5±2.7
TR 107±9 82±7 81±6 80±8 75±8 74±8
ExpTPC 6.6±0.10 5.6±0.04 5.4±0.07 6.0±0.07 5.6±0.06 6.0±0.05
TPC 410±25 385±25 402±31 415±33 408±27 424±38
Phase II (t17–t31)
CO2treatment (µatmfCO2) 346 348 494 868 1075 1333
NPP 3.8±0.6 11.2±1.9 10.8±2.0 14.3±2.8 10.4±2.1 12.0±2.5
TR 140±7 127±5 103±3 103±4 101±5 86±4
ExpTPC 3.3±0.08 2.6±0.06 2.5±0.08 2.6±0.06 2.8±0.07 2.9±0.06
TPC 301±11 313±11 305±16 316±7 317±5 326±10
Phase I (Table 1). This decreased to 2.5–3.3 mmol C m−2d−1 during Phase II.
3.4 Primary production and respiration
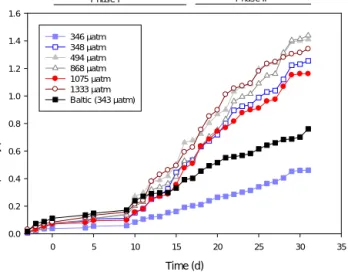
There was no clear effect of CO2addition on primary produc- tion (Fig. 4). There were relatively large daily variations in depth-integrated primary production depending on the light environment, and days with clear skies and more light in- creased carbon fixation. One of the control bags (M1) had clearly lower primary production from the very start of the experiment, and this was evident even before the initiation of the CO2addition (Fig. 4). The average production during the whole experiment was 3.67±0.42 (SE) mmol C m−2d−1in M1, and for all other bags 10.5±0.67 (SE) mmol C m−2d−1. Production on clear, sunny days was (except for M1) approx- imately 25 mmol C m−2d−1. The general pattern in areal pri- mary production was similar to TPC-normalized production (Table 1). Cumulative production values in mol C m−2 are presented in the Supplement (Fig. S3).
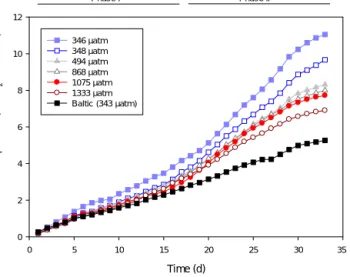
The respiration rate was higher in the ambient than the high-CO2 treatments (Fig. 5). In one of the two controls (M1), the respiration rate was clearly higher compared to all other treatments from the beginning of the experiment.
The respiration rate in the other control (M5) increased ap- proximately 2 weeks later than the CO2 treatments. After t17, the mesocosm with highest CO2 concentration (aver- age of 1333 µatm fCO2)started to have lower cumulative respiration compared to those with intermediate CO2levels (494–1075 µatmfCO2). After another week (∼t27), differ- ences between the intermediate CO2treatments became ap- parent. At the end of Phase II (t20–t31), there was a 40 % difference in respiration rate between the lowest and high- estfCO2treatments (slope−0.0002;p=0.02;R2=0.77;
Fig. 6). The volumetric respiration during Phase II was 7.6 and 7.1 µmol O2 L−1d−1 for the two controls, and 4.7–
5.7 µmol O2L−1d−1for the CO2treatment mesocosms. Out- side the mesocosms, at ambient CO2 concentration (aver- age of 343 µatmfCO2but with larger variability than inside the mesocosms), the carbon normalized respiration rate was lower than inside the mesocosms and the cumulative, carbon- normalized respiration was approximately half of that mea- sured in the control bags at the end of the experiment (Fig. 5).
The general pattern of lower respiration rates at high CO2 concentration was the same without normalization to TPC (Table 1, Fig. S4).
4 Discussion
4.1 Plankton community
The particulate and dissolved standing stocks during this ex- periment are presented in Paul et al. (2015). In the initial Phase I of the experiment, the Chla concentration was rel- atively high (∼2 µg Chl aL−1), but it started to decrease during Phase II, reaching∼1 µg ChlaL−1 att31 in all of the treatments. During this transition there was a shift in the plankton community with decreasing phytoplankton and mi- crozooplankton, as well as increasing abundance of meso- zooplankton, primarily cladocerans (Figs. 1 and 2).
The phytoplankton community composition was domi- nated by common species in the area (Hällfors, 2004). In the latter part (Phase II), the relative dominance by dinoflagel- lates was mainly due to reduction in biomass of the other groups, with the exception of the highest CO2concentration, where the dinoflagellates also decreased in abundance. Di- noflagellates are generally favored in low turbulence (Mar- galef, 1978; Smayda and Reynolds, 2001) and were proba-
Biomass(µmolCL-1 )
0 1 2 3 4 5
Copepods Cladocerans Ciliates
Heterotrophic dinoflagellates Rotifers
Protozoans Other
Biomass(µmolCL-1 )
0.0 0.5 1.0 1.5 2.0
t0 t17
t31
Start 346 348 494 868 1075 1333
346 348 494 868 1075 1333
fCO2 (µatm)
Fig 2
Figure 2.The main micro- and mesozooplankton groups at the start of the experiment,t0, andt17 (upper panel) andt31 (lower panel).
The initial period (t0) was the average of all mesocosm bags. A more detailed description of the temporal development in the zoo- plankton community can be found in Lischka et al. (2015).
bly benefitting from the relative stable conditions within the mesocosms. Blooms of filamentous cyanobacteria do occur in the area, but they did not develop within the mesocosms.
The relatively low temperature (mostly < 15◦C; Paul et al., 2015) could be a reason for that (Kanoshina et al., 2003).
Protozoans, ciliates and heterotrophic dinoflagellates dominated the microzooplankton, andMyrionecta rubraini- tially made up a large proportion of the ciliates. M. rubra can be regarded as mixotrophic and would also have con- tributed to the carbon fixation (Johnson et al., 2006). Cope- pods and cladocerans initially dominated the mesozooplank- ton, and during Phase II cladocerans became the dominant mesozooplankton group. Cladocerans are typically predomi- nant in freshwater, but in the brackish Baltic Sea they can be common, in particular when stability in the water column is high (Viitasalo et al., 1995).
The combined phyto- and zooplankton carbon derived from microscope counts decreased during the experiment.
TPC did not decrease to the same extent, and the percent-
Time (d)
0 5 10 15 20 25 30 35
Totalparticulate carbon(µmolL)-1
0 10 20 30 40 50
346 µatm 348 µatm 494 µatm 868 µatm 1075 µatm 1333 µatm Baltic (343 µatm)
Phase I Phase II
Fig 3.
Figure 3.The development of TPC during the experiment.
age microscope-derived carbon of TPC decreased from 26 % att0 to only∼8 % of the measured TPC att31. These num- bers are not directly comparable, as detritus, i.e., non-living carbon particles, is included in TPC. However, any large ag- gregates sink rapidly and are not expected to have contributed much to the TPC. The reduction of microscopy-derived car- bon to TPC indicates rather increasing importance of smaller size classes (< 4 µm), not enumerated by the microscope counts. This conclusion is also supported by flow cytometer data from this experiment (Crawfurd et al., 2016), increasing uptake of PO4by the < 3 µm fraction (Nausch et al., 2016) and the increasing proportion of the smallest (< 2 µm) size class of Chla(Paul et al., 2015).
4.2 Primary production and respiration
Primary production and respiration rates were comparable to values obtained under similar conditions in the area (Kivi et al., 1993). There are relatively few records of respiration, but the measured respiration rates in the control bags were similar to the average respiration rate obtained for a range of coastal waters of 7.4±0.54 mmol O2m−3d−1 (n=323;
Robinson and Williams, 2005). The incubation period we used for primary production measurements (24 h) provides production rates close to net production (Marra, 2009).
The higher respiration and lower production in the M1 control bag was probably connected, i.e., higher respiration led to lower net carbon fixation; however, the reason for the M1 bag being very different from the very start is not clear. Most of the other variables were similar in the M1 bag compared to the rest (Paul et al., 2015), but there was some indication of difference in community. In particular, proto- zoans were lower in the M1 bag compared with the rest of the mesocosms throughout the experiment. However, judging from the development in carbon pools (Paul et al., 2015) and fluxes in the system (Spilling et al., 2016a), the NPP mea-
Time (d)
0 5 10 15 20 25 30 35
Cumulativeprimaryproduction(molCmol-1 TPC) 0.0 0.2 0.4 0.6 0.8 1.0 1.2 1.4 1.6
346 µatm 348 µatm 494 µatm 868 µatm 1075 µatm 1333 µatm Baltic (343 µatm)
Phase I Phase II
Fig 4
Figure 4.The cumulative primary production in the differentfCO2 treatments normalized to TPC in the euphotic zone. The fCO2 (µatm) were the average measured over the duration of the exper- iment. The two lowestfCO2treatments (346 and 348 µatm) were controls without any CO2addition. The two phases of the experi- ment are indicated by the horizontal bars on top.
surements for the M1 bag must be an underestimate. Bacte- rial production during Phase II was highest in the ambient CO2, in particular in M1 (Hornick et al., 2016), and could partly be the reason for the elevated respiration rate in this mesocosm bag.
Having the respiration incubation at a fixed temperature might have caused a slight bias as there was varying thermal stratification throughout the experiment and the temperature was not even throughout the mesocosm bags. A better ap- proach would have been to have respiration incubations in temperatures above and below the thermocline, but logistical constraints prevented us from doing this.
Another factor that could have influenced our incubations is UV light, which is a known inhibitor of primary produc- tion (Vincent and Roy, 1993), and elevated CO2concentra- tion may increase the sensitivity to UV light (Sobrino et al., 2009). Additionally, UV light reduces the release of DOC by phytoplankton, in particular at high CO2concentration (So- brino et al., 2014), but also causes photochemical mineraliza- tion of dissolved organic matter (DOM; Vahatalo and Jarvi- nen, 2007). Both DOC release and DOM breakdown may have implications for bacterial production and nutrient cy- cling. The mesocosm bags were made in a material absorbing UV light (thermoplastic polyurethane), whereas our primary production incubations were done in glass vials (transmitting some UV light) moored outside the mesocosm bags. The dif- ference in UV transmittance could have produced a bias in the primary production measurements. However, the DOM concentration in the Baltic Sea is very high compared with most other oceans and coastal seas (Hoikkala et al., 2015).
Most of this is terrestrial-derived, refractory DOM, which ef-
fectively absorbs in the UV region, and typically the depth at which 1 % of UVB remains is < 50 cm (Piazena and Häder, 1994). UVA penetrates a little deeper and may have affected slightly the incubation platform moored at 2 m depth, but we do not believe that UV light caused major inhibition of our primary production measurements or affected phytoplankton DOC production.
4.3 Effect of CO2on the balance between respiration and carbon fixation
Increased CO2 concentration has increased carbon fixation in some studies (Egge et al., 2009; Engel et al., 2013). This was not observed in this study, but the higher Chla, TPC and DOC in the high-CO2treatments at the end of the experiment (Paul et al., 2015) could have been caused by the lower res- piration rate in the highest CO2-enriched mesocosms, rather than increased primary production. Bacterial production was higher in the low CO2aftert20 during this experiment (Hor- nick et al., 2016), which fits with the higher respiration rate at ambient CO2concentration. The biomass of the smallest plankton size fraction (< 4 µm, not counted by microscope) increased in relative importance with CO2 addition in the latter part of the experiment, in particular two groups of pi- coeukaryotes (Crawfurd et al., 2016), and seems to have ben- efitted most by elevated CO2concentration, similar to find- ings in the Arctic (Brussaard et al., 2013). Temporal changes in bacterial abundances followed largely that of phytoplank- ton biomass, and there were significant increases in viral ly- sis rates in the high-CO2treatment (Crawfurd et al., 2016).
This was most likely a consequence of higher abundances of picoeukaryotes and points towards a more productive but regenerative system (Crawfurd et al., 2016).
This study is, to our knowledge, the first one describing reduced respiration rates with ocean acidification on a plank- ton community scale. There are relatively few measurements of community respiration in ocean acidification experiments, and existing studies have revealed no specific responses in respiration (Egge et al., 2009; Tanaka et al., 2013; Mercado et al., 2014). Some of these studies have been relatively short (< 2 weeks) compared to the current study. Our results re- vealed a CO2effect only 2 weeks into the experiment, sug- gesting that potential effects may have been present but re- mained below the detection limits in previous studies.
The effect of increasing CO2 concentration on respira- tion has mostly been documented for single species. For ex- ample, the copepod Centropages tenuiremis (Li and Gao, 2012) and the diatom Phaeodactylum tricornutum (Wu et al., 2010) exhibited increased respiration rates in a high- CO2environment (≥1000 µatmfCO2), contrary to our find- ings. However, these types of studies have revealed differ- ent responses even when comparing different populations of the same species (Thor and Oliva, 2015), and any interpo- lation from single-species, laboratory studies should be car- ried out with great caution. The larger-scale, mesocosm ap-
Time (d)
0 5 10 15 20 25 30 35
Cumulativerespiration(molO2mol-1 TPC) 0 2 4 6 8 10 12
346 µatm 348 µatm 494 µatm 868 µatm 1075 µatm 1333 µatm Baltic (343 µatm)
Phase I Phase II
Fig 5
Figure 5.The cumulative respiration in the differentfCO2treat- ments normalized to TPC. ThefCO2(µatm) was the average mea- sured over the duration of the experiment. The two lowestfCO2 treatments (346 and 348 µatm) were controls without any CO2ad- dition. The two phases of the experiment are indicated by the hori- zontal bars on top.
fCO2 (µatm)
200 400 600 800 1000 1200 1400
Respiration(molO2mol-1TPCd-1)
0.1 0.2 0.3 0.4 0.5 0.6
Fig 6
Figure 6.The respiration rate normalized to TPC, in the different fCO2treatments during the latter half of the experiment (t20–t31).
Respiration was estimated by linear regression from the data pre- sented in Fig. 4 from the time when an effect of increased CO2con- centration was first observed. The error bars represent standard error (SE) of the residuals from the linear regression. The solid line rep- resents the linear regression (slope−0.0002;p=0.02;R2=0.77) and dotted lines the 95 % confidence intervals.
proach taken here has the advantage that the whole plankton community and possible interacting effects between different components of the food web are included.
For primary producers in aquatic environment, changes in carbonate chemistry speciation affect the availability of the sole substrate, i.e., CO2, at the site of photosynthetic carbon fixation. At present, marine waters typically have a pH of 8 or
above, and most of the carbon is in the form of bicarbonate (HCO−3). Many phytoplankton groups have developed car- bon concentrating mechanisms (CCMs) as a way to increase substrate availability at the site of carbon fixation (Singh et al., 2014), reducing the cost of growth (Raven, 1991). For phytoplankton with CCMs, increased CO2availability would suppress the CCM, freeing resources for growth, in partic- ular under light-limiting conditions (Beardall and Giordano, 2002). There are examples of experiments with ocean acidifi- cation that have indicated downregulation of CCM (Hopkin- son et al., 2010) and the photosynthetic apparatus (Sobrino et al., 2014), which could reduce respiration in phytoplankton.
The intracellular pH can be highly variable between differ- ent cellular compartments and organelles, but in the cytosol the pH is normally close to neutral (pH∼7.0) and is to a large extent independent of the external pH (Roos and Boron, 1981). In plants, animals and also bacteria, there is a complex set of pH regulatory mechanisms that are fundamentally con- trolled by physiological processes such as membrane trans- port of H+or OH−and intracellular metabolism (Smith and Raven, 1979; Kurkdjian and Guern, 1989). Internal pH regu- lation can be a considerable part of baseline respiration (Pört- ner et al., 2000). With ocean acidification, the external pH becomes closer to the intracellular pH, and this might reduce the metabolic cost (respiration) related to internal pH regu- lation. Teira et al. (2012) studied the effect of elevated CO2 concentration on two bacterial cultures and found reduced respiration in one of the two in a high-CO2 environment (1000 µatm CO2), and they suggest reduced metabolic cost for internal pH regulation as a possible mechanism. How- ever, the other strain did not have any change in respiration rate and more studies of the effect of changed external pH on membrane transport are needed (Taylor et al., 2012). There might additionally be considerable difference between ma- rine organisms depending on, for example, size, metabolic activity and growth rates, which directly affect pH in the dif- fusive boundary layer surrounding the organism (Flynn et al., 2012).
Judging from the importance of the smallest size class in this study, bacterial and picophytoplankton community (Crawfurd et al., 2016) and bacterial production (Hornick et al., 2016), the decreased respiration at higher CO2 con- centration was probably mostly due to reduced picoplankton respiration. The underlying mechanisms behind the reduced respiration are unclear, and this is an underexplored research avenue that deserves further study.
4.4 Interacting effects and community composition Our measurements outside the mesocosm bags demonstrate that plankton physiology and community composition can have a big impact on both primary production and res- piration. The plankton community was relatively uniform across all mesocosm bags. Unfortunately, we do not have any community data from outside the mesocosm bags, but
the amplitude of Chladynamics was different, with an up- welling event leading to a doubling of the Chla concentra- tion (∼5 µg ChlaL−1)aroundt17 (Paul et al., 2015). This suggests a different availability of inorganic nutrients and different plankton community as other environmental vari- ables such as light and temperature were similar both inside and outside the mesocosm bags, except that UV light was absent inside the mesocosm bags. The carbon-normalized respiration rate outside the mesocosm bags (with ambient fCO2)was approximately half of the respiration rates in the controls with the same averagefCO2, and also absolute res- piration was clearly lower during Phase II, when nitrate was depleted inside the bags and plankton biomass was decreas- ing. However, thefCO2was more variable outside the meso- cosm bags compared with the control bags (although their averages were similar), and thefCO2increased throughout Phase II outside the bags to approximately 700 µatm byt31 (Paul et al., 2015). This could have influenced the carbon normalized respiration, which started to deviate outside the bags during Phase II, but it could also have been interacting effects of different environmental changes (different nutri- ent dynamics) leading to this lower respiration rate. An often overlooked aspect is the importance of the plankton commu- nity composition, which can be more important than changes in external factors (Verity and Smetacek, 1996; Eggers et al., 2014).
Bacterial production (Grossart et al., 2006) and bacterial degradation of polysaccharides (Piontek et al., 2010) have been demonstrated to increase under elevated CO2 concen- tration, contrary to the findings during this experiment (Hor- nick et al., 2016). All of these responses are to a large ex- tent dependent on the plankton community composition. For example, the increased bacterial production observed in a mesocosm study in a Norwegian fjord was probably a re- sponse to increased carbon availability produced by phyto- plankton (Grossart et al., 2006). DOC production by phy- toplankton is determined by the physiological state and the composition of the community (Thornton, 2014); in particu- lar, diatoms have been intensively studied in this respect and are known to be important DOC producers (Hoagland et al., 1993). Shifts in the phytoplankton community may alter the DOC production (Spilling et al., 2014), and any shifts in the plankton community composition, caused by ocean acidifica- tion, may have greater effects on ecosystem functioning than any direct effect of increasingfCO2/decreasing pH (Eggers et al., 2014).
It is evident that there were other variables that influence the physiology of the plankton community as a whole outside the mesocosms. Changes in community composition and nu- trient availability seem the most plausible reasons. A bet- ter understanding of how different physical, chemical and biological factors interact with each other is needed in or- der to improve our understanding of how marine ecosystems change under the influence of a range of environmental pres- sures.
4.5 Potential implications for carbon cycling
A lot of attention during past decades has been directed to un- derstanding the biological carbon pump, as it is a key mecha- nism for sequestering atmospheric CO2. The potential export is ultimately determined by gross primary production minus total community respiration. Even small changes in the pro- duction or loss term of this equation have the potential to greatly affect biogeochemical cycling of carbon.
The exported carbon decreased during the experiment.
Part of this decrease was probably due to sinking of exist- ing organic material at the start of the experiment and can be seen as the reduction in TPC. However, this also coincided with the shift towards increased dominance of picoplankton.
Size is a key parameter determining sinking speed, and pico- plankton is very inefficient in transporting carbon out of the euphotic layer (Michaels and Silver, 1988). The shift towards smaller size classes was likely also contributing to the reduc- tion in exported carbon.
The 40 % reduction in respiration with increasingfCO2 found in our study could have great implications for net ex- port of carbon in the future ocean. There is, however, un- certainty in the results, in particular that the measured net carbon fixation under increased CO2was not higher than in the controls. In the case of reduced respiration, an increase in net primary production can be expected, as loss rates are re- duced. That the measured carbon fixation was not evidently different between treatments could be due to similar reduc- tion in gross primary production, as indicated by carbon flux estimates (Spilling et al., 2016a). Alternatively, the measure- ment uncertainty in our small-scale incubations (8 mL), in- volving several pipetting steps, was likely higher than the res- piration measurements, which could have prevented us from picking up any CO2 effect on primary production. Another complicating factor is what the14C method is actually mea- suring (Sakshaug et al., 1997; Falkowski and Raven, 2013).
The consensus seems to be somewhere between gross and net production, but leaning towards net production with long incubation times (Marra, 2009).
There was evidence of a positive CO2effect on the amount of Chla, TPC and DOC pools (Paul et al., 2015), suggest- ing that the reduced respiration does translate into higher net carbon fixation. This effect was seen from the latter part of Phase II and the trend continued aftert31 (these variables were sampled untilt43). This increased net carbon fixation did not, however, affect carbon export as there was no de- tectable difference in the sinking flux measurements (Table 1 and Paul et al., 2015). The results suggest that the increased carbon fixation resulted in the smallest size fraction of TPC not being exported and/or ending up in the dissolved organic carbon pool. Further support for this conclusion is presented in Paul et al. (2015), Crawfurd et al. (2016) and Lischka et al. (2015).
In conclusion, this study suggests that elevated CO2 re- duced respiration, which in turn increased net carbon fix-
ation. However, the increased primary production did not translate into increased carbon export, and consequently did not work as a negative feedback mechanism for increasing atmospheric CO2concentration.
5 Data availability
The primary production and respiration data can be found in Spilling et al. (2016b; doi: 10.1594/PANGAEA.863933).
Most other variables from the experiment (e.g. total particulate carbon) can be found in Paul et al. (2016;
doi:10.1594/PANGAEA.863032).
The Supplement related to this article is available online at doi:10.5194/bg-13-4707-2016-supplement.
Acknowledgements. We would like to thank all of the staff at Tvärminne Zoological Station for great help during this experiment and Michael Sswat for carrying out the TPC filtrations. We also gratefully acknowledge the captain and crew of R/V ALKOR (AL394 and AL397) for their work transporting, deploying and recovering the mesocosms. The collaborative mesocosm campaign was funded by BMBF projects BIOACID II (FKZ 03F06550) and SOPRAN Phase II (FKZ 03F0611). Additional financial support for this study came from the Academy of Finland (KS – Decisions no. 259164 and 263862) and the Walter and Andrée de Nottbeck Foundation (KS, NV).
Edited by: C. P. D. Brussaard
Reviewed by: P. Neale and one anonymous referee
References
Beardall, J. and Giordano, M.: Ecological implications of microal- gal and cyanobacterial CO2concentrating mechanisms, and their regulation, Funct. Plant. Biol., 29, 335–347, 2002.
Beldowski, J., Löffler, A., Schneider, B., and Joensuu, L.: Distribu- tion and biogeochemical control of total CO2and total alkalinity in the Baltic Sea, J. Marine Syst., 81, 252–259, 2010.
Bermúdez, J. R., Winder, M., Stuhr, A., Almén, A. K., Engström- Öst, J., and Riebesell, U.: Effect of ocean acidification on the structure and fatty acid composition of a natural plank- ton community in the Baltic Sea, Biogeosciences Discuss., doi:10.5194/bg-2015-669, in review, 2016.
Boxhammer, T., Bach, L. T., Czerny, J., and Riebesell, U.: Technical note: Sampling and processing of mesocosm sediment trap ma- terial for quantitative biogeochemical analysis, Biogeosciences, 13, 2849–2858, doi:10.5194/bg-13-2849-2016, 2016.
Brussaard, C. P. D., Noordeloos, A. A. M., Witte, H., Collenteur, M. C. J., Schulz, K., Ludwig, A., and Riebesell, U.: Arctic mi- crobial community dynamics influenced by elevated CO2 lev- els, Biogeosciences, 10, 719–731, doi:10.5194/bg-10-719-2013, 2013.
Crawfurd, K. J., Brussaard, C. P. D., and Riebesell, U.: Shifts in the microbial community in the Baltic Sea with increasing CO2, Bio- geosciences Discuss., doi:10.5194/bg-2015-606, in review, 2016.
Ducklow, H. W., Steinberg, D. K., and Buesseler, K. O.: Upper ocean carbon export and the biological pump, Oceanography, 14, 50–58, 2001.
Dunne, J. P., Sarmiento, J. L., and Gnanadesikan, A.: A synthesis of global particle export from the surface ocean and cycling through the ocean interior and on the seafloor, Global Biogeochem. Cy., 21, GB4006, doi:10.1029/2006GB002907, 2007.
Egge, J. K., Thingstad, T. F., Larsen, A., Engel, A., Wohlers, J., Bellerby, R. G. J., and Riebesell, U.: Primary production during nutrient-induced blooms at elevated CO2 concentrations, Bio- geosciences, 6, 877–885, doi:10.5194/bg-6-877-2009, 2009.
Eggers, S. L., Lewandowska, A. M., Barcelos e Ramos, J., Blanco- Ameijeiras, S., Gallo, F., and Matthiessen, B.: Community com- position has greater impact on the functioning of marine phy- toplankton communities than ocean acidification, Glob. Change Biol., 20, 713–723, 2014.
Engel, A., Borchard, C., Piontek, J., Schulz, K. G., Riebesell, U., and Bellerby, R.: CO2increases14C primary production in an Arctic plankton community, Biogeosciences, 10, 1291–1308, doi:10.5194/bg-10-1291-2013, 2013.
Falkowski, P. G. and Raven, J. A.: Aquatic photosynthesis; Second edition, Princeton University Press, Princeton, 501 pp., 2013.
Flynn, K. J., Blackford, J. C., Baird, M. E., Raven, J. A., Clark, D. R., Beardall, J., Brownlee, C., Fabian, H., and Wheeler, G.
L.: Changes in pH at the exterior surface of plankton with ocean acidification, Nature Climate Change, 2, 510–513, 2012.
Gargas, E.: A manual for phytoplankton primary production studies in the Baltic, The Baltic Marine Biologist, Hørsholm, Denmark, 88 pp., 1975.
Grossart, H.-P., Allgaier, M., Passow, U., and Riebesell, U.: Testing the effect of CO2concentration on the dynamics of marine het- erotrophic bacterioplankton, Limnol. Oceanogr., 51, 1–11, 2006.
Hällfors, G.: Checklist of Baltic Sea phytoplankton species, Baltic Sea Environment Proceedings No. 95, HELCOM, Helsinki, 208 pp., 2004.
Hoagland, K. D., Rosowski, J. R., Gretz, M. R., and Roemer, S. C.:
Diatom extracellular polymeric substances: function, fine struc- ture, chemistry, and physiology, J. Phycol., 29, 537–566, 1993.
Hoikkala, L., Kortelainen, P., Soinne, H., and Kuosa, H.: Dissolved organic matter in the Baltic Sea, J. Marine Syst., 142, 47–61, 2015.
Hopkinson, B. M., Xu, Y., Shi, D., McGinn, P. J., and Morel, F.
M.: The effect of CO2on the photosynthetic physiology of phy- toplankton in the Gulf of Alaska, Limnol. Oceanogr., 55, 2011–
2024, 2010.
Hoppenrath, M., Elbrächter, M., and Drebes, G.: Marine Phyto- plankton: Selected MicrophytoplanktonSpecies from the North Sea around Helgoland and Sylt, Schweizerbart Science Publish- ers, Stuttgart, Germany, 264 pp., 2009.
Hornick, T., Bach, L. T., Crawfurd, K. J., Spilling, K., Achterberg, E. P., Brussaard, C. P. D., Riebesell, U., and Grossart, H.-P.:
Ocean acidification indirectly alters trophic interaction of het- erotrophic bacteria at low nutrient conditions, Biogeosciences Discuss., doi:10.5194/bg-2016-61, in review, 2016.
Johnson, M. D., Tengs, T., Oldach, D., and Stoecker, D. K.: Se- questration, performance, and functional control of cryptophyte
plastids in the ciliateMyrionecta rubra(ciliophora), J. Phycol., 42, 1235–1246, 2006.
Kanoshina, I., Lips, U., and Leppänen, J.-M.: The influence of weather conditions (temperature and wind) on cyanobacterial bloom development in the Gulf of Finland (Baltic Sea), Harm- ful Algae, 2, 29–41, 2003.
Kivi, K., Kaitala, S., Kuosa, H., Kuparinen, J., Leskinen, E., Lignell, R., Marcussen, B., and Tamminen, T.: Nutrient limitation and grazing control of the Baltic plankton community during annual succession, Limnol. Oceanogr., 38, 893–905, 1993.
Kraberg, A., Baumann, M., and Dürselen, C.-D.: Coastal phy- toplankton: photo guide for Northern European seas, Pfeil, München, 2010.
Kurkdjian, A., and Guern, J.: Intracellular pH: measurement and importance in cell activity, Annu. Rev. Plant Biol., 40, 271–303, 1989.
Le Quéré, C., Raupach, M. R., Canadell, J. G., Marland, G., Bopp, L., Ciais, P., Conway, T. J., Doney, S. C., Feely, R. A., and Fos- ter, P.: Trends in the sources and sinks of carbon dioxide, Nat.
Geosci., 2, 831–836, 2009.
Li, W. and Gao, K.: A marine secondary producer respires and feeds more in a high CO2ocean, Mar. Pollut. Bull., 64, 699–703, 2012.
Lischka, S., Bach, L. T., Schulz, K.-G., and Riebesell, U.: Micro- and mesozooplankton community response to increasing CO2 levels in the Baltic Sea: insights from a large-scale meso- cosm experiment, Biogeosciences Discuss., 12, 20025–20070, doi:10.5194/bgd-12-20025-2015, 2015.
Mackey, K. R., Morris, J. J., Morel, F. M., and Kranz, S. A.: Re- sponse of photosynthesis to ocean acidification, Oceanography, 28, 74–91, 2015.
Margalef, R.: Life-forms of phytoplankton as survival alternatives in an unstable environment, Oceanol. Ac., 1, 493–509, 1978.
Marra, J.: Net and gross productivity: weighing in with14C, Aquat.
Microb. Ecol., 56, 123–131, 2009.
Menden-Deuer, S. and Lessard, E. J.: Carbon to volume relation- ships for dinoflagellates, diatoms, and other protist plankton, Limnol. Oceanogr., 45, 569–579, 2000.
Mercado, J., Sobrino, C., Neale, P., Segovia, M., Reul, A., Amorim, A., Carrillo, P., Claquin, P., Cabrerizo, M., and León, P.: Effect of CO2, nutrients and light on coastal plankton, II. Metabolic rates, Aquat. Biol., 22, 43–57, 2014.
Michaels, A. F. and Silver, M. W.: Primary production, sinking fluxes and the microbial food web, Deep-Sea Res., 35, 473–490, 1988.
Nausch, M., Bach, L. T., Czerny, J., Goldstein, J., Grossart, H.-P., Hellemann, D., Hornick, T., Achterberg, E. P., Schulz, K.-G., and Riebesell, U.: Effects of CO2perturbation on phosphorus pool sizes and uptake in a mesocosm experiment during a low produc- tive summer season in the northern Baltic Sea, Biogeosciences, 13, 3035–3050, doi:10.5194/bg-13-3035-2016, 2016.
Olenina, I., Hajdu, S., Edler, L., Andersson, A., Wasmund, N., Busch, S., Göbel, J., Gromisz, S., Huseby, S., Huttunen, M., Jaanus, A., Kokkonen, P., Ledaine, I., and Niemkiewicz, E.: Bio- volumes and size-classes of phytoplankton in the Baltic Sea, Balt. Sea Environ. Proc., HELCOM, 144 pp., 2006.
Orr, J. C.: Recent and future changes in ocean carbonate chemistry, in: Ocean acidification, edited by: Gattuso, J.-P. and Hansson, L., Oxford University Press, Oxford, 41–66, 2011.
Paul, A. J., Bach, L. T., Schulz, K.-G., Boxhammer, T., Czerny, J., Achterberg, E. P., Hellemann, D., Trense, Y., Nausch, M., Sswat, M., and Riebesell, U.: Effect of elevated CO2on organic matter pools and fluxes in a summer Baltic Sea plankton community, Biogeosciences, 12, 6181–6203, doi:10.5194/bg-12-6181-2015, 2015.
Paul, A., Schulz, K. G., Achterberg, E. P., Hellemann, D., Nausch, M., Boxhammer, T., Bach, L. T., and Trense, Y.:
KOSMOS Finland 2012 mesocosm study: carbonate chem- istry, particulate and dissolved matter pools, and phytoplankton community composition using marker pigments (CHEMTAX), doi:10.1594/PANGAEA.863032, 2016.
Piazena, H. and Häder, D. P.: Penetration of solar UV irradiation in coastal lagoons of the southern Baltic Sea and its effect on phy- toplankton communities, Photochem. Photobiol., 60, 463–469, 1994.
Piontek, J., Lunau, M., Händel, N., Borchard, C., Wurst, M., and Engel, A.: Acidification increases microbial polysaccha- ride degradation in the ocean, Biogeosciences, 7, 1615–1624, doi:10.5194/bg-7-1615-2010, 2010.
Pörtner, H., Bock, C., and Reipschlager, A.: Modulation of the cost of pHi regulation during metabolic depression: a (31) P-NMR study in invertebrate (Sipunculus nudus) isolated muscle, J. Exp.
Biol., 203, 2417–2428, 2000.
Raateoja, M., Seppala, J., Kuosa, H., and Myrberg, K.: Recent changes in trophic state of the Baltic Sea along SW coast of Fin- land, Ambio, 34, 188–191, 2005.
Raven, J. A.: Physiology of inorganic C acquisition and implica- tions for resource use efficiency by marine phytoplankton: rela- tion to increased CO2and temperature, Plant Cell Environ., 14, 779–794, 1991.
Riebesell, U. and Tortell, P. D.: Effects of ocean acidification on pelagic organisms and ecosystems, in: Ocean acidification, edited by: Gattuso, J.-P. and Hansson, L., Oxford University Press, Oxford, 99–121, 2011.
Riebesell, U., Czerny, J., von Bröckel, K., Boxhammer, T., Büden- bender, J., Deckelnick, M., Fischer, M., Hoffmann, D., Krug, S.
A., Lentz, U., Ludwig, A., Muche, R., and Schulz, K. G.: Tech- nical Note: A mobile sea–going mesocosm system – new oppor- tunities for ocean change research, Biogeosciences, 10, 1835–
1847, doi:10.5194/bg-10-1835-2013, 2013.
Robinson, C. and Williams, P. B.: Respiration and its measurement in surface marine waters, in: Respiration in aquatic ecosystems, edited by: Giorgio, P. A. and Williams, P. B., Oxford University Press, Oxford, 147–181, 2005.
Roos, A. and Boron, W. F.: Intracellular pH, Am. Physiol. Soc., 61, 296–434, 1981.
Sakshaug, E., Bricaud, A., Dandonneau, Y., Falkowski, P. G., Kiefer, D. A., Legendre, L., Morel, A., Parslow, J., and Taka- hashi, M.: Parameters of photosynthesis: definitions, theory and interpretation of results, J. Plankton Res., 19, 1637–1670, 1997.
Savchuk, O. P.: Resolving the Baltic Sea into seven subbasins: N and P budgets for 1991–1999, J. Mar. Syst., 56, 1–15, 2005.
Setälä, O., Kuuppo, P., Ekebom, J., Kuosa, H., and Patterson, D.:
Workbook on protist ecology and taxonomy. Proceedings from the 1st Workshop on Protistology at Tvärminne Zoological Sta- tion, Yliopistopaino, Helsinki, 161 pp., 1992.
Sharp, J.: Improved analysis for particulate organic carbon and ni- trogen from seawater, Limnol. Oceanogr., 19, 984–989, 1974.