The Role of Ocean-Atmosphere Interaction over the Gulf Stream SST-front
in North Atlantic Sector Climate
Dissertation
zur Erlangung des Doktorgrades
der Mathematisch-Naturwissenschaftlichen Fakultät der Christian-Albrechts-Universität zu Kiel
vorgelegt von Ralf Hand
Kiel, 2015
Erster Gutachter: Prof. Dr. Noel S. Keenlyside Zweiter Gutachter: Prof. Dr. Richard J. Greatbatch Tag der mündlichen Prüfung: 25.11.2014
Zum Druck genehmigt: 02.02.2015
gez. Prof. Dr. Wolfgang J. Duschl, Dekan
Contents
Zusammenfassung 1
Abstract 3
1 Introduction 5
2 The role of model resolution in the simulated response to the Gulf Stream SST
front 9
2.1 Introduction . . . 9
2.2 Model & Data . . . 10
2.3 Results . . . 11
2.4 Summary & Discussion . . . 23
3 Simulated response to inter-annual SST variations in the Gulf Stream region 29 3.1 Introduction . . . 30
3.2 Methods . . . 32
3.3 Results . . . 35
3.3.1 Simulated climatology . . . 35
3.3.2 Ensemble AGCM simulations 1870-2007 . . . 40
3.3.3 Response to Gulf Stream SST anomaly . . . 44
3.4 Summary & Discussion . . . 50
4 The role of ocean-atmosphere interaction in shaping climate change in the North Atlantic sector 55 4.1 Abstract . . . 55
4.2 Introduction . . . 56
4.3 Models and methods . . . 59
4.3.1 Coupled model experiments . . . 59
4.3.2 Coupled model performance in the North Atlantic region . . . 60
4.3.3 Sensitivity experiments . . . 61
4.4 Results . . . 63 4.4.1 Local simulated response in the coupled model . . . 63 4.4.2 Sensitivity experiments to assess the impact of local SST changes in
the North Atlantic sector . . . 68 4.4.3 Response of the North Atlantic storm track and large-scale response 73 4.5 Summary and Discussion . . . 73
5 Summary & Conclusion 79
Appendix 83
Abbreviations 99
List of figures 101
List of tables 109
Bibliography 111
Acknowledgements 119
Eidesstattliche Erklärung 121
Zusammenfassung
In der vorliegenden Arbeit wird der Einfluss von Fronten der Meeresoberflächentemperatur (engl.
Sea Surface Temperature, SST) der mittleren Breiten auf die Atmosphäre aus verschiedenen Blick- winkeln am Beispiel der Golfstromregion betrachtet. Die Arbeit ist in drei Teile gegliedert:
Im ersten Teil wird der Einfluss der Modellauflösung auf die korrekte Darstellung von in der in der Frontregion relevanten Prozessen diskutiert. Hierzu wurde eine Serie von Experimenten mit dem allgemeinen atmosphärischen Zirkulationsmodell ECHAM5 ausgewertet. Der Niederschlag weist im Atmosphärenmodell eine deutliche Sensitivität gegenüber der Auflösung auf; auf die anderen untersuchten Größen ist der Einfluss der Modellauflösung hingegen gering. Dies deutet darauf hin, dass die Unterschiede zwischen den Läufen unterschiedlicher Auflösung im Wesentlichen aus den Niederschlagsparametrisierungen resultieren. Im Winter scheint eine sehr hohe Modellauflösung zudem die Wiedergabe der Zugbahn extratropischer Stürme (des sog. North Atlantic storm track) zu verbessern.
Der zweite Teil beschäftigt sich mit der Frage, inwiefern die Variabilität der Meeresoberflächen- temperatur in der Golfstromregion generell einen Einfluss auf die mit der SST-Front verbundenen atmosphärischen Prozesse hat. Ein transienter ECHAM5-Ensemblelauf belegt eine hohe Sensiti- vität des konvektiven Niederschlags im Bereich der SST-Front bezüglich der Randbedingungen des Modells; zudem weisen konvektiver Niederschlag und SST im Bereich der Front eine hohe Korrelation auf. Im Sommer kommt es zu einer Verstärkung des aus der Literatur als “pressure adjustment” bekannten Mechanismus, der auch den klimatologisch gemittelten Zustand der At- mosphäre in dieser Region beschreibt. Im Winter ist der erhöhte Niederschlag sehr wahrscheinlich mit atmosphärischen Kalt- und Warmfronten verknüpft.
Im letzten Teil werden schließlich Ozean-Atmosphäre-Wechselwirkungen im Kontext der Klima- erwärmung am Beispiel einer Langzeitsimulation mit dem Erdsystemmodell MPI-ESM betrachtet.
Ziel war es herauszufinden, welchen Einfluss Veränderungen des lokalen Temperaturmusters an der Ozeanoberfläche auf die sich erwärmende Atmosphäre haben - sowohl lokal als auch auf größeren räumlichen Skalen. Im Bereich der historischen Golfstromfront, der Region in der im heutigen Klima ein deutliches lokales Niederschlagsmaximum zu finden ist, projiziert das Klimamodell für die Zukunft eine Abnahme des Niederschlags. Dies kann eindeutig mit einer Abschwächung des SST-Gradienten in dieser Region in Verbindung gebracht werden. Die großskaligen atmosphärischen Veränderungen stellen hingegen eine direkte Reaktion auf den veränderten Strahlungsantrieb und die großskaligen Veränderungen der SST dar; der Einfluss lokaler Veränderungen der SST-Muster in der Golfstromregion beschränkt sich im analysierten Modell somit auf den lokalen Einfluss.
Abstract
This work deals with various aspects of the atmospheric response to mid-latitude SST fronts, in particular in the Gulf Stream region. It consists of three parts:
In the first part the effect of enhanced model resolution on the correct representation of the processes in the frontal region is discussed, based on analysis of a set of experiments using the atmospheric general circulation model ECHAM5. Precipitation shows sensitivity to resolution, but most other quantities that we analysed do not. Therefore, this sensitivity is likely caused by the parameterisation of atmospheric convection. In winter, also the representation of the North Atlantic storm track seems to benefit from higher model resolution.
The second part focuses on the question of whether or not SST variability in the Gulf Stream re- gion in general has an influence on the atmospheric processes related to the SST front. A transient ECHAM5 ensemble run, shows that convective precipitation has a high sensitivity to atmospheric boundary conditions in the region of the SST front and that local SSTs and convective precipitation are highly correlated there. In summer the so-called pressure adjustment mechanism, which has been identified in the climatological mean state, is enhanced when warm SST anomalies occur. In winter the enhanced precipitation is likely related to atmospheric fronts. Their frequency is not enhanced significantly, but the amount of precipitation per front is effected.
The last part of this work deals with ocean-atmosphere interactions in a warming climate, based on a long-term integration with the Earth System Model MPI-ESM. The objective was to assess to what extend SST changes in the North Atlantic contribute to the global warming signal in the atmosphere, locally as well as on larger spatial scales. For the region of the historical Gulf Stream SST-front - a region were the historical run shows a local maximum in precipitation - the model projection shows a decrease in winter-time precipitation that is connected to a weakening of the SST gradients there. The large-scale atmospheric response in contrast was found to be mainly a direct response to the changed radiative forcings and the large scale SST increase and shows only little evidence of an impact from changes in the SST patterns in the Gulf Stream region.
1 Introduction
The Gulf Stream region is a key-region for ocean-atmosphere interaction in the North Atlantic sector. It was shown that the sharp SST gradients in this region cause a narrow precipitation band on the southern side of the front, which is connected to a local minimum in sea level pressure, low-level wind convergence and deep upward motion (Minobe et al., 2008).
The objective of this work is to improve the understanding of the atmospheric processes associated with changes of the Gulf Stream SST-front on different time scales - from the atmosphere’s response to multi-annual sea surface temperature (SST) variability to (sim- ulated) long-term changes associated with a global warming scenario. A main focus is on precipitation, as it shows a high sensitivty to SST. But also, the large scale atmospheric circulation is considered. While on inter-annual and shorter time scales the SST is mainly controlled by the short-term atmospheric variability, on decadal and longer time scales ocean dynamics begin to be the controlling factor (Gulev et al., 2013). It is a caveat for the understanding of many processes that both, the marine atmosphere and the ocean, are poorly covered by detailed observations. Relying on satellite data, which are available on a global domain, is only possible for the period since ∼1980, which is too short to analyse processes on decadal and longer time scales. Therefore, this study heavily relies on numerical models. However, in terms of the climatology, the models represent the currently observed patterns of the atmospheric circulation quite well. They also exhibit realistic variability of the large scale atmospheric circulation on decadal time scales (e.g.
IPCC, 2013).
A crucial advantage of using models is that they allow us to isolate certain characteristic SST patterns observed in connection with certain processes of long-term atmospheric or ocean variability and to make statistically robust conclusions about the atmospheric re- sponse to these patterns. The setup with prescribed SSTs cannot reproduce the feedbacks to the ocean. However, this simplification can also be seen as an advantage, since the complexity is reduced and the one-way interaction from the ocean to the atmosphere can be studied in detail.
1 Introduction
This work starts with an analysis of the role of model resolution on the processes related to mid-latitude SST fronts. Previous studies discussed how far the resolution of atmosphere models and the related SST forcing are relevant for the ability of the model to reproduce the observed patterns of mid-latitude ocean-atmosphere interaction (Minobe et al., 2008), and how enhanced resolution in coupled models could improve predictive skill on inter-annual timescales. In this context, attention should be paid to the reduction of the SST bias in the North Atlantic, a common problem of most state-of-the art coupled models that is known to impact the atmospheric circulation (e.g. Keeley et al., 2012; Scaife et al., 2011).
Recently, it was shown that the atmosphere’s response to mid-latitude SST anomalies changes with enhanced resolution (Scaife et al., 2014, Guidi Zhou, pers. communication) While it was shown that the climatological precipitation is strongly influenced by the presence of the Gulf Stream SST front (Minobe et al., 2008), only little attention has been paid to the question, to what extent precipitation and SST variability are linked in this region. Motivation to investigate the latter issue is invigorated by a study of Gulev et al.
(2013), who showed in an analysis of turbulent heat fluxes that at least on longer (decadal) timescales the ocean drives the atmosphere in the mid-latitude North Atlantic. Therefore, in the second part of this thesis a transient run with an atmospheric general circulation is analyzed with focus on the relationship between rainfall and SST on multi-annual to decadal timescales. The results from this analysis motivated a sensitivity experiment with the same model, to verify that local SST anomalies can be the cause for the correlation that was found in the transient run.
Numerical simulations with state-of-the-art coupled ocean-atmosphere models imply, that climate change will also involve huge changes in the ocean circulation (e.g. IPCC, 2013).
For the North Atlantic, many models simulate a slowdown of the Atlantic Meridional Overturning Circulation (AMOC) in the future in response to warmer temperatures in the regions where extremely cold temperatures are a driving factor for the thermohaline circulation in present day. Also freshwater input from enhanced precipitation and melting ice play a role in changing the water density in the high latitudes. Furthermore, changes in the North Atlantic wind patterns are likely to influence the wind-driven ocean circulation.
The Gulf Stream is part of the thermohaline driven AMOC as well as of the wind driven North Atlantic subtropical gyre. The objective of the last part of this work is to understand the feedback of this ocean changes on the atmosphere, with a focus on the impact on the processes in the Gulf Stream region. A series of sensitivity experiments were performed using SST simulated by the MPI model, following the RCP8.5 scenario, for the CMIP5.
The coupled model shows a strong warming of the North Atlantic in connection with a northward shift of the boundary between the subtropical and the subpolar gyre (Matthias Fischer, pers. communication). The motivation for these experiments was to get a better understanding of how the atmospheric part of the model responds to generally warmer SSTs on the one hand, and a shift of the SST fronts on the other, since especially the position of the storm track could be sensitive to the position of the SST front (Ogawa et al., 2012; Nakamura et al., 2004; Brayshaw et al., 2008).
2 The role of model resolution in the
simulated response to the Gulf Stream SST front
2.1 Introduction
Model resolution is a major factor controlling the computational costs of climate model integrations. While coarse resolution integrations are cheap to run, they suffer from the fact that physical and dynamical processes, with spatial scales similar or smaller than the resolution of the model, might not be realistically represented. Hence, a compromise between available computational resources and resolution of the processes, relevant for the purpose of a model study, has to be found.
Early studies already suggested that enhanced model resolution leads to major improve- ments in terms of global model performance (Boville, 1991). Recent studies show that further enhancements of model resolution can lead to improvements in NAO prediction on seasonal time scales (Scaife et al., 2014). It was shown that enhancements in model resolu- tion can lead to a better reproduction of blocking frequency in the HADGEM3, through a reduction of the ocean model’s mean state SST bias (Scaife et al., 2011). For ECHAM5 it was shown that the representation of the climate mean state in general benefits from higher horizontal resolution, but at higher horizontal resolutions also an appropriate vertical res- olution is required to get this enhancements (Roeckner et al., 2006; Hagemann et al., 2006).
Jung et al. (2006) combined an analysis of cyclone statistics from the ERA40 reanalysis and seasonal model integrations with the ECMWF model, both at various horizontal trunca- tions. They showed that the representation of intense extra-tropical cyclones becomes much more realistic in very high resolution integrations (i.e. TL255) and that at least for the intense cyclones, this improvement can be connected to improvements in the physical and dynamical processes in the model, and not just to the pure effect of better resolving small scale features (so-called “truncation effect”). In contrast, for shallow cyclones, the ben- efits concerning shallow cyclones are basically limited to the effects of the truncation effect.
2 The role of model resolution in the simulated response to the Gulf Stream SST front
It was shown that the occurrence of extreme precipitation events shows a strong dependence on model resolution (Volosciuk et al., 2015). Extreme events often cause very small scale precipitation maxima with spatial scales smaller than the model resolution. Therefore, the maximum precipitation is partly smoothed out, when looking on the spatially averaged values for an entire grid box (the so-called “averaging effect”, Chen and Knutson (2008)).
The coarser the model resolution, the more this effects influences the precipitation maxima computed by the model. Volosciuk et al. (2015) show that the resolution dependent change of extreme precipitation goes beyond this pure smoothing effect, but also includes effects arising from changes in the physical processes itself (the so-called “scale interaction effect“).
The latter changes are also persistent, when running the model in a higher resolution and smoothing the output data to a coarser grid in postprocessing. A major improvement in terms of representation of physical processes due to model resolution is made when enhancing resolution from T63 to T106. The benefit is larger in convective regions than in regions where the precipitation is to large extent linked to large-scale weather systems.
Beyond horizontal resolution, vertical resolution can play a role (e.g. Pope et al., 2001;
Volosciuk et al., 2015). Recent studies show, that the stratosphere can modulate the atmospheric signal arising from mid-latitude ocean-atmosphere interaction in the North Atlantic sector (Omrani et al., 2014).
This chapter focuses on the effect of resolution on the mean state by comparing seasonal climatologies for summer and winter from satellite SST-forced ECHAM5 ensembles, in dif- ferent horizontal and vertical resolutions, to NCEP-NCAR reanalysis data. The objective is, to investigate which resolution (if any of the resolutions considered) is sufficient to re- produce the observed processes connected to mid-latitude SST fronts in the North Atlantic sector correctly.
2.2 Model & Data
In this chapter a set of model runs performed with ECHAM5 (Röckner et al., 2003) is used.
The model was driven by weekly varying SST and sea ice conditions from the NOAA-OI dataset (Reynolds et al., 2002). The dataset provides daily SST data at a resolution of 0.25°, so that SST fronts can be resolved in some detail. A set of experiments with different horizontal resolutions, i.e. T31, T42, T63, T106 and T213 is considered. The two lowest resolutions were performed at a vertical resolution of 19 levels, the three others at 31 levels.
The model top in all cases is at 10 hPa. For all resolutions an ensemble of three members,
2.3 Results
covering the period from 1982 to 2009, was analysed.
For verification of the modelled precipitation, the climatological means from two observa- tional data sets (fig. 2.1) are compared to that simulated by ECHAM5 (figs. 2.2 & 2.3).
The first dataset, TRMM 3B43, is a merged product from the Tropical Rainfall Measuring Mission, combining high resolution satellite measurements with rain gauge data. It has the advantage of a very high resolution (0.25°x0.25°), but the limitation to be only available for part of the period of the model integrations (1998 to 2009). The second dataset, CMAP, combines satellite estimates, gauge observations, and numerical model outputs (Xie and Arkin, 1997). It is available for the whole period of the model integrations, but has a coarse resolution (2.5°x2.5°, corresponds approximately to T42). For low-level convergence and vertical winds the modelled fields are compared to the NCEP-NCAR reanalysis (Kalnay et al., 1996), which is available at 2.5° spatial resolution since 1948 onwards.
2.3 Results
In general ECHAM5 is able to reproduce well the main features of the precipitation pat- terns in the North Atlantic, but shows the tendency to overestimate total precipitation (figs. 2.1, 2.2 & 2.3 & table 2.1). The amplitude of the signal strongly depends on the resolution, since neither the low-resolution model runs nor the low-resolution observational product is capable to resolve the small-scale precipitation maxima in the region of the SST front. We start our comparison of the differently resolved runs with an analysis of the seasonal mean patterns of total and convective precipitation (fig. 2.2 and fig. 2.3). The figures show the deficiencies of the coarser resolution cases to resolve details of the pre- cipitation pattern. fig. A.1 and A.2 in the Appendix additionally shows the same figures, but with all data interpolated to the coarsest resolution to allow a direct quantitative comparison between the different runs without being misled by extreme maxima on small spatial scales, which would not change the integral over a coarser grid box. The maps in fig. A.3 to A.5 in the Appendix further show the spatial distribution of the changes for the different precipitation types with all data. For getting a quantitative estimate of differen in precipitation, box means for the region of the precipitation maximum were computed (table 2.1, see boxes in fig. 2.2 and fig. 2.3 for definition of these regions).
In summer, at coarse resolution the model shows a maximum of total precipitation north- west of Florida, mainly caused by a local maximum of convective precipitation there (fig. 2.2). This maximum vanishes when switching to a higher model resolution. In gen-
2 The role of model resolution in the simulated response to the Gulf Stream SST front
Summer Winter
TRMM (1998-2009)
(a) (b)
CMAP (1982-2009)
(c) (d)
Figure 2.1:Seasonal Climatologies of total precipitation (in mm/day) in the TRMM 3B43 dataset (a & b, 1998 to 2009) and the CMAP dataset (c & d, 1982 to 2009) for summer (JJA, left column) and winter (DJF, right column). The boxes indicate the region used for the boxmeans shown in table 2.1.
2.3 Results
total convective
T031L19
(a) (b)
T042L19
(c) (d)
T063L31
(e) (f )
T106L31
(g) (h)
T213L31
(i) (j)
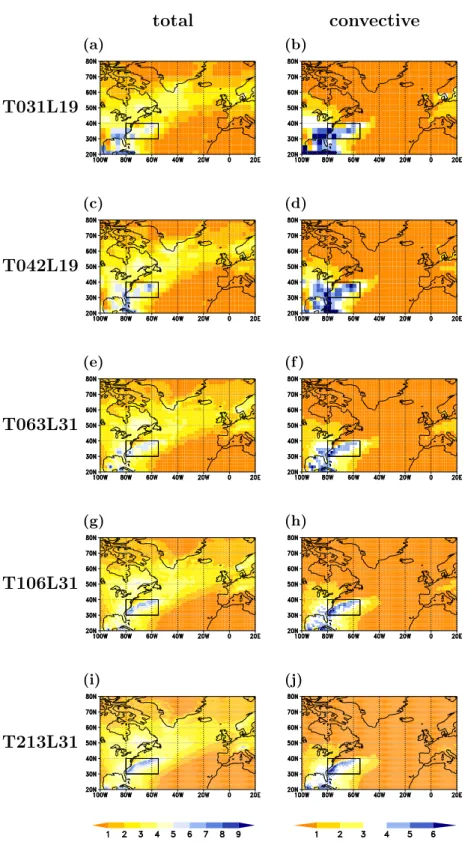
Figure 2.2: Climatological summer-time (JJA) precipitation in a set of AGCM runs at different resolutions. Total (left) and convective (right) precipitation (in mm/d, averaged over three ensemble members per run, covering the period 1982-2009) from ECHAM5 runs at T031L19 (a and b), T42L19 (c and d), T063L31 (e and f), T106L31 (g and h)
2 The role of model resolution in the simulated response to the Gulf Stream SST front
total convective
T031L19
(a) (b)
T042L19
(c) (d)
T063L31
(e) (f )
T106L31
(g) (h)
T213L31
(i) (j)
2.3 Results
summer winter
70°W-40°W/32°N-45°N 80°W-55°W/30°N-40°N convective large-scale total convective large-scale total
T31L19 3.646 0.341 3.986 2.334 3.290 5.624
T42L19 4.102 0.279 4.381 2.067 3.052 5.119
T63L31 3.635 0.631 4.266 1.980 3.704 5.684
T106L31 3.384 0.949 4.333 1.725 3.970 5.695
T213L31 3.388 1.198 4.586 1.527 4.110 5.638
CMAP 3.704 4.910
Table 2.1:Climatological boxmeans of different precipitation types for the boxes indicated in Figs. 2.2 and 2.3.
eral, the convective precipitation shows a tendency to decrease over land, while there is only modest change in convective precipitation over the oceans. The precipitation band fol- lowing the southern flank of the Gulf Stream SST front is only poorly reproduced in coarse resolution, even though there is a local maximum in convective precipitation. Enhancing the resolution slightly reduces this convective precipitation, but the total precipitation is enhanced anyway, due to an increase in large-scale precipitation (table 2.1). The detailed structure of the narrow precipitation band is only distinct when running the model in T213 resolution.
In winter, also a decrease in convective precipitation and an increase in large-scale pre- cipitation can be found with increasing resolution. However, in contrast to summer, this does not lead to qualitative changes in total precipitation in the Gulf Stream region, since the response of large-scale and convective precipitation nearly compensate each other (ta- ble 2.1). Local patches of enhanced precipitation in regions with strong orography (e.g.
along the Norwegian coast, in the Alps and around the north-eastern corner of the Iberian peninsula) are not resolved in the coarse resolutions, but also do not cause quantitative precipitation changes when interpolating them to a coarser grid.
It has been shown that rainfall in the Gulf Stream region goes along with low-level wind convergence and deep upward motion (Minobe et al., 2008). Therefore, the dependence of low- and mid-level upward wind and low-level wind convergence on model resolution
2 The role of model resolution in the simulated response to the Gulf Stream SST front
(a)T031L19 (b)T042L19
(c)T063L31 (d)T106L31
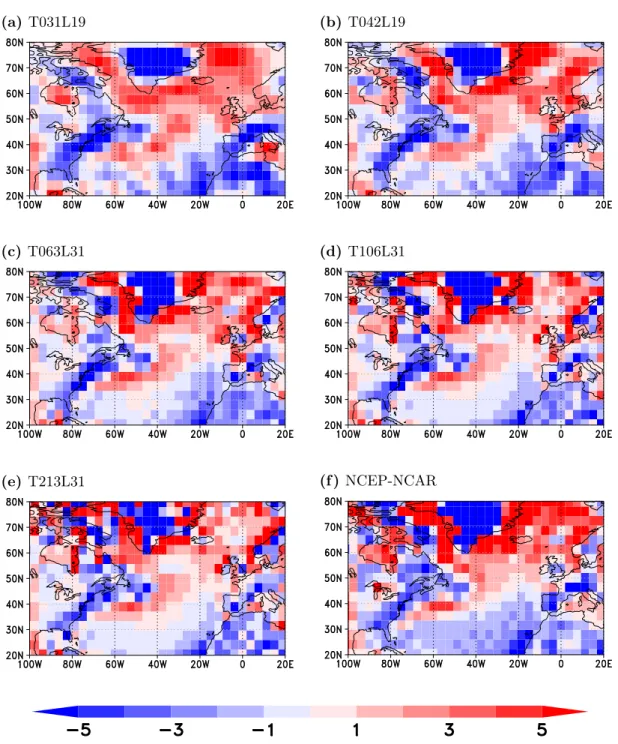
(e) T213L31 (f )NCEP-NCAR
Figure 2.4: Summer-time means of the 10m-wind convergence (in 10-6/s) from ECHAM5 at different resolutions ((a) to (e)) and from NCEP-NCAR reanalysis data (f). For better comparability, all data were interpolated to the same horizontal grid, i.e. T31.
2.3 Results
were analyzed. In summer large parts of the subtropical Atlantic show large-scale wind- divergence, as usual for the regions of the descending branch of the Hadley cell. In contrast, the region around the Gulf Stream shows wind convergence in the region between 80°W to 50 °W and 30°N to 45 °N (fig. 2.4). The model shows only very little depencence of the summer-time low-level convergence to model resolution.
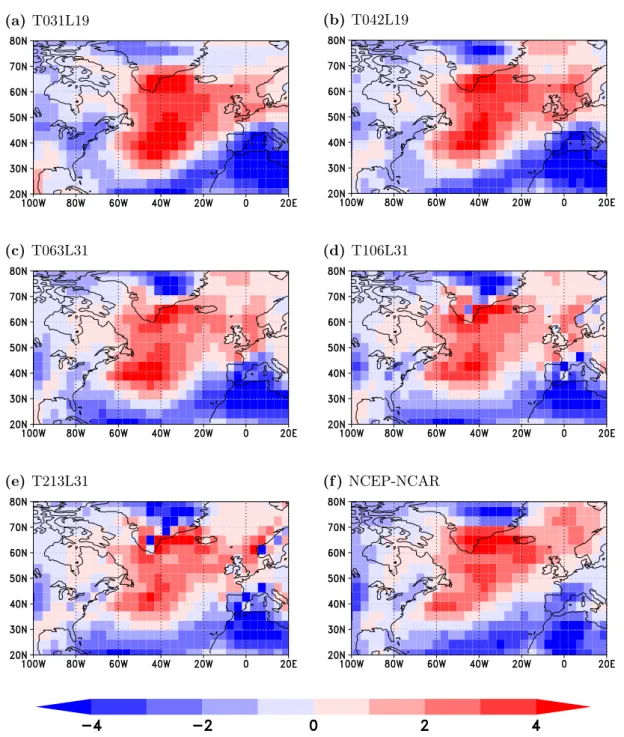
Resulting summer-time upward motion also shows little sensitivity to resolution in the low levels (fig. 2.5). However, mid-tropospheric upward motion shows a slightly higher dependence on resolution (fig. 2.6). While all resolutions match the NCEP-NCAR re- analysis (fig. 2.6f) qualitatively well, low resolutions show a quantitative overestimation, while intermediate and high resolutions reproduce the maxima from the reanalysis also quantitatively (fig. 2.6d to 2.6e). However, it has to be considered, that NCEP-NCAR is a low resolution product based on model output, and results might differ when comparing to a higher resolution product.
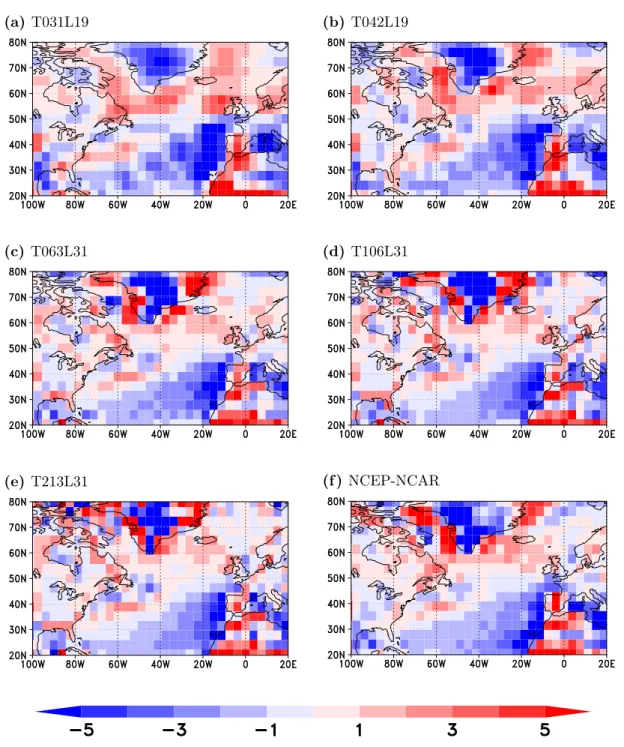
In winter the low-level convergence pattern shows a dipole pattern with divergence along the North American east coast and convergence south-east of it (fig. 2.7). The absolute values are enhanced with respect to summer. For the low resolutions, a maximum is found around 40°N/40°W. For the resolutions beyond T063L31, the pattern turns more zonal (fig. 2.7c to 2.7e). The associated pattern of low-level upward wind shows a westward shift of its local maximum with enhanced resolution. However, similar to summer, not much improvement with respect to NCEP-NCAR can be found beyond T063L31 resolution. The mid-troposphere uplift (fig. 2.9) shows a much wider pattern than found in the low levels.
Similar to summer, the low resolutions quantitatively overestimate the strength of the lifting, while this overestimation vanishes in the finer resolution runs.
As we will show later in chapter 3 the precipitation-generating mechanisms in ECHAM5 differ between summer and winter. Winter-time precipitation in the model can be con- nected to atmospheric fronts associated with the through-passing cyclones in the North Atlantic storm-track. It has been shown, that bandpass-filtered variances can give a good estimator for the mean state of storm tracks (Chang, 2009). Therefore an analysis of the standard deviation of 2 to 8 day bandpass-filtered 850 hPa potentiality height anomaly as proxy for the intensity and the position of the winter-time storm-track was performed (fig. 2.10). In comparison to the NCEP-NCAR reanalysis, the model in general produces a too strong potentiality height variability on these time scales and the orientation of the storm track is too zonal in the coarse runs. The tilt of the storm track becomes slightly more North-eastward with refinement of the model resolution, but the intensity of the
2 The role of model resolution in the simulated response to the Gulf Stream SST front
(a)T031L19 (b)T042L19
(c)T063L31 (d)T106L31
(e) T213L31 (f )NCEP-NCAR
Figure 2.5: Summer-time means of 850 hPa upward wind (in Pa/s) for ECHAM5 at different resolutions (a to e) and from NCEP-NCAR reanalysis data (f). For better com- parability, all data were interpolated to the same horizontal grid, i.e. T31.
2.3 Results
(a) T031L19 (b) T042L19
(c) T063L31 (d) T106L31
(e) T213L31 (f ) NCEP-NCAR
Figure 2.6: Summer-time means of 500 hPa upward wind (in Pa/s) for ECHAM5 at different resolutions (a to e) and from NCEP-NCAR reanalysis data (f). For better com- parability, all data were interpolatet to the same horizontal grid, i.e. T31.
2 The role of model resolution in the simulated response to the Gulf Stream SST front
(a)T031L19 (b)T042L19
(c)T063L31 (d)T106L31
(e) T213L31 (f )NCEP-NCAR
Figure 2.7: Winter-time means of the 10m-wind convergence (in 10-6/s) for ECHAM5 at different resolutions (a to e) and from NCEP-NCAR reanalysis data (f). For better comparability, all data were interpolated to the same horizontal grid, i.e. T31.
2.3 Results
(a) T031L19 (b) T042L19
(c) T063L31 (d) T106L31
(e) T213L31 (f ) NCEP-NCAR
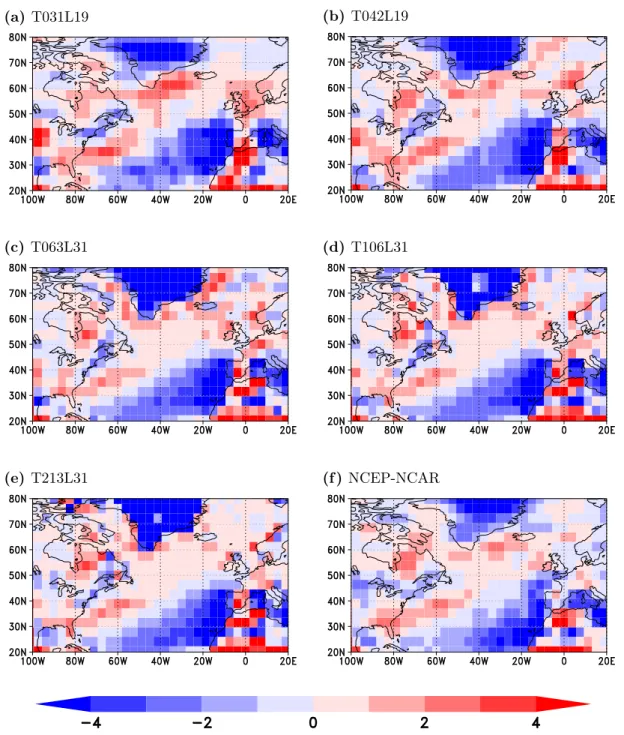
Figure 2.8: Winter-time means of 850 hPa upward wind (in Pa/s) for ECHAM5 at dif- ferent resolutions (a to e) and from NCEP-NCAR reanalysis data (f). For better compa- rability, all data were interpolated to the same horizontal grid, i.e. T31.
2 The role of model resolution in the simulated response to the Gulf Stream SST front
(a)T031L19 (b)T042L19
(c)T063L31 (d)T106L31
(e) T213L31 (f )NCEP-NCAR
Figure 2.9: Winter-time means of 500 hPa upward wind (in Pa/s) for ECHAM5 at dif- ferent resolutions (a to e) and from NCEP-NCAR reanalysis data (f). For better compa- rability, all data were interpolated to the same horizontal grid, i.e. T31.
2.4 Summary & Discussion
variability is even increased, especially in the region around Newfoundland, where the variability has its maximum. With increased resolution, the modeled storm track splits up into two separated maxima, one at the coast of Newfoundland and one slightly west of Iceland. This split structure is also found in the reanalysis data. Contrarily, enhanced vertical resolution seems to dampen the variability, as it can be seen by comparing fig.
2.10b and fig. 2.10c.
Resolving small-scale features in the region of the SST front can have an important effect on the modeled latent and sensible heat fluxes at the ocean surface with potential impacts on large-scale processes, e.g. the North Atlantic storm track (Piazza et al., to be submit- ted). Therefore, the resolution dependence of latent and sensible heat fluxes were analysed (Figs. 2.11 and 2.12). Since fluxes strongly depend on the temperature difference between the ocean and the atmosphere, they are very small in summer. For this reason, this anal- ysis is restricted to winter. The patterns for both quantities fit well with that from the NCEP-NCAR reanalysis, while the amplitude for both is slightly underestimated. Again it has to be considered, that fluxes are also a modeled quantity in the coarse resolution re- analysis product. Both quantities only show very little resolution dependence in ECHAM5.
Quantitative differences of the finer resolutions with respect to T31L19 are shown in the appendix, including significance tests based on a bootstrapping algorithm (fig. A.11 to A.13).
2.4 Summary & Discussion
Model resolution in ECHAM5 has an effect, exceeding that of pure smoothing of local structures. The most distinct differences occur for precipitation. Convective precipitation in general shows a decrease in the region of the Gulf Stream SST front for both seasons as resolution is increased. In winter total precipitation only shows little dependence on model resolution. This indicates that the reduction in convective precipitation is nearly compensated by an increase in large scale precipitation.
The other quantities that were analyzed show less resolution dependency than precipita- tion. This can be seen as an indication, that the effects seen in precipitation are mainly caused by a resolution dependency of the parameterisation that are involved in generating precipitation in the model, rather than in changes in the physical processes. However, there are moderate changes also in some other quantities that were discussed.
2 The role of model resolution in the simulated response to the Gulf Stream SST front
(a)T031L19 (b)T042L19
(c)T063L31 (d)T106L31
(e) T213L31 (f )NCEP-NCAR
Figure 2.10: The winter-time storm track in ECHAM5. Shown is the standard deviation of the 2 to 8-day bandpass-filtered 850 hPa geopotential height (in m) over the 3 ensemble members of each resolution.
2.4 Summary & Discussion
(a) T031L19 (b) T042L19
(c) T063L31 (d) T106L31
(e) T213L31 (f ) NCEP-NCAR
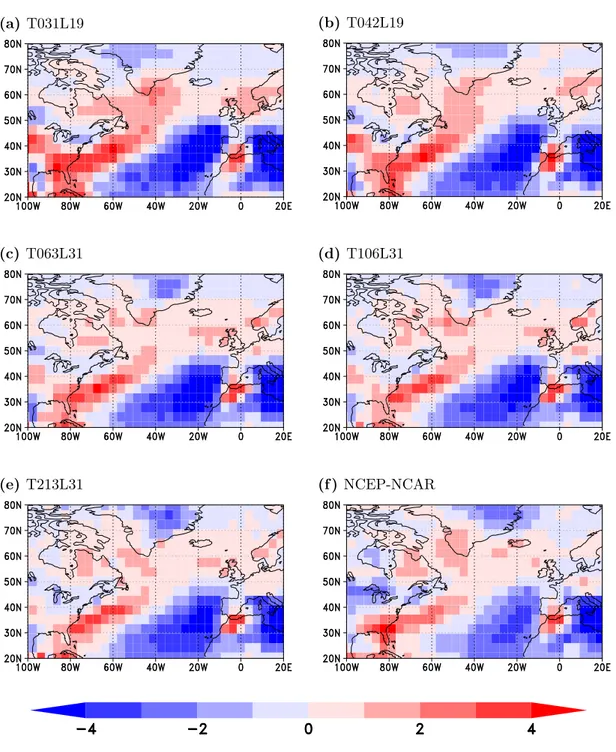
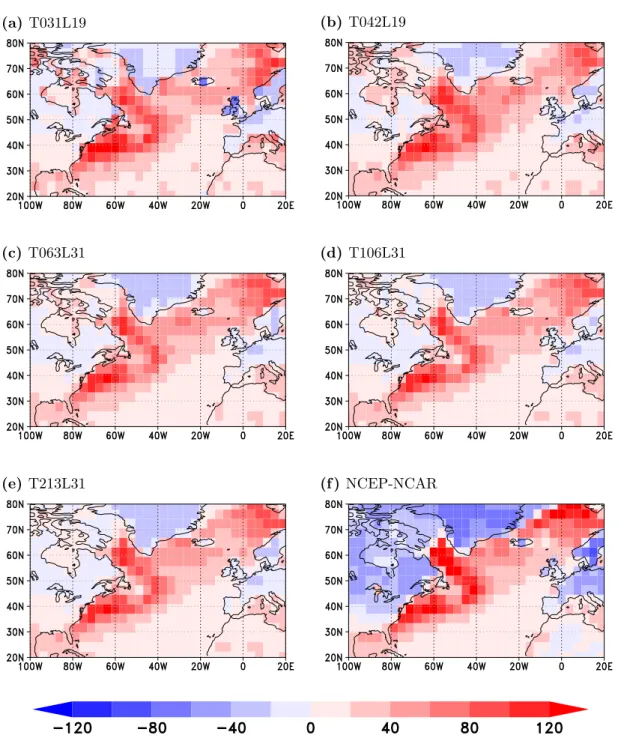
Figure 2.11: Winter-time means of upward sensible heat flux (in W/m2) for ECHAM5 at different resolutions (a to e) and from NCEP-NCAR reanalysis data (f). For better comparability, all data were interpolated to the same horizontal grid, i.e. T31.
2 The role of model resolution in the simulated response to the Gulf Stream SST front
(a)T031L19 (b)T042L19
(c)T063L31 (d)T106L31
(e) T213L31 (f )NCEP-NCAR
Figure 2.12: Winter-time means of upward latent heat flux (in W/m2) for ECHAM5 at different resolutions (a to e) and from NCEP-NCAR reanalysis data (f). For better comparability, all data were interpolated to the same horizontal grid, i.e. T31.
2.4 Summary & Discussion
Also the representation of the North Atlantic storm track improves in the mean with enhanced resolution. This study only focused on the resolution dependence of the mean climatological state and for the storm track analysis restricts to the bandpass-filtered 850 hPa potentiality height variability. However, this quantity only represents the integral over a variety of storms of different intensity and lifetime and therefore this kind of analysis does not provide any information about potentially useful statistics like cyclone frequency or the typical intensity. It was shown, that the resolution dependency is higher for intense and long-living systems (Jung et al., 2006). A more detailed analysis of the cyclone statistics in the model runs from this work, including application of a cyclone tracking algorithm, is provided by Kedzierski (2013).
Not only horizontal, but also vertical resolution seems to play a role for the processes analyzed. The higher vertical resolutions in our case mainly affect the model levels higher up in the atmosphere. Therefore, the changes related to enhanced vertical resolution are likely connected to a better representation of processes in the upper troposphere.
In general, the improvements in model performance are most prominent for the refinement from low to intermediate resolution. Refinement of the model grid beyond T63 only brings minor improvements in terms of the climatological mean state. However, it has to be considered that extreme events, like extreme rainfall or intense cyclones, might show a higher resolution dependency than the mean state and thus require a higher resolution (Volosciuk et al., 2015; Jung et al., 2006),.
Acknowledgements
I would like to thank Vladimir Semenov and Wan-Ling Tseng for providing the data from their NOAA-OI forced runs.
3 Simulated response to inter-annual SST variations in the Gulf Stream region
Ralf Hand1,2, Noel Keenlyside3, Nour-Eddine Omrani1, and Mojib Latif1,2 Published in Climate Dynamics Vol. 42, 2014, Springer, Heidelberg
Abstract
Recent studies show that mid-latitude SST variations over the Kuroshio-Oyashio Exten- sion influence the atmospheric circulation. However, the impact of variations in SST in the Gulf Stream region on the atmosphere has been less studied. Understanding the at- mospheric response to such variability can improve the climate predictability in the North Atlantic Sector. Here we use a relatively high resolution (∼1 deg.) Atmospheric General Circulation Model (AGCM) to investigate the mechanisms linking observed 5-year low- pass filtered SST variability in the Gulf Stream region and atmospheric variability, with focus on precipitation. Our results indicate that up to 70% of local convective precipitation variability on these timescales can be explained by Gulf Stream SST variations. In this region, SST and convective precipitation are strongly correlated in both summer (r=0.73) and winter (r=0.55). A sensitivity experiment with a prescribed local warm SST anomaly in the Gulf Stream region confirms that local SST drives most of the precipitation vari- ability over the Gulf Stream. Increased evaporation connected to the anomalous warm SST plays a crucial role in both seasons. In summer there is an enhanced local SLP min- imum, a concentrated band of low level convergence, deep upward motion and enhanced precipitation. In winter we also get enhanced precipitation, but a direct connection to deep vertical upward motion is not found. Nearly all of the anomalous precipitation in winter is connected to passing atmospheric fronts. In summer the connection between precipitation and atmospheric fronts is weaker, but still important.
Keywords: Ocean-atmosphere interaction, Gulf Stream, SST fronts, North Atlantic
1GEOMAR Helmholtz Centre for Ocean Research, Kiel, Germany
2Christian-Albrechts-Universität, Kiel, Germany
3Universitet i Bergen, Bergen, Norway
3 Simulated response to inter-annual SST variations in the Gulf Stream region
3.1 Introduction
Oceanic western boundary currents (hereafter WBCs) are characterized by strong north- ward heat transport, resulting in strong anomalous warm SST-deviations from the zonal mean and large ocean-atmosphere fluxes of heat and moisture. The sharp SST fronts in the regions where the WBCs merge with the cold water masses of the subpolar gyre influence the climatological state of the entire troposphere (Minobe et al., 2008). Local- ized low sea level pressure (SLP) over the warm flank of the SST front produces low-level convergence and a tight band of precipitation. The climatological influence of the Gulf Stream SST front differs seasonally: A deep heating mode with convection mainly occurs in summer over the Florida current and the western Gulf Stream, while in winter the influence is restricted to a shallow heating mode, influencing mainly the marine boundary layer with a center of action over the eastern Gulf Stream and its extension (Minobe et al., 2010). Additionally, the maintenance of surface baroclinicity by the SST front can act as an anchoring mechanism for the Atlantic storm track (Nakamura et al., 2004). Idealized aqua planet simulations confirmed this result, showing that increased mid-latitude SST gradients lead to stronger storm tracks and the storm track response is sensitive to the position of the SST anomaly (Brayshaw et al., 2008). The dependence of the mid-latitude storm track activity on the latitude of an SST front relative to the atmospheric subpolar jet was shown by another idealized aqua planet experiment (Ogawa et al., 2012).
The distinct climatological impact of the SST front raises the question to what extent do frontal SST variations influence atmospheric variability? This question forms the main motivation of this study. The general influence of mid-latitude ocean variability on the at- mosphere has been extensively investigated, but controversy still remains. AGCM forced with observed SST were used to argue that extra-tropical SST impact significantly the extra-tropical circulation (Rodwell et al., 1999). However, extra-tropical SST variability, particularly on shorter time-scales, mostly results from atmospheric variability (e.g. Cayan, 1992). Conceptional linear model studies based on this assumption show that such AGCM experiments are consistent with only a moderate influence of extra-tropical SST on the atmosphere (Barsugli and Battisti, 1998; Bretherton and Battisti, 2000). Kushnir et al.
(2002) concluded in their synthesis paper that the extra-tropical ocean variability has an influence onto the atmosphere, but that this influence is only small compared to the in- ternal atmospheric variability. Fan and Schneider (2012) showed, that the North Atlantic Tripole SST pattern is mainly controlled by weather noise, in particular to the heat flux variations related to it. However, on longer time scales ocean dynamics contribute to SST variations (e.g. Visbeck et al., 1998) and these may impact the mid-latitude atmosphere
3.1 Introduction
(e.g. Bjerknes, 1964). In particular, statistical analysis using an extended reconstruction of turbulent heat-fluxes show that in the sub-polar North Atlantic on the short scales the SSTs are mainly controlled by the atmosphere, while on ten-year and longer time-scales ocean dynamics play the more important role (Gulev et al., 2013). Furthermore, recent work suggest that stratosphere-troposphere interaction, which has been poorly resolved in most models, is a key element in the atmospheric response to mid-latitude SST variability in winter (Omrani et al., 2014).
Only a limited number of studies have begun to investigate the role of mid-latitude SST fronts on the atmosphere (Xie, 2004). Recent studies of the Pacific show that the Kuroshio variability interacts with the atmospheric circulation. Positive early winter SST anomalies in the Kuroshio region cause a northward shift in the storm track and thus induce an anticyclonic circulation response in the region of the Aleutian low (Taguchi et al., 2012).
For the North Atlantic the connection between extra-tropical low-frequency SST variabil- ity and the atmosphere remains a topic of current research. Since North Atlantic decadal SST variability has a predictable component (Collins et al., 2006; Griffies and Bryan, 1997;
Keenlyside et al., 2008; Pohlmann et al., 2009; Robson et al., 2012; Yeager et al., 2012), improved understanding of these processes potentially will enhance climate prediction in the North Atlantic region.
Our aim here, is to better understand the mechanisms connecting low-frequency SST vari- ations in the Gulf Stream region to the atmosphere. We focus on the locally driven pre- cipitation changes, and as precipitation data in this region are limited we rely on AGCM experiments using a relatively high horizontal resolution that begins to resolve the Gulf Stream SST front. Additionally, we base our analysis on convective precipitation as we expect and find in our AGCM experiments that convective precipitation, by its nature, is more closely related to SST than large-scale (stratiform) precipitation. A novel aspect of our study is that we analyze the impact of the oceanic SST front on the atmosphere using an atmospherbenleric front detection method. It has be shown, that up to 90% of the pre- cipitation in the mid-latitude storm-tracks can be connected to atmospheric fronts (Catto et al., 2012). We expect processes determining precipitation acting in winter to be more affected by the synoptic scale events compared to those acting in summer, and we would like to understand how the SST-induced synoptic scale changes affect the precipitation in the Gulf Stream region. A description of the model, experiments and the methods used in this study is given in section 2. Results are presented in section 3, followed by a summary and conclusions in section 4.
3 Simulated response to inter-annual SST variations in the Gulf Stream region
3.2 Methods
Experiments described in this study were performed using the ECHAM5 atmospheric gen- eral circulation model developed at the Max-Planck-Institute for Meteorology. ECHAM5 is a spectral model, and it was run at T106 horizontal resolution (∼100km) with 31 verti- cal levels and a top at 10 hPa. A comprehensive description of the model, including it’s sub-grid scale physics is given by (Röckner et al., 2003). Here only details most relevant to precipitation are summarized. The convective precipitation is produced from the cumulus convection parametrization. ECHAM uses the Tiedtke (Tiedtke, 1989) mass flux scheme with modifications for penetrative convection according to Nordeng (1994). For deep con- vection the scheme use a closure based on convective available potential energy (CAPE), while for shallow convection the closure is based on large-scale moisture convergence. En- trainment and detrainment rates for penetrative convection are also related to CAPE.
For large scale precipitation, the model uses a stratiform cloud scheme which is based on prognostic equations for the mixing ratios of the water phases, bulk cloud microphysics (Lohmann and Roeckner, 1996) and a statistical cloud cover scheme.
Hagemann et al. (2006) assess the performance of the hydrological cycle simulated by ECHAM5 in a series of SST and SIC forced experiments at different horizontal and ver- tical resolutions, including that used here. As most recent AGCMs, global averaged precipitation and evaporation are overestimated compared to observations, particularly over the oceans. However, observations of precipitations over oceans rely on indirect satel- lite measurements and have large uncertainties, since gauge data are usually not available.
Nevertheless, comparison to different observational datasets shows that the biggest biases occur in the tropics, particularly in the summer season. In the midlatitudes the model performs better.
Three experiments were performed: The first is a five-member ensemble simulation driven with monthly varying observed SSTs and sea ice concentrations (SIC) from the HadISST dataset. The simulations cover the period 1870 to 2007 and ensemble members differ only in their initial conditions. The second is a 60-year long control experiment (CTL) driven with climatological SST and SIC conditions derived from the HADISST dataset for the period from 1870 to 2007. The third experiment is a sensitivity experiment (SENS), which has the same forcing as the control experiment, except in the Gulf Stream region (25°N to 55°N), where a warm SST anomaly was added. The pattern is associated with en- hanced convective precipitation over the Gulf Stream region in the five-member transient simulation and was derived as follows: First, convective precipitation was averaged over
3.2 Methods
the region 65°W to 40°W and 38°N to 40°N and over the five member ensemble to form an index (Fig. 7). Second, a 5-year low-pass 10th order Butterworth filter was applied.
The Butterworth filter is designed to have an abrupt decline in a small frequency range around the cutoff frequency and a flat, monotonous characteristic elsewhere. Details on how to calculate the filter coefficients can be found in Butterworth (1930). To maintain the seasonal cycle, we applied the filter to the time series of seasonal means for each season separately. The purpose of the filtering is to focus on time scales when ocean dynamics begin to control SST variations in this region (Gulev et al., 2013); however, we cannot ex- clude that the SST variations are also driven thermodynamically by internal atmospheric variability (Cayan, 1992; Bretherton and Battisti, 2000; Czaja and Frankignoul, 2002).
Furthermore, simulated and observed precipitation have an opposite relationship to the underlying SST on inter-annual timescales (not shown), consistent with the SST variability on inter- annual timescales being mostly atmospheric forced. The forcing pattern is the composite difference between SST in years when the smoothed index exceeds plus one standard deviation and the years when it exceeds minus one standard deviation. A linear smoothing between anomaly and climatology was applied between 20-25°N and 55-60°N bands to avoid potential numerical artifacts.
Results are analyzed using linear regression and composite analysis. We perform an anal- ysis of variance (ANOVA) of the five member ensemble simulations to detect the regions, where SST (and SIC) fluctuation have the largest influence on the atmospheric variability.
We performed ANOVA as follows (see Storch (2010) for a more detailed description): First, we define the total sum of squares (TSS):
T SS=
n
X
i=1 J
X
j=1
(Xij− hXi)2, (3.1) where the i denotes the ensemble member of an n-member ensemble (here n=5), and j the timestep of the total number of timesteps J (here J=138). X is an atmospheric quantity (e.g. precipitation). Angle brackets denote the ensemble mean and an overbar denotes a mean over all timesteps of an ensemble member. TSS can be decomposed into the so called
“treatment sum of squares (SSA)” and the “sum of squared errors (SSE)”:
T SS =SSA+SSE, (3.2)
with
SSA=n·V AR(hXi), (3.3)
3 Simulated response to inter-annual SST variations in the Gulf Stream region
and
SSE=
n
X
i=1
V AR(Xi0), (3.4)
where V AR(hXi) denotes the time variance of the time dependent ensemble mean ofX. Xi0 is the time series of X in the ith ensemble member after subtracting the ensemble mean for each timestep. SSA is a measure of variability that all ensemble members have in common (i.e. as result of a common external forcing, such as sea surface temperature), and SSE of independent (internal) variability among ensemble members (i.e., not constrained by the external forcing). The ratio between SSA and TSS provides an estimate of how much of the total variance can be explained by the external forcing. However, for finite ensemble this estimate is biased, and an unbiased estimate of the “explained variance” is given by
R2 = (SSA−J(J−1)·(n−1)SSE
T SS . (3.5)
The five member ensemble is too small to make any statistically robust assumptions.
ANOVA is thus used only for the detection of the region, where SST variability is po- tentially connected to atmospheric variability. Furthermore ANOVA can not isolate the impact of local SST variations from remote SST and SIC changes in our transient experi- ments. The SENS and CTL experiments address these issues.
We test the significance of our results assuming a 95% threshold. For correlation analysis we use a Student’s t-test, taking into account serial-correlation. For the sensitivity exper- iments we considered each year as independent (i.e., providing 60 different independent realizations) and use a bootstrapping test with 1000 permutations.
Our analysis also includes the application of the atmospheric front detection algorithm described by Berry et al. (2011). The algorithm identifies maxima of the 850 hPa equivalent potential temperature gradient and joins them to fronts using a nearest neighbor method.
Fronts are categorized into cold, warm, and stationary fronts, according to their speed and moving direction. Based on the results of the front detection, we created masks that extract only those grid points for each time step that fall within a 200 km radius of the detected fronts. A different, widely used way to investigate the effect of cyclones, is to identify and track local maxima in relative vorticity (e.g. Bengtsson et al., 2006). This method detects only the center of the storm system. However, precipitation in storm systems usually follows the associated fronts. The front detection method additionally
3.3 Results
provides information about the location of these front lines. For this reason we preferred the temperature based front detection approach to vorticity tracking.
3.3 Results
3.3.1 Simulated climatology
For a rough evaluation of the simulated precipitation in ECHAM5 in the western Atlantic region we compared the seasonal climatologies of total precipitation from our transient experiment to the TRMM 3B43 satellite product for the TRMM period from 2002 to 2007 (Fig. 3.1). The model is able to reproduce the observed precipitation band along the Gulf Stream SST front in a reasonable quality, even though the observed pattern is slightly more concentrated over the front than in the model. Whereas along the SST front the modeled winter and summer precipitation is weaker than in TRMM, in the extratropical North Atlantic outside the region of the SST front the winter precipitation is stronger. In summer the overestimation of precipitation is limited to a narrow region on the southern flank of the SST front. ECHAM overestimates the precipitation over the Caribbean. The latter bias is larger in summer than in winter. For the Gulf of Mexico the simulated precipitation is stronger, particularly in winter.
Our Control Experiment shows the key features of the observed climatological atmospheric circulation associated with the Gulf Stream front that were recently described by Minobe et al. (2008, 2010): A band of precipitation located over the warm flank of the Gulf Stream that is associated with convective precipitation, convergence of low level winds, and upward motion extending over the troposphere (Fig. 3.2). In summer the center of action is closer to the coast, whereas the main features in winter are located mainly over the Gulf Stream extension. Furthermore, convective precipitation contributes to most of the precipitation in summer over this region, while in winter precipitation is mostly large scale (Fig. 3.2a-d).
As discussed in the introduction, the SST front also acts to anchor the storm track by maintaining the surface baroclinicity (Nakamura et al., 2004). This mechanisms is likely more important in winter for collocating precipitation over the front, due to enhanced baroclinicity and storm activity. The climatological distribution of atmospheric fronts (see section 2) simulated by ECHAM5 is consistent with the ERA-40 reanalysis (Berry et al., 2011). In winter, atmospheric front occurrence is greater than in summer, and it is further south and collocated with the Gulf Stream front (3.3a-b). In winter most of the convective precipitation found over the Gulf Stream is linked to atmospheric fronts (Fig. 3.3d). In the region 60°W to 30°W and 30°N to 43°N, 73% of the convective precipitation occurs within
3 Simulated response to inter-annual SST variations in the Gulf Stream region
Figure 3.1: Climatological patterns of total precipitation (in mm/d) for the period 2002- 2007. Left (right) column shows summer (winter) patterns from the transient ensemble simulation (a-b) and the TRMM 3B43 satellite product (c-d). (e-f) show the relative difference between ECHAM5 and TRMM (in % related to the ECHAM5 climatology). In all panels the black contours represent the climatological SST field (in °C).
3.3 Results
Figure 3.2:Climatological patterns of atmospheric quantities from the control simulation forced with climatological SST and SIC. Left (right) column shows summer (winter) pat- terns for total precipitation in mm/d (a-b), convective precipitation in mm/d (c-d), 10m wind convergence in10−6m/s2 (e-f) and 500 hPa upward wind in hPa/s (g-h). Underlying
3 Simulated response to inter-annual SST variations in the Gulf Stream region
Figure 3.3: Front density and related convective precipitation (in mm/d) in the control run for summer (left column) and winter (right column). (a) and (b) Shadings show the front density plotted as relative fraction of time steps, which fall into a 200 km radius of a detected front in percent of the total number of time steps within the run. (c) and (d) Shadings show the time mean of the convective precipitation , which occurs within a 200 km radius of detected fronts. The contours represent the corresponding climatological convective precipitation.
3.3 Results
a) Summer (JJA)
SENS CTL SENS-CTL
mm/d % mm/d % mm/d % of tot. resp.
total 1,675 100 1,315 100 0,36 100
all fronts 0,9583 57,19 0,7309 55,58 0,2275 63,19 cold fronts 0,5192 31 0,4079 31,02 0,1113 30,92 warm fronts 0,4073 24,32 0,2892 21,99 0,1181 32,81 stat fronts 0,3542 21,15 0,2742 20,85 0,08 22,22
b) Winter (DJF)
SENS CTL SENS-CTL
mm/d % mm/d % mm/d % of tot. resp.
total 2,229 100 1,682 100 0,5464 100
all fronts 1,675 75,15 1,235 73,42 0,4399 80,5 cold fronts 1,227 55,05 0,9543 56,74 0,2729 49,95 warm fronts 0,4988 22,38 0,3073 8,27 0,1915 35,05 stat fronts 0,3481 15,62 0,2547 15,14 0,0934 17,09
Table 3.1: Convective precipitation within a radius of 200km around fronts, averaged for the domain 60°W to 30°W/30 °N to 43°N for the sensitivity experiment (SENS), the control experiment (CTL) and the response (SENS-CTL) for summer (a) and winter (b).
Since the same points might fall within the 200 km for more than one front type, fractions do not sum up to 100%.
3 Simulated response to inter-annual SST variations in the Gulf Stream region
the 200 km reference radius of an atmospheric front (Table 3.1a) and most (56.74%) is connected to cold fronts. Atmospheric fronts are also important in summer, as 56% of the convective precipitation occurs within the 200 km reference radius of an atmospheric front in this region, with 30% associated with cold fronts (Fig. 3.3, Table 3.1a). In both sea- sons, a significant fraction of convective rainfall occurs within a 200km radius of warm and stationary atmospheric fronts (Table 3.1). These results are consistent with synoptic scale observations that indicate convective rainfall is mostly associated with atmospheric cold fronts, while large-scale precipitation is mostly associated with warm and stationary fronts.
3.3.2 Ensemble AGCM simulations 1870-2007
Considering variability, the standard deviation of 5-year low-pass filtered convective and total precipitation show maxima over the warm flank of the Gulf Stream (Fig. 3.4a-d).
Convective precipitation explains almost all of the precipitation variability in summer, while in winter it explains around two thirds of variability. In winter the precipitation variability is also much broader-scale. The precipitation variations in winter and summer are shifted southwards with respect to the maximum SST variability, which occurs in the region of the SST front (Fig. 3.4e-f).
ANOVA of these experimens (Fig. 3.5) provides an estimate of how much of the pre- cipitation in the Gulf Stream region is related to the boundary forcing. ANOVA of total precipitation shows values over the Gulf Stream of around 10-30% in summer and generally less than 20% in winter (Fig. 3.5a,b). However, when concentrating on the convective part only (Fig. 3.5c,d), up to∼70% (box mean 65°W to 40°W/38°N to 40°N: 51.6%) of the 5- year low-pass filtered variability in summer in the region of the SST front can be explained by the oceanic boundary conditions. In winter the values are slightly lower, but still reach up til about 50% (36.0% for the box mean). The difference between total and convective precipitation in terms of ANOVA indicates that large scale precipitation is dominated by internal atmospheric variability. This makes the identification of the total precipitation signal in observations and it’s comparison to the model difficult, particularly in winter. We thus expect a stronger relationship between SST and convective precipitation compared to SST and large-scale or total precipitation. This stronger relationship can also be explained by the fact that convective precipitation is related to low-level moisture convergence and atmospheric stability, and that both of these are sensitive to SST. For these reasons we focus on convective precipitation (Fig 3.5c-d) only hereafter.
The time series of the box mean (65°W to 40°W and 38°N to 40°N) of low-pass filtered
3.3 Results
Figure 3.4: Standard deviations of 5-year low-pass filtered simulated total (a,b) and convective (c,d) precipitation (both in mm/d) over all 5 ensemble members of the transient run, and standard deviation of the observed 5-year low-pass filtered SST (e,f) for summer (left column) and winter (right column). Underlying contours is the climatological SST pattern.
3 Simulated response to inter-annual SST variations in the Gulf Stream region
Figure 3.5: ANOVA explained variance (in %) due to the boundary forcing of total precipitation for summer (a) and winter (b) and convectice precipitation in summer (c) and winter (d). As before, climatology was removed, seasonal anomalies were calculated and afterwards a 5-year low-pass filter was applied. Contours indicate climatological seasonal SSTs in °C.
3.3 Results
Figure 3.6: (a, b) SST anomalies (shadings, in K) for summer (a) and winter (b) used for the forcing of the sensitivity experiment. The patterns were derived from composite analysis using the convective precipitation time series box mean (65°W to 40°W, 38°N to 40°N) of 5-year low-pass filtered seasonal anomalies (Fig. 3.5) taken from the time varying run. Underlying contours are seasonal climatological SSTs in °C. (c, d) First EOF of 5- year low-pass filtered SST in the Gulf Stream Region (85°W to 30°W, 35°N to 50°N) (e, f) composite of convective precipitation from the time varying experiment. In Fig (c) to (f)
3 Simulated response to inter-annual SST variations in the Gulf Stream region
convective precipitation and the box mean of low-frequency SST in the region with highest explained variances are highly correlated (r=0.73 for summer, r=0.55 for winter, Fig. 3.7).
Composite analysis (methods) shows, that the difference between periods of high and low convective precipitation in this region is associated with a positive SST monopole over the region 25°W to 55°N, with largest anomalies in the Gulf Stream and it’s extension (Fig. 3.6a-b, e-f). The SST pattern strongly resembles the first EOF mode of 5-year low- pass filtered SST (Fig. 3.6c-d). The corresponding principal components are also strongly correlated with the filtered Gulf Stream convective precipitation time series (r=0.65 for summer, r=0.7 for winter; Fig. 3.7). Thus, there are indications that the SST fluctuations in the Gulf Stream region explain a significant part of the local variability in convective precipitation.
3.3.3 Response to Gulf Stream SST anomaly
Are the simulated precipitation changes locally or remotely driven and what are the mech- anisms responsible for the changes? To address these questions we perform a sensitivity experiment forced by the warm extra-tropical SST anomalies that are associated with the enhanced convective precipitation in the region of the highest explained variance (Fig.
3.5a-b, see section 3.2).
First, we consider the zonally averaged (65°W to 50°W in summer, 55°W to 35°W for winter) response over the regions where we added the SST anomaly (Fig. 3.8). In both, summer and winter, the warm SST anomaly drives increased precipitation directly to the south of the SST maximum, and a weak decrease to the north (Fig. 3.8). In summer the increased precipitation is larger and more meridionally confined than in winter. The increase is driven by enhanced convective precipitation in both seasons, while the large scale precipitation is negative and thus reduces the impact on total precipitation. Possible reasons for the latter could be that part of the available moisture for large scale precipita- tion is rained out by convective events (i.e., less moisture is detrained from deep convective plumes, a source term in the stratiform cloud scheme) or changes related to the large scale atmospheric circulation. The warm SST drives increased evaporation that exceeds the simulated precipitation increase (i.e., it is thus able to supply sufficient moisture for the local precipitation increase).
In summer the simulated convective precipitation pattern (Fig. 3.8a) matches that from the composite analysis, but is around 25% less (Fig. 3.6e); the latter is consistent with the ANOVA of convective precipitation (Fig. 3.5a). The associated circulation patterns (Fig. 3.9b-e) closely resemble those of the climatological annual mean (Fig. 3.2e-g; Minobe
3.3 Results
Figure 3.7:Time series of box means (65°W:40°W, 38°N:40°N) of 5 year low pass filtered seasonally averaged anomalies of ECHAM5 convective precipitation (in mm/day, blue), HadISST (in K, red) and first PC of the 5-year low-pass filtered Gulf Stream region SST (black, see figure 6 c/d for the associated EOF pattern) for summer (a) and winter (b).
Dashed lines mark +/- 1 standard deviation of the convective precipitation time series, which was used as threshold to create the forcing pattern for the sensitivity experiment.
3 Simulated response to inter-annual SST variations in the Gulf Stream region
Figure 3.8: Sections of anomalous SST forcing (in K, red), total precipitation (in mm/d, black)and convective precipitation response (in mm/d, blue) and evaporation response (in mm/d, green) (a) for summer averaged for the region from 65°W to 50°W, and (b) for winter averaged for the region from 55°W to 35°W.
3.3 Results
Figure 3.9: Summer response (SENS-CTL) to positive SST anomaly in the Gulf Stream region: (a) convective precipitation (in mm/d), (b) 10-m wind divergence (in10−6m/s2) (c) upward wind (in 10−2 Pa/s) and (d) sea level pressure (in hPa). (e) Cross section (zonal average between 60°W and 50°W) of horizontal wind divergence (in 10−6m/s2, contours) and upward wind (in10−2 Pa/s, shadings) (f) Evaporation (in mm/d, shadings) and evaporation minus precipitation (in mm/d, contours). Only values significant at the 95% level are shaded. In figure (a-d) the black contour line is the convective precipitation
3 Simulated response to inter-annual SST variations in the Gulf Stream region
et al. (2008)): low SLP, low level convergence and upward motion penetrating up to the mid troposphere over the anomalous SST region, but slightly shifted with respect to the maximum SST anomaly (Fig. 3.6a). The pattern of increased evaporation corresponds closely to the warm SST anomaly, as expected. Over the entire Gulf Stream and Extension region, evaporation exceeds the enhanced local precipitation.
In winter the convective precipitation pattern (Fig. 3.10a) also matches the composite analysis (Fig. 3.6f), but the response is around 40% weaker; this is also consistent with the ANOVA (Fig. 3.5b). While convective precipitation increases by up to∼1.2 mm/day, there is a small decrease in large scale precipitation (not shown). As in summer, enhanced evaporation exceeds local precipitation over the entire Gulf Stream and extension (Fig.
3.10b). In contrast to the summer, the coherent response among SLP, low level conver- gence, and mid-troposphere upward motion is missing in winter (not shown).
Our SST forcing causes a northward shift in the SST gradient, and tends to strengthen the gradient to the north, while weaken it to the south. This will impact low-level baroclinicity and would tend to force a northward shift in the storm track and weakening to the south.
Consistently we found indications for a slight northward shift of the atmospheric frontal activity in winter (not shown). However, the SST anomaly we add is small compared to the climatological gradient and SST variations are only one of the several factors con- trolling the variability in the position and the strength of the storm track. The biggest enhancements in front density are not collocated with the maximum of enhanced rainfall and the shift in atmospheric front density is too small to explain the precipitation signal.
The atmospheric front tracking analysis, however, shows that around 60% of the sum- mertime convective precipitation simulated in response to the warm SST anomalies is associated with atmospheric fronts (Fig. 3.11a, Table 3.1a). Thus, the enhanced con- vective precipitation is due to more rainfall per front, rather than to an enhancement in frequency of atmospheric fronts. The increase is found for all atmospheric front categories, and can be explained by an almost equal increase in cold and warm front precipitation (Fig.
3.11b, Table 3.1a). Compared to the summer climatology this represents a proportionally stronger increase for warm fronts (Table 3.1a).
As expected, for boreal winter much more of the precipitation response is associated with atmospheric fronts. Around 80% of the increased convective precipitation is associated with atmospheric fronts (Fig. 3.10c, Table 3.1b). The largest part of the response is con- nected to cold fronts, which produce about half of the additional winter precipitation in