© Author(s) 2016. CC Attribution 3.0 License.
Variations in triple isotope composition of dissolved oxygen and primary production in a subtropical reservoir
Hana Jurikova1,a, Tania Guha1, Osamu Abe2, Fuh-Kwo Shiah1, Chung-Ho Wang3, and Mao-Chang Liang1,4,5
1Research Center for Environmental Changes, Academia Sinica, 11529 Taipei, Taiwan
2Graduate School of Environmental Studies, Nagoya University, Chikusa, 464-8601 Nagoya, Japan
3Institute of Earth Sciences, Academia Sinica, 11529 Taipei, Taiwan
4Graduate Institute of Astronomy, National Central University, 32001 Jhongli, Taiwan
5Department of Physics, University of Houston, Houston, TX 77004, USA
anow at: GEOMAR Helmholtz-Zentrum für Ozeanforschung Kiel, Wischhofstr. 1–3, 24148 Kiel, Germany Correspondence to:Mao-Chang Liang (mcl@rcec.sinica.edu.tw)
Received: 12 February 2016 – Published in Biogeosciences Discuss.: 17 February 2016 Revised: 23 August 2016 – Accepted: 14 October 2016 – Published: 22 December 2016
Abstract.Lakes and reservoirs play an important role in the carbon cycle, and therefore monitoring their metabolic rates is essential. The triple oxygen-isotope anomaly of dissolved O2[171=ln(1+δ17O)−0.518×ln(1+δ18O)] offers a new, in situ, perspective on primary production, yet little is known about171from freshwater systems. We investigated the171 together with the oxygen : argon ratio [1(O2/Ar)] in the subtropical Feitsui Reservoir in Taiwan from June 2014 to July 2015. Here, we present the seasonal variations in171, GP (gross production), NP (net production) and the NP/GP (net to gross ratio) in association with environmental parame- ters. The171varied with depth and season, with values rang- ing between 26 and 205 per meg. The GP rates were observed to be higher (702±107 mg C m−2d−1) in winter than those (303±66 mg C m−2d−1)recorded during the summer. The overall averaged GP was 220 g C m−2yr−1and NP was−3 g C m−2yr−1, implying the reservoir was net heterotrophic on an annual basis. This is due to negative NP rates from Oc- tober to February (−198±78 mg C m−2d−1). Comparisons between GP rates obtained from the isotope mass balance ap- proach and14C bottle incubation method (14C–GP) showed consistent values on the same order of magnitude with a GP/14C–GP ratio of 1.2±1.1. Finally we noted that, al- though typhoon occurrences were scarce, higher than aver- age 171 values and GP rates were recorded after typhoon events.
1 Introduction
It is well established that marine photosynthesis plays a crit- ical role in the global biogeochemical cycling of carbon and oxygen, which sustain the great majority of ecosystems on our planet. Recent studies show that freshwater systems constitute a significant component of these cycles and de- serve closer attention (Cole et al., 2007; Tranvik et al., 2009;
Valdespino-Castillo et al., 2013). Assessing primary pro- duction (PP) and providing accurate estimates of ecosystem metabolic rates are therefore the key to understanding each system’s fluxes and variability in biogeochemical cycling.
Traditionally, PP has been evaluated by in vitro14C bottle incubation method introduced by Steeman-Nielsen (1952).
However, these measurements are associated with a num- ber of biases and the interpretation of the PP estimates is problematic. The main drawback is the in vitro methodol- ogy, which involves the removal of plankton communities from the natural environment and confining them in a small volume of water, with variability in PP observed under lab- oratory conditions. Because the distribution of plankton is heterogeneous in time and space, these experiments can only provide local and instantaneous PP rates, which do not re- flect the time-averaged mean PP. The PP rates observed in vitro therefore cannot be fully representative of natural PP rates (e.g. Harrison and Harris, 1986; Marra, 2002).
Over a decade and half ago, Luz et al. (1999) and Luz and Barkan (2000) introduced the triple oxygen-isotope tech-
nique or the17O excess (171), which allows us to assess PP in situ. The excess is defined as
171=ln(1+δ17O)−λ×ln(1+δ18O), (1) where the isotopic compositions δ17O and δ18O represent the deviation of the abundance ratio of an isotopic and normal species in a sample relative to that of a standard:
δ∗O=([∗O]/[16O])sample/([∗O]/[16O])standard−1], where
∗O is either 17O or 18O. Here, δ17O and δ18O are ex- pressed with respect to atmospheric air O2. Following Luz and Barkan (2005), the factor λ is taken to be 0.518. The basic premise of this method lies in the processes fraction- ating O2 isotopologues. While photochemical reactions in the stratosphere (the coupled chemistry between O2, O3, and CO2)give rise to a non-mass-dependent signal in the atmo- spheric O2(Thiemens et al. 1995a, b), respiration and pho- tosynthesis fractionate O2in a mass-dependent way (the17O enrichment is approximately half of the18O relative to16O), which in a marine or aquatic system allows for distinguishing the O2produced biologically from air O2entraining during gas exchange. Respiration modifies the dissolved O2concen- trations in water but does not affect the171, because the rela- tive proportions ofδ17O andδ18O remain the same. The res- piratory effect on dissolved O2 saturation can be evaluated using oxygen/argon ratios, considering the biological oxy- gen supersaturation expressed as1(O2/Ar) (defined below in Eq. 4). This is because O2and Ar have similar physical properties, but the latter does not have biological sources and sinks. Although the PP evaluation based on the co-variation of both theδ17O and theδ18O values provides a more accu- rate assessment (Prokopenko et al., 2011; Kaiser, 2011), the concept of 171 remains a valuable tool for tracing biolog- ically produced O2 and resolving the associated dynamics in the ocean. Until now this joint geochemical budget ap- proach (171 or δ17O and δ18O, together with 1(O2/Ar)) has been applied widely to study marine production in the Atlantic (Luz and Barkan, 2009; Quay et al., 2012), Pacific (Hendricks et al., 2005; Sarma et al., 2005, 2006, 2008; Quay et al., 2010; Stanley et al., 2010; Juranek and Quay, 2010;
Juranek et al., 2012; Munro et al., 2013), and the Southern (Reuer et al., 2007; Hamme et al., 2012; Huang et al., 2012;
Castro-Morales et al., 2013) oceans, yet other oceanic basins and freshwater systems in general, with the exception of a case study in Lake Kinneret (Luz and Barkan, 2000), remain largely unstudied.
In this study, we extend the applicability of the 171 method into an aquatic system. We use the 171method to trace the photosynthetic O2 fate and to investigate the sea- sonal changes in PP in a semi-closed subtropical reservoir in Taiwan over a period of 1 year. We demonstrate that this ap- proach offers new perspectives on PP in lakes. In an effort to contribute to the understanding of production rates mea- sured in situ using the171method and the in vitro estimates from the14C bottle incubation approach, and to expand this to freshwater systems, we provide comparisons between the
respective rates. Additionaly, we show data on the isotopic composition (δ18O,δD, and171)of water from the reservoir.
Understanding the isotopic composition of the Feitsui Reser- voir water is crucial for accurate assessments of production rates using the171method and also offers insights into the biogeochemical/hydrological cycling of the reservoir. Ulti- mately, this paper presents a contribution to the studies on Feitsui Reservoir, a socioeconomically and ecologically im- portant reservoir.
2 Methods
2.1 Site description
The subtropical Feitsui Reservoir, located in northern Tai- wan, is the country’s second largest reservoir by volume (first is Tsengwen Dam in the south), serving as the main wa- ter source for over 5 million people in the Taipei metropoli- tan area. The domestic demand is supplied by water releases from the Feitsui Reservoir and unregulated flow from Nan- shin Creek downstream of the watershed. The upstream wa- tershed encompasses the Beishi stream basin a branch of Xindian River, one of the three major tributaries of Tamsui River. The total catchment area of the reservoir is 303 km2 and storage volume at normal maximum water level is 406 million m3. The mean depth of the watershed is 40 m with maximum depth of 113 m near the dam site. The mean daily inflow to Feitsui Reservoir is ∼30 m3s−1 and the amount of water released depends on the reservoir’s stor- age capacity and whether flow from Nanshin Creek is suf- ficient to supply domestic demand (Shiau and Wu, 2010).
In the past the reservoir was found to alternate between mesotrophic and oligotrophic states (Kuo et al., 2003), al- though more recent studies (Kuo et al., 2006) observed a trend towards eutrophication. In 2012 the reservoir was in a mesotrophic state according to Carlson’s Trophic State In- dex (CTSI). In order to prevent deterioration of water qual- ity, the watershed is protected by the Feitsui Reservoir Ad- ministration with restricted access to the water as well as adjacent areas and any commercial and recreational activi- ties are prohibited. In addition, since January 1988 the Feit- sui Reservoir Administration operates a meteorological sta- tion that provided direct wind speed measurements 10 m above the water level and rainfall data used in this study.
Typhoon information was obtained from a typhoon database (http://rdc28.cwb.gov.tw/TDB/ctrl_typhoon_range_search).
2.2 Physical structure and mixing in the water column of Feitsui Reservoir
Current assessments of PP rates rely on steady-state assump- tion. Whether the approximation is valid requires careful assessment and can be verified by studying the physical structure of the water body. Feitsui Reservoir is a typical monomictic system (characteristic of subtropical lakes) that
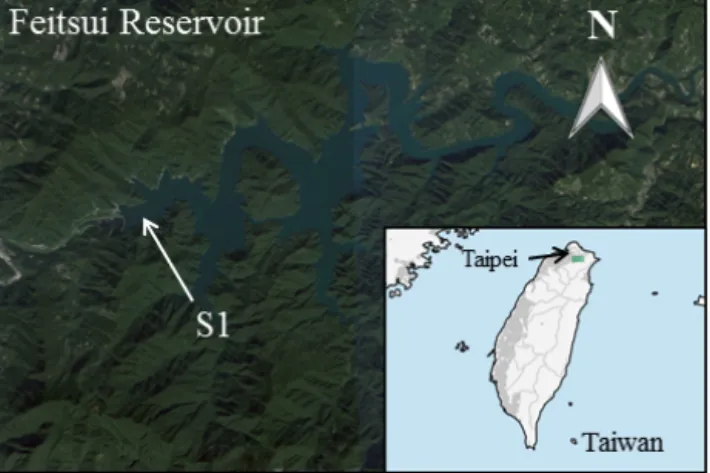
Figure 1.Location of Feitsui Reservoir in northern Taiwan. Small green rectangle indicates the enlarged satellite map of the reservoir with the position of the long-term station S1 near the dam indicated.
stays thermally stratified throughout the greater part of the year, with changing intensity of winter vertical mixing de- pending on the meteorological conditions. The topographic characteristics of the reservoir, a large water mass located in a valley, make its physical structure (i.e. water temperature) fairly simple and stable over the seasonal scale (Itoh et al., 2015). The residence time of water in the reservoir tends to be rather long; throughout our study we estimated it to be about 150 days, comparable to durations reported in the past (150 days reported by Kuo et al., 2003, and 115 days reported by Chen et al., 2006), sufficiently long to mix horizontally well. Field measurements as well as model simulation by Kuo et al. (2003) reported similar trends in dissolved oxygen concentration throughout a period of 12 months, recorded at the Dam Site (S1) and at the Wu-Tan station situated on the other side of the reservoir upstream of the Beishi Creek. A comparison between the top, middle, and bottom layers of the water column showed that the reservoir is horizontally rather uniform and is not affected significantly by horizontal water advection (Kuo et al., 2003).
2.3 Water sampling and sample preparation
Sampling was carried out at station S1 (24.9◦E, 121.566667◦N; Fig. 1) in the Feitsui Reservoir in the upper 100 m, located in the deepest region of the lake (∼113 m). Water samples were collected using 5 L GO-FLO samplers with a manual messenger. For dissolved oxygen analysis, we collected waters at 9 depths (1, 5, 10, 15, 20, 30, 50, 70, and 90 m) during 13 separate trips to the reservoir, covering 1 full year from June 2014 to July 2015. Sampling for isotope analysis of water started later in September 2014.
Vertical profiles of temperature, chlorophyll a, and dis- solved oxygen concentration were recorded routinely using Ocean Seven 316 CTD (IDRONAUT, Italy) multiparameter probe. A PAR sensor (BioTech) was used to measure photic
irradiance. The casts were typically carried out on weekly ba- sis during the summer and every 2 weeks during the winter.
The accuracy of dissolved oxygen measurements was veri- fied against in vitro measurements; water samples collected from 10 depths (0, 2, 5, 10, 15, 20, 30, 50, 70, and 90 m) were siphoned intro triplicate 60 mL bottles (Wheaton) and a colorimetric method of Pai et al. (1993) was adopted for in vitro dissolved O2determination with precision of 0.2 % r.s.d. (full scale). We used a conservative approach for de- termining the mixed-layer depth based on visual inspections of vertical temperature and dissolved oxygen profiles to en- sure the well-mixed layer only is described, without influ- ences from the thermocline. For visualization and analysis of the profile data, we used Ocean Data View (ODV; Schlitzer, 2015).
Dissolved gasses were extracted from water following Emerson et al. (1995) and Luz et al. (2002). In summary, 300 mL flasks with LouwersHapert©O-ring stopcock, con- taining 50 µL of saturated HgCl2 solution, were evacuated prior to sampling and closed with a water lock. Approxi- mately 150 mL of water sample was collected in the flask, leaving 150 mL of headspace for gases to exsolve. Once stop- cock closed, the port was filled with the same water as sam- pled and sealed with a rubber cap to avoid air contamination.
All samples were equilibrated for 24 h in a shaker at room temperature. After equilibration, water was removed from the samples and the flasks were subsequently connected to a preparation system for removal of water vapour, CO2, and other condensable molecules at liquid nitrogen temperature.
The extracted gases were then either stored in a sealed glass tube or directly introduced to a GC system (Thermo Scien- tific TRACE gas chromatograph) for complete removal of N2, after which only O2 and Ar remained the main com- ponents in the gas mixture. The separation was done us- ing a chromatographic column (3 m long, 1/8 in. SS tube, packed with molecular sieve 5A at mesh 60/100), modi- fied from Barkan and Luz (2003). During the separation the chromatographic column was kept at room temperature, and the yielded oxygen–argon mixture was absorbed onto two pellets of molecular sieve (1.6 mm, 5A, manufactured by SUPELCO) for subsequent isotopic analysis, following Abe (2008) with slight modifications.
2.4 14C bottle incubations
In summary, water samples were incubated for approxi- mately 2∼3 h and a chlorophyll-normalized photosynthesis rate versus light intensity (i.e.PBvs.I) model without the photoinhibition term, proposed by Jassby and Platt (1976), was used to calculate primary production over 24 h per- formed using an artificial light source to mimic the solar spectrum at an intensity controlled according to the solar irra- diance measured in situ. The14C rates reflect gross C produc- tion and are integrated for the entire euphotic zone. Detailed
description of methodology for14C incubation experiments is provided in Shiah et al. (1996).
2.5 Stable isotope analysis of dissolved oxygen
δ17O andδ18O in O2from the purified oxygen–argon mix- ture (as explained in Sect. 2.3) were determined by dual in- let mass spectrometry (Thermo Scientific Finnigan MAT 253 Stable Isotope Ratio Mass Spectrometer). Each sample was run for 3 acquisitions, 12 changeover cycles each, and thus the reportedδvalues represent the average of 36 cycles. The analytical errors (1−σ standard error of the mean n=36 multiplied by Student’st factor for a 95 % confidence limits, reported following Barkan and Luz, 2003) forδ17O andδ18O were 0.013 and 0.006 ‰, respectively. Our actual and long- term precision (1−σ standard deviation) established from routine measurements (n=36) of atmospheric O2forδ17O, δ18O, and171was 0.017, 0.030 ‰, and 6 per meg, respec- tively (see Supplement Table S1). Our current O2scale, re- ported in Liang and Mahata (2015), is in agreement with that of Luz and Barkan (2011).
The O2/Ar ratio was obtained by peak jumping; a sequential measurement of m/z “32” and “40” in the same collector (with the idle and integration times 20 and 4 s, respectively, following Barkan and Luz, 2003) prior to isotopic ratio analysis. The O2/Ar ratio is expressed in the standard δ notations and calculated as δO2/Ar (‰)=[(32/40)sample/(32/40)standard−1]103. The long-term precision (1−σstandard deviation) of routine measurements of atmospheric air was better than 5 ‰. For all water samples the finalδO2/Ar values were corrected for the distribution of gases between the headspace and water in the sampling flasks, following Luz et al. (2002) and normalized to air. To verify the purity of the collected oxygen–argon mixture after the GC separation, we have also included regular monitoring ofm/z“28” signal during peak jumping. We did not detect any significant presence of N2during the course of the study, either in atmospheric air or water samples for dissolved oxy- gen analysis. For all analysed samples the N2/O2signal ra- tio was lower than 0.001.
Similar to Barkan and Luz (2003) and Abe and Yoshida (2003), we found that the values of δ17O, δ18O, and 171are affected by the O2/Ar ratio, presumably due to interference with the ion source of the mass spectrom- eter. Although this effect on the δ17O and the δ18O val- ues is minor, it may significantly affect the 171. We have calculated the dependencies of the δ17O, δ18O, and 171 on the δO2/Ar, derived from measurements of aliquots of pure O2 with added different amounts of Ar and ap- plied the correction to the reported final isotopic val- ues. The regression slopes for δ17O, δ18O, and 171 were 0.00001 ‰/‰(R2=0.66),−0.00002 ‰/‰(R2=0.79), and 0.0217 per meg/‰ (R2=0.99), respectively.
To minimize the influence of Ar, and for obtaining more precise results, we used a working O2–Ar reference mixture
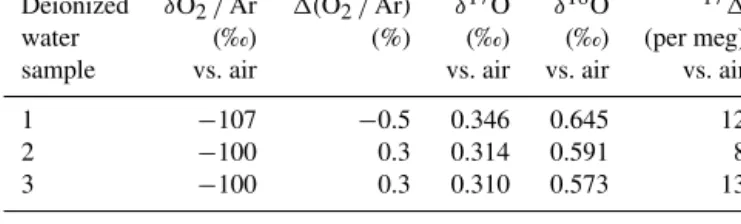
Table 1.Air–equilibrated water results.
Deionized δO2/Ar 1(O2/Ar) δ17O δ18O 171
water (‰) (%) (‰) (‰) (per meg)
sample vs. air vs. air vs. air vs. air
1 −107 −0.5 0.346 0.645 12
2 −100 0.3 0.314 0.591 8
3 −100 0.3 0.310 0.573 13
from pure gases (> 99.999 %) with the proportion of O2/Ar
∼20:1, similar to the O2–Ar solubility ratio in surface wa- ter (Benson and Krause, 1984; Krause and Benson, 1989;
Barkan and Luz, 2003). The integrity of the standard was checked regularly by measuring aliquots of atmospheric O2. For every set of samples for dissolved O2analysis from Feit- sui Reservoir (one set representing one trip to the reservoir) three aliquots of atmospheric O2 were prepared and mea- sured against the same aliquot of working reference gas mix- ture as used for the water sample set.
To evaluate the reproducibility and performance of sample preparation, we prepared air–equilibrated water. The equili- bration was achieved by continuous stirring of 8 L of deion- ized water with added HgCl2 in a circulator with tempera- ture control at 25◦C over a period of 72 h. Dissolved gases were extracted following the same procedure as applied for the reservoir samples (see Sect. 2.2). The reproducibility (1−σstandard deviation) for the analysis of equilibrated wa- ter samples (n=3) was 0.020, 0.037 ‰, and 3 per meg for δ17O,δ18O, and 171, respectively, and 4.6 ‰ forδO2/Ar (Table 1).
2.6 Stable isotope analysis of water
To identify the source of water in the reservoir, we carried out additional analyses ofδD andδ18O in the H2O molecule of reservoir water. For this, water samples were collected in 15 mL centrifuged vials and sealed with Parafilm M®to pre- vent any isotopic alteration due to evaporation. Prior to anal- ysis, water was transferred to 2 mL vials with the aid of a pipette and analysed in a Picarro L2130-I Isotopic H2O Anal- yser, following Laskar et al. (2014).δD andδ18O values are expressed with respect to VSMOW (‰). The171 was de- termined using CoF3fluorination method following Barkan and Luz (2005). Briefly, an aliquot of 5 µL of water was con- verted to O2 by injecting it to a CoF3-containing reaction tube heated at 370◦under helium flow. The evolved oxygen gas was collected in a 13X molecular sieveU-trap at liquid nitrogen temperature and then determined by dual-inlet mass spectrometry (Thermo Scientific Delta Plus). Each sample was run for 80 changeover valve cycles, i.e. 80 sample–
standard combinations. Mean standard deviations (1−σ )of multiple duplicate analyses for various waters (including VS- MOW2, GISP, and SLAP) forδ17O, δ18O, and171, were 0.086 ‰, 0.168 ‰, and 11 per meg, respectively.
2014 2015
Depth (m) Depth (m) Depth (m) Temperature (°C)Chlorophyll a (mgm-3) DO saturation (%)
M J J A S O N D J F M A M J J (a)
(b)
(c)
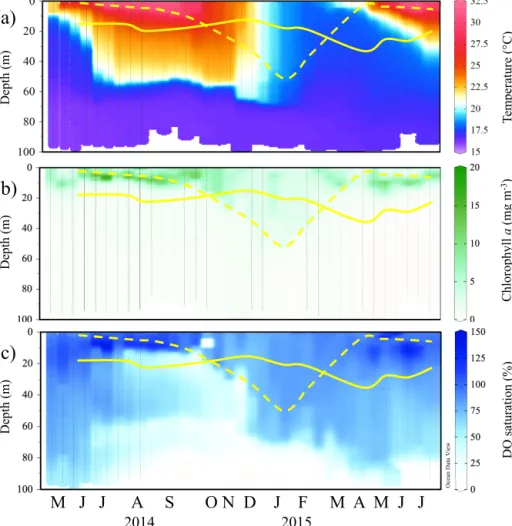
Figure 2.Seasonal variability in(a)temperature (◦C),(b)chlorophyllaconcentration (mg m−3), and(c)dissolved oxygen saturation (%) from S1 in the Feitsui Reservoir (Fig. 1). Profile data were normally collected on weekly basis throughout the warmer months and every 2 weeks in winter. Solid yellow line indicates the limit of euphotic zone and dashed yellow line the depth of mixed layer.
2.7 Gross (GP) and net production (NP) calculations
Aquatic PP, the synthesis of organic compounds from aque- ous carbon-containing species, in a steady-state system may be distinguished as GP and NP. The GP represents the to- tal carbon fixed by primary producers, and the NP represents the carbon available to the heterotrophic community. The NP is therefore the difference between GP and community res- piration and corresponds to the overall metabolic balance of an ecosystem. NP can be positive or negative. NP is positive when GP exceeds respiration and the ecosystem may export or store organic C. The value is negative when respiration exceeds GP and the ecosystem respires more organic C than was able to produce. Both GP and NP are terms of funda- mental interest in carbon cycle studies.
To quantify GP rates from171values, a simple box model may be applied; mixed-layer gross oxygen production (GOP) is assumed at steady state with respect to171and O2concen- trations, and vertical mixing is neglected, following Luz and
Barkan (2000).
GOP=KCo(171−171eq)/(171bio−171), (2) whereCo is the O2 concentration at saturation using solu- bility coefficients from Benson and Krause (1984) and K is piston velocity (the coefficient for gas exchange; Crusius and Wanninkhof, 2003; Wanninkhof et al., 2009). Here the
171eqis the air–water equilibrium, deviating from zero due to isotopic fractionation during O2 invasion and the171bio
represents the value of purely biologically produced O2. We calculatedK(the piston velocity) from daily wind speeds at Feitsui Reservoir according to Wanninkhof et al. (1987) and Vachon and Prairie (2013), based on studies of gas transfer velocities in lakes of comparable sizes to Feitsui Reservoir.
Because the gas concentrations in the mixed layer depend on the recent history of wind speeds, we averagedK over the residence time of O2in the mixed-layer preceding sampling, based on the mixed-layer depth and gas transfer coefficient.
Equation (2), however, represents a mathematical approx- imation to provide a first order realization of processes
and sources that affect the GP. This simplified formula- tion may introduce large errors, in particular in ecosystems with elevated export ratios. Prokopenko et al. (2011) and Kaiser (2011) derived an improved “dual-delta approach”, which we applied for estimating GP rates in the Feitsui Reservoir, where the GOP may be directly calculated from the measuredδ17O andδ18O values, as follows:
GOP=
KCo
1−δ
17Oeq+1 δ17O+1
−0.518 1−δ
18Oeq+1 δ18O+1
δ17Op+1
δ17O+1 −1
−0.518δ18Op+1 δ18O+1 −1
(3)
whereδ∗O is the measured value in a sample,δ∗Oeq is the air–water equilibrium, and δ∗Op represents the photosyn- thetic O2.
To estimate the net oxygen production (NOP) rates, we have used the O2/Ar measurements, following the biolog- ical O2 supersaturation concept for net photosynthetic pro- duction. Because the physical properties of O2 and Ar are similar, and Ar has no biological sources and sinks, measure- ments of Ar concentration in water may be used to remove physical contributions to O2supersaturation. The biological oxygen supersaturation1(O2/Ar) is defined as the relative deviation of the O2/Ar in a sample to the O2/Ar at equilib- rium with the atmosphere (Craig and Hayward, 1987; Spitzer and Jenkins, 1989; Emerson et al., 1995; Kaiser et al., 2005) and may be calculated as follows:
1(O2/Ar)=
"
1+(δO2/Ar)sample 1+(δO2/Ar)eq −1
#
. (4)
Assuming the mixed layer is at steady state, NOP can be cal- culated following Luz et al. (2002):
NOP =KCo1(O2/Ar). (5)
A shortcoming associated with the calculation of PP rates from dissolved O2isotopes is that the rates are in O2units, instead of C-based units, and the conversion between them is not straightforward. To convert between O2and C-based rates, we follow the common approach presented earlier (e.g.
Hendricks et al., 2014; Juranek et al., 2012). GOP from171 is greater than gross C production because it measures total oxygen produced regardless of its fate, such as the fraction of O2produced which is linked to Mehler reaction and pho- torespiration. To scale GOP to gross C production, we ac- count for this fraction following Laws et al. (2000) and apply a photosynthetic quotient (PQ) of 1.2. We convert NOP to a comparable C flux using a PQ of 1.4, for new production (Laws, 1991).
3 Results
3.1 Hydrography
We refer to our monthly sampling dates as MMMYY for con- venience. The subtropical Feitsui Reservoir was thermally stratified for the great part of the year, with a distinct seasonal thermocline (Fig. 2a). In spring, seasonal stratification devel- oped (APR15), and the lake remained well stratified with a shallow epilimnion with temperature above∼30◦C through- out the warmer months in the top 10 m layer. In summer, the reservoir was strongly stratified as the result of continued heating of the surface water and the mixed layer remained shallow, typically about 3–5 m deep, as observed in JUN14, AUG14, APR15, MAY15, and JUL15. Although the thermal structure of the reservoir controls the gas exchange during the warm months, processes such as rainfall and windstorms may entrain atmospheric air to the thermocline, as indicated from dissolved O2and1(O2/Ar) vertical profiles (Figs. 2c and 4c), playing a critical role in influencing the conditions in the mixed layer. From SEP14 and OCT14, as a result of decreasing ambient temperature and gradual cooling of sur- face water, the mixed layer deepened and reached 11 and 23 m, respectively. In DEC14 the thermal stratification be- came weaker, initiating the winter overturn and resulting in well-mixed epilimnion of∼22◦C to 34 m depth and a de- creasing temperature gradient in the metalimnion. In JAN15 the mixed layer was deepest at 51 m. The mixed layer re- mained deep throughout FEB15 (40 m) when the reservoir was coolest and nearly homothermal ∼17◦C in the epil- imnion and∼16◦C in the hypolimnion.
The chlorophylla (Chla) (Fig. 2b) in the reservoir was predominantly restricted to the epilimnion and the upper thermocline. The distribution and concentration varied with seasons and with the occurrence of stochastic events (such as storms, strong rainfall, or typhoons) that enhanced the photo- synthetic activity in the phytoplankton. Chla concentration was high from JUN14 to SEP14, with a subsurface maximum below the mixed layer at ∼10 m, averaging to 15 mg m−3 and occasionally above 20 mg m−3. In late SEP14, the Chla maximum shifted to the surface. No apparent maximum was observed in OCT14 when Chl a concentration was rather uniform throughout the mixed layer of average∼8 mg m−3 in the upper 23 m. From DEC14 to FEB15, Chlaremained low at∼3 mg m−3. In spring, Chl a concentration started to increase at the surface averaging∼5 mg m−3, followed by later appearance of a subsurface maximum at 12 m of
∼8 mg m−3. A short episodic decrease in Chlawas recorded in APR15, a likely result of cooler ambient temperature than normal and frequent precipitation. In MAY15, Chla con- centration increased again and high subsurface maximum of
> 10 mg m−3formed at 15 m.
The dissolved oxygen (DO) concentration and saturation levels (Fig. 2c) varied in association with O2–Ar ratios mea- sured, indicating the availability of dissolved O2supplied by
Depth (m) Depth (m) δ18O (‰ vs. air) δD (‰ vs. VSMOW)
2014 2015
M J J A S O N D J F M A M J J (a)
(b)
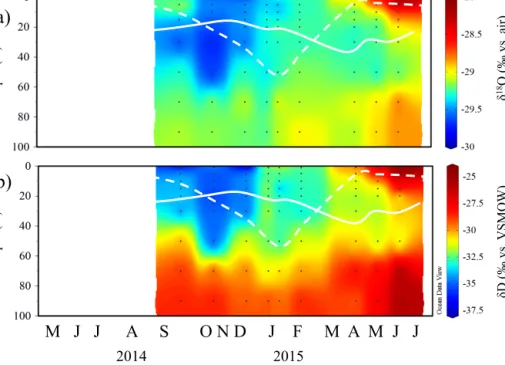
Figure 3. Seasonal variability in(a)δ18O of water O2(‰ vs. air) and(b)δD(‰ vs. VSMOW). Solid white line indicates the limit of euphotic zone and dashed white line the depth of mixed layer.
primary production, aeration, or mixing processes. The epil- imnion remained saturated throughout the year, and in the thermocline DO varied greatly; DO was undersaturated from AUG14 to DEC14 (< 50 %), reached near-saturation levels during the winter, and remained supersaturated from APR15 to JUN15 (> 100 %). In spring and summer the DO reached the hypolimnion where the saturation was typically above 50 %. Conversely, from early AUG14, throughout autumn and winter the hypolimnion was undersaturated (<50 %) with minimal DO content.
3.2 Isotopic composition of water
In addition to dissolved O2, we have measured the iso- topic composition of water in the Feitsui Reservoir through- out the different seasons. The isotopic composition of wa- ter varied in both δ18O (Fig. 3a) and δD (Fig. 3b) season- ally and vertically. Overall, the variation ofδ18O was smaller than that of δD, varying between −29.73 and −28.18 ‰ (−6.5 and−5.3 ‰ vs. VSMOW) inδ18O and between−37.1 and −25.4 ‰ in δD. The general pattern for both δD and δ18O showed more depleted values during autumn, followed by gradual enrichment throughout the winter, spring, and early summer. No statistically significant (within errors) sea- sonal variation was found in 171 values. We therefore av- eraged the 171 over the year, with the resultant 171 of 257±14 per meg, representing the171of water in the Feit- sui Reservoir. The insignificance in171seasonality is con- sistent with the small overall variation inδ18O and also with the long residence of water in the reservoir.
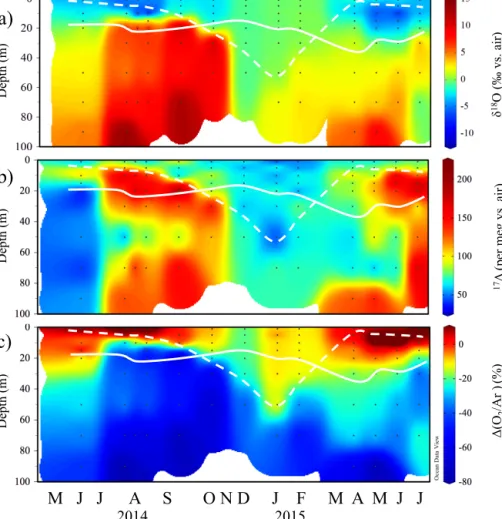
3.3 The171of dissolved O2
The171signal of dissolved O2 varied with depth and sea- sons (Fig. 4b). The overall range of the171values measured varied between the maximum of 205 per meg in late AUG14 and JUL15 and minimum of 26 per meg in JUN14. The an- nual mean171at the surface (1 m) was 65±13 per meg and remained constant throughout the year, with the exception of late SEP14 and JUL15, when the surface values were higher, recording 97 and 76 per meg, respectively, and coinciding with an episodic shift of Chlamaximum towards the surface (Fig. 2b). During months with persistent thermal stratifica- tion in the reservoir, the171followed a similar vertical pat- tern, with distinct171values. From JUN14 to early SEP14, when the mixed layer was very shallow (∼3–5 m), the171 signal accumulated below, in the upper thermocline, with a peak exceeding 150 per meg observed typically at∼10–20 m depth. Below the thermocline at ∼50 m depth in AUG14 and SEP14 the 171 was low, showing signals characteris- tic of surface water. In late SEP14 and OCT14 as the mixed layer deepened gradually, we observed a corresponding trend for the171, with the peak in the signal deepening (205 and 156 per meg at∼20 and 30 m, respectively) following the mixed-layer boundary. In DEC14 the deep mixed layer and decreasing importance of the thermal stratification facilitated increased gas exchange throughout the water column result- ing in low and rather uniform171values in the water column of 63±6 per meg. This trend continued throughout the win- ter period, during which the171values stayed comparatively low and less variable. The onset of thermal stratification dur-
17Δ (per meg vs. air) Δ(O2/Ar )(%)
2014 2015
Depth (m) Depth (m) Depth (m) δ18O (‰ vs. air)
M J J A S O N D J F M A M J J (a)
(b)
(c)
Figure 4.Seasonal variability in(a)δ18O of dissolved O2(‰ vs. air),(b)171(per meg vs. air), and(c)1(O2/Ar) (%) in Feitsui Reservoir.
Solid white line indicates the limit of euphotic zone and dashed white line shows the depth of mixed layer.
ing the spring allowed for171to increase below the mixed layer; in APR15 we observed a developing peak in the171 signal of 105 per meg at 10 m. The171increased through- out MAY15, and in JUN15 and JUL15 the accumulated171 signal at 10–30 m, reached up to 193 per meg, coinciding with the observed DO supersaturation (Fig. 2c) and elevated 1(O2/Ar) (Fig. 4c). In contrast to the trend from JUL14, in JUL15 the171signal was high below the mixed layer and throughout the whole water column. Although samples from regions below 50 and 70 m were limited due to insufficient amount of gas for isotope analysis, overall the 171 values tend to increase towards the bottom of the hypolimnion, in particular high 171 was measured at 70 m in late AUG14, SEP14, and JUL15 of 152, 157, and 174 per meg, respec- tively.
3.4 Gross and net production
Following Prokopenko et al. (2011) and Kaiser (2011), we estimated PP rates using the dual-delta approach in the Feit- sui Reservoir from JUN14 to JUL15.
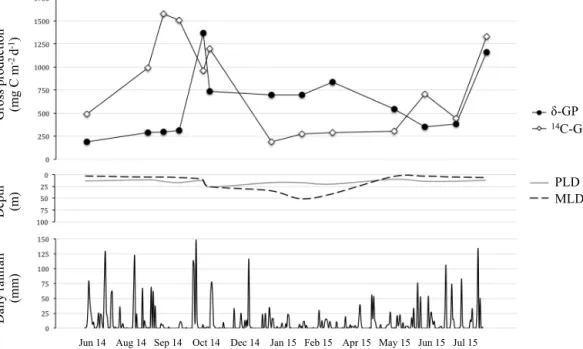
The GP rates, NP rates and the NP/GP ratio obtained by the dual-delta approach are summarized in Table 2. Overall, the GP rates varied between 187 and 1372 mg C m−2d−1. The general pattern showed higher values during the cooler months and in winter, averaging to 702±107 mg C m−2d−1 between OCT14 and APR15. This may be considered as maximum production because the mixed layer is deeper than the euphotic zone in winter. A decrease in the GP was observed in summer, averaging to 303±66 mg C m−2d−1 throughout JUN14, AUG14, MAY15 and JUN14. This rep- resents the minimum GP for this period, because the mixed layer is shallower than the euphotic zone and therefore some production also took place below the mixed layer, which may not be evaluated by the present model. Produc- tion was highest in late SEP14 and in JUL15, 1372 and 1162 mg C m−2d−1, respectively, coinciding with typhoon events affecting the area of the Feitsui Reservoir.
Overall, the NP ranged between −311 and 228 mg C m−2d−1. The NP was negative from OCT14 to FEB15, averaging−198±78 mg C m−2d−1, indicating the reservoir was net heterotrophic in the mixed layer during the winter.
sampling days.171–GP,δ–GP, NP,14C–GP and CI–GP are in mg C m−2d−1.
Date Abbrev. PLDa MLDb Co KfromU 1(O2/Ar) 117–GPc δ–GPd NP NP/ 14C–GP CI–GP
(m) (m) (mmol m−3) (m d−1) (%) δ–GP
10/06/2014 JUN14 14 3 249.01 0.21 10 120 187 44 0.24 492 –
19/08/2014 AUG14 11 5 232.20 0.27 15 190 289 80 0.28 988 293
26/08/2014 AUG14 14 5 232.20 0.30 13 193 297 78 0.26 1580 6314
02/09/2014 SEP14 17 6 232.20 0.35 13 204 313 92 0.30 1510 –
23/09/2014* SEP14 13 10 240.36 1.15 1 834 1372 28 0.02 961 –
28/10/2014 OCT14 26 25 258.23 0.56 −12 448 737 −149 −0.20 1197 −
09/12/2014 DEC14 17 34 273.24 0.64 −21 408 699 −311 −0.44 190 –
20/01/2015 JAN15 17 51 289.89 0.65 −9 397 696 −140 −0.20 275 67
10/02/2015 FEB15 20 41 295.85 0.69 −11 476 837 −194 −0.23 292 244
14/04/2015 APR15 10 4 278.59 0.48 2 333 541 21 0.04 307 135
19/05/2015 MAY15 14 3 244.62 0.40 6 223 351 49 0.14 708 628
23/06/2015 JUN15 14 5 232.20 0.36 9 247 379 66 0.17 442 376
14/07/2015* JUL15 12 6 240.36 1.00 11 758 1162 228 0.20 1328 657
aPhotic layer depth.bMixed-layer depth.cFollowing Luz and Barkan (2000).dFollowing Prokopenko et al. (2011) and Kaiser (2011).
Positive NP rates dominated in the warmer months with val- ues typically averaging 57±26 mg C m−2d−1, implying the reservoir remained net autotrophic during the greater part of the year. Highest NP rates were observed in JUL15 measur- ing 228 mg C m−2d−1. The NP/GP ratio varied between
−0.44 and 0.30.
Using the GP and NP rates measured in our study, we estimated the annual C production in the Feitsui Reservoir.
Excluding the measurements obtained during typhoons (late SEP14 and JUL15), the average annual GP amounted to 177 g C m−2yr−1 and the average annual NP was −12 g C m−2yr−1. Taking into consideration typhoon events, the average annual GP increases to 220 g C m−2yr−1, and the average annual NP to −3 g C m−2yr−1. For comparison, a model study by Lewis (2011) estimates the global average annual production per unit area for a lake 200 g C m−2yr−1 for GP and 160 g C m−2yr−1 for NP. While our GP esti- mates agree well with this projection, in particular when the production rates take into account typhoon events, our NP rates lie at the lower end of the global average. The mea- sured NP rates in the Feitsui Reservoir thus indicate that over the year the respiration exceeds gross primary production in the reservoir, affecting the net balance of carbon. Episodic events such as typhoon events seem to play a key role in the metabolism of Feitsui Reservoir, and it is plausible that dur- ing years with frequent typhoon events the annual balance of the reservoir may shift to net autotrophy. Although some carbon storage is expected in the form of accumulation of organic matter to the sediments (Dean and Gorham, 1988), our results indicate that from 2014 to 2015 the Feitsui Reser- voir acted as a positive though minor carbon source to the atmosphere.
4 Discussion
4.1 The171and1(O2/Ar) tracers for photosynthesis and respiration
The schematics of171transport and variation are summa- rized in Fig. 5. The near-surface171value represents a bal- ance between O2produced photosynthetically, which tends to increase the 171, and that from gaseous exchange with atmospheric O2, which reduces the171 value. The nearly constant surface171values measured in the Feitsui Reser- voir throughout the year (65±13 per meg) suggest that the balance of these processes does not typically vary with sea- sons. In late SEP14 and in JUL15, the surface 171values were 32 and 10 per meg higher, respectively, than the an- nual mean, indicating additional input from photosynthesis.
Further analysis showed that in both cases, the samples were taken within a few days after typhoon occurrences. Thus the resulting elevated171is likely to be a consequence of nu- trient enrichment caused by typhoons, mediating enhanced vertical mixing and hence photosynthesis (see Sect. 4.5 for further details). Previous studies showed that in the Feitsui Reservoir phosphate plays a key role as the limiting nutrient, restricting the microbial production. The key processes that determine its availability are vertical mixing from changes in the mixed-layer depth in the spring and typhoon intensity in summer and autumn (Tseng et al., 2010; Itoh et al., 2012).
These processes therefore likely play a role in the distribu- tion of the171signal in the water column as well as increase photosynthetic activity as a result of intensified production after nutrient enrichment.
High subsurface171may be primarily attributed to the de- creasing importance of gas exchange with depth. This is par- ticularly characteristic of the warmer months during which strong thermal stratification developed, confining the primary producers to the thermocline (also shown by Chla, Fig. 2b)
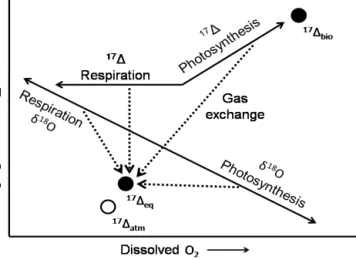
Figure 5.A schematic diagram showing the effects of photosynthe- sis, respiration, and air–water gas exchange on dissolved O2con- centrations, δ18O and171. δ18O changes with all the processes and additionally is also affected by mixing. Because of non-mass- dependent processes occurring in the stratosphere, the 171of O2 in air has a different signal to the O2produced biologically where fractionation is mass-dependent.171increases due to photosynthe- sis, decreases due to gas exchange but is not affected by respiration.
Respiration removes O2and decreases the dissolved O2concentra- tion but fractionates O2isotopes in a mass-dependent way, which does not affect the relative proportion ofδ17O andδ18O and there- fore the171.171biois the maximum value of pure biological sig- nal, which amounts to 171of water. The slope of 171increase towards171biois the kinetic slopeλfor respiration (λ=0.518).
171eqis the O2at air–water equilibrium, which has a small offset from171atm, which is by definition 0, due to fractionation at equi- librium whereδ17O andδ18O slopes during invasion and evasion follow a slightly different slope to that of respiration.
where the conditions are optimal for phytoplankton growth, representing a compromise between light, temperature, and nutrient availability. From AUG14 to OCT14 we recorded high171(often above 150 per meg) values below the ther- mocline (5–30 m). It is likely that the local primary produc- tion was initially high, a possible result of a phytoplankton bloom influencing the observed171composition. However, the measured low1(O2/Ar) values (about−30 %) and un- dersaturation of DO indicate O2consumption from AUG14 to OCT14 in the upper thermocline. In the absence of pho- tosynthesis, the residual171signal thus points towards the lack of vertical mixing in the reservoir during this period as well as no influence from atmospheric air. At 50 m depth, we recorded171values, typical of near-surface water. Here, the
171shows an inverse relationship to1(O2/Ar) as well as DO, with lower171and higher1(O2/Ar) and DO observed in AUG14 and SEP14 and increasing 171 and decreasing 1(O2/Ar) DO saturation observed in OCT14. Additionally, the signal also follows the thermal structure of the reservoir;
from July to about November 2014 we observe well-mixed
epilimnion in the upper∼10 to 20 m and an extensive met- alimnion to about 50–60 m, with strong thermal gradient be- fore reaching hypolimnion below. It is likely that the low171 origins from atmospheric air entrainment during early sum- mer (June and July, DO profile, Fig. 2c).
Intrusion of surface water below the metalimnion has been observed in previous studies and may also be supported by dust loading, which results in an increase in total suspended material at depth (Tseng et al., 2010). Strong vertical mix- ing of air–saturated water down the water column in JUN15, indicated by the low171values, increased1(O2/Ar), and DO, as a result of heavy rainfall (∼700 mm accumulated pre- cipitations during JUN14 compared to∼340 and∼200 mm measured in JUL14 and AUG14, respectively; Fig. 6) may have supplied atmospheric O2 to the metalimnion and the hypolimnion. As of early AUG14 at 50 m, the observed171 signal possibly traces the remaining171signal from JUN15, locally confined due to the strong thermal gradient and unal- tered by photosynthesis due to the lack of primary producers at this depth. The breaking down of both the high171from
∼20 to 30 m and the low171from 50 m throughout autumn is controlled by decreasing air temperatures and the conse- quent weakening thermal stratification in the reservoir, also observed in other years (Itoh et al., 2012). Apart from storms and typhoons causing wind stress at the air–water interface or heavy precipitation, lake processes such as seiches may con- tribute to vertical mixing. Seiches were never evaluated in the Feitsui Reservoir, but they may play an important role in affecting the vertical transfer of the water masses, dissolved gases, and nutrients in the Feitsui Reservoir and should be considered in future studies.
An increase in the 171 towards the bottom of the lake (90 m samples) was observed during all seasons, likely orig- inating from the transport of enhanced171values from the upper part of the water column and any photosynthetically induced changes to the signal before it reached the bottom.
These samples, however, contained only small amounts of O2(saturation less than∼50 %), and therefore it is possible that minor photosynthetic contributions could significantly increase the171 values as a result of vertical entrainment mentioned previously.
4.2 Uncertainties in PP rates
Although the improved dual-delta method presents a math- ematically more accurate approximation than the previous
171model, a number of uncertainties associated with both methods for estimating PP rates remain, which need closer attention. Luz and Barkan (2000), Prokopeno et al. (2011), and Kaiser (2011) demonstrated that GP in the mixed layer could be determined from the measurements of171or theδ values in dissolved O2using a steady-state mixed-layer oxy- gen budget model which allows for estimation of integrated gross productivity in the mixed layer over the residence time of mixed-layer O2. It is important to note that this approach
δ-GP
14C-GP
PLD MLD
Daily rainfall (mm) Depth (m) Gross production (mg C m-2 d-1)
Jun 14 Aug 14 Sep 14 Oct 14 Dec 14 Jan 15 Feb 15 Apr 15 May 15 Jun 15 Jul 15
Figure 6.Comparison between dual-delta (δ-GP) estimates and14C–GP rates (mg C m−2d−1). PLD and MLD indicate photic layer depth and mixed-layer depth, respectively, and precipitation shows the total daily rainfall (mm).
Jun 14 Aug 14 Sep 14 Oct 14 Dec 14 Jan 15 Feb 15 Apr 15 May 15 Jun 15 Jul 15
17Δ-GP / CI-GP
0.0 1.0 2.0 3.0 4.0 5.0 6.0 7.0
5 7 9 11 13 15 17 19
Figure 7.The relative difference between production rates obtained from mixed-layer model (171–GP, following Luz and Barkan, 2000) and our whole column inventory approach (CI–GP).
may underestimate GP on occasions when the euphotic zone is deeper than the mixed layer since the calculation accounts for GP in the mixed layer only. This may particularly af- fect PP estimates during summer months, when the photic layer is typically deeper than the mixed layer in subtropical reservoirs in general, and about 4 times deeper in the Feitsui Reservoir. Furthermore, this model lacks terms for advection and vertical mixing. While the effect of these simplifications may be negligible in the open ocean (Emerson et al., 1997), lakes and reservoirs often feature a complex vertical and hor- izontal structure, the effect of which needs to be considered.
Fortunately, given the rather simple physical structure of the Feitsui Reservoir (see Sect. 2.2), horizontal inhomogeneities may be neglected. The column inventory approach presented
below (Sect. 4.3) provides a robust technique for assessing the contributions of vertical mixing and to estimate the pro- duction below the mixed layer.
The key parameter to constrain the GP and NP rates is the gas exchange rate between the mixed layer and the at- mosphere. Presently this is best achieved by parameteriza- tion of wind speeds, which is commonly used in models with several empirical relationships between the wind speed and gas exchange rate (e.g. Clark et al., 1995; Ho et al., 2006;
Wanninkhof et al., 2009). However, parameterization of wind speeds does not come without inaccuracies. In most of the oceanic studies, the error associated with the parameteriza- tion is attributed to the accuracy of wind speed measurements and the relationship between the wind speed and gas ex- change rate at very high or low wind speed conditions (Wan- ninkhof, 1992). In freshwater systems, factors such as lake size and ecosystem heterogeneity present another important factor (Vachon and Prairie, 2013) and should be taken into consideration when choosing an appropriate parameteriza- tion.
Apart from δ values measured in samples, δ∗Oeq and δ∗Opor171eqand171bioare important constituents of this method.δ∗Oeq or 171eq is rather well established and can be determined experimentally by air–water equilibrations, usually achieved by bubbling or stirring (Keedakkadan et al., 2015). Theδ∗Opor171biorepresents the photosynthetic O2composition, with controversy on these values discussed in the literature (e.g. Kaiser 2011; Luz and Barkan, 2011;
Nicholson, 2011). The major problem lies in proper quantifi- cation of the value for171bio. Being closely dependent on
the 171of substrate water and less straightforward to mea- sure, the 171bio value was previously often assumed to be the same as that of water. Recently, Luz and Barkan (2011) showed that a small difference exists between the substrate water values and the average composition of photosynthetic O2produced by phytoplankton. This potential bias has to be considered in order to improve the accuracy of primary pro- duction estimates. Furthermore, whereas a uniform value for
171of seawater may be applied to study PP in the ocean,
171 for a freshwater system of interest has to be deter- mined because the isotopic composition of freshwater tends to vary geographically and among different water sources (Luz and Barkan, 2010). For Feitsui Reservoir we deter- mined 257±14 per meg for 171 of water based on mea- surements of water samples collected throughout the year.
The difference between the isotopic composition of Feitsui Reservoir water and that of photosynthetic O2 provided by Luz and Barkan (2011) therefore reflects the associated frac- tionation between the substrate water and the photosynthetic O2. To obtain the representativeδ∗Opand171biovalues for the Feitsui Reservoir, we consider these additional fraction- ations of 26 per meg and 3.306 ‰ for171bioandδ18O, re- spectively, to our measured values of water and retrospec- tively calculate the δ17OP. The resulting annual mean val- ues forδ17OP,δ18OP and171biowere−13.156±0.192 ‰,
−25.975±0.370 ‰, and 283±9 per meg, respectively.
Compared to the GP, estimating the NP is less compli- cated, since the model only requires the coefficient for gas exchange and a term describing the biological supersatura- tion. The second term can be constrained by the1(O2/Ar) based on measurements from flask samples or determined in situ using a sensor for dissolved O2supersaturation, although the accuracy of the latter is inferior and may be less suitable for this purpose. Combining 171and1(O2/Ar) measure- ments we can get the NP/GP ratio, which is equivalent to an export ratio (Laws et al., 2000) describing the capacity of an ecosystem to export C. The NP/GP ratio can be far better constrained than the GP on its own, since it is inde- pendent of the gas exchange rate and the uncertainty in the ratio only depends on the error in the measurement of 171 and1(O2/Ar).
4.3 Column inventory approach
As discussed previously (Sect. 4.1), in case of fast chang- ing physical dynamics in a reservoir, a mixed-layer budget by isotope mass balance calculation may not be applicable for the assessment of PP rates. To assess the relevance of this method for the Feitsui Reservoir, we tested an alterna- tive mass balance model based on a whole column inventory approach (onwards referred to as column inventory approach or CI-GP). Unlike isotope mass balance limited to the mixed layer, the column inventory model requires time-series data of full profiles from the surface to the bottom of the lake, and
it is able to obtain the GP rates below the mixed layer without steady-state assumptions.
Calculating the GP by the column inventory model is done by solving the following simultaneous equations:
16Ot−16Ot−1=16P−16C+16I−16E, (6)
17Ot−17Ot−1=17P−17C+17I−17E, (7)
18Ot−18Ot−1=18P−18C+18I,−18E (8) wherenOt andnOt−1are the total amount of oxygen isotope nin the water column from the surface to the bottom of lake at the time slicetandt−1 (a step before timet), respectively;
nP,nC,nI, andnE are GP, consumption rate for entire water column, influx from the atmosphere, and efflux to the atmo- sphere, respectively, for oxygen isotopen. Equation (6) can be substituted by column inventory or rates of total dissolved oxygen in Eq. (9).
Ot−Ot−1=P−C+I−E (9)
Equations (7) and (8) can be obtained by multiplying iso- topic composition (1+δnO) and/or isotope fractionation fac- tor (1+nε)in Eq. (9).
While a non-steady-state model is beyond the scope of this paper, the column inventory approach enables us to introduce dynamics into the calculations of GP and evaluate the feasi- bility of the mixed-layer approach for estimating PP rates in the Feitsui Reservoir. Because the purpose of this model is to compare two different approaches rather than produce accu- rate estimates, and for simplicity, we calculated the mixed- layer approach GP rates using Eq. (2) and present the171- GP/CI–GP ratio (Fig. 7). Overall, the GP rates obtained from171-GP and CI–GP model showed a good agreement with each other, indicating the calculation of GP rates using a mixed-layer model may be valid for the Feitsui Reservoir, not only for open oceans. A better fit between the respective rates may be obtained using lambda slope 0.520, although the reasons for this remain presently unclear. Further adjust- ments of171eqand171biocould also improve the fit.
4.4 Comparisons between dual-delta GP and14C–GP rates
While both methods aim to evaluate the natural GP rates, direct comparisons between estimates from the dual-delta method and from the14C bottle incubation are impractical because of the principal differences in the methodologies (in situ vs. in vitro). Each method provides rates integrated over different spatial and temporal scales, and clearly method- ological biases are associated with each. A number of studies have addressed the dual-delta GP/14C–GP in the ocean, but the ratios were found to vary significantly from 2.2 (Quay et al., 2010) to 8.2±4.0 (Stanley et al., 2010; see also Juranek and Quay, 2013, for an extensive review). The variability in the ratios remains a conundrum. Overall, the dual-delta GP