Elsevier Editorial System(tm) for Economics Letters Manuscript Draft
Manuscript Number:
Title: On the Different Approaches of Measuring Uncertainty Shocks Article Type: Original Article
Keywords: Uncertainty Shocks; Sectoral Impact; GARCH-in-mean; Profit Growth.
Corresponding Author: Mr. Johannes Strobel, M.A.
Corresponding Author's Institution: University of Regensburg First Author: Johannes Strobel, M.A.
Order of Authors: Johannes Strobel, M.A.
Abstract: As uncertainty has become an increasingly prominent source of business cycle fluctuations, various uncertainty proxies have been proposed in the literature. This paper shows that uncertainty measures based on realized variables fluctuate more than the measures that are based on forecasts.
More precisely, the variation in the realized cross-sectional standard deviation of profit growth and stock returns is larger than the variation in the forecast standard deviation. Moreover, the forecast standard deviation of profit growth and stock returns are negatively or uncorrelated, the uncertainty measures increase stock returns due to a risk premium, but they decrease profit growth.
Suggested Reviewers: Kevin D. Salyer PhD
Professor , Economics, University of California, Davis kdsalyer@ucdavis.edu
Prof. Salyer is a proficient economist and highly familiar with uncertainty and its impact on the macroeconomy.
Victor Dorofeenko PhD
Researcher, Economics, Institut fuer Hoehere Studien dorofeen@ihs.ac.at
Mr. Dorofeenko is highly familiar with uncertainty and its impact on the economy with respect to both theoretical and empirical models.
Harris Dellas PhD
Professor, Economics, University of Bern harris.dellas@vwi.unibe.ch
Prof. Dellas is a very proficient economist, familiar with the latest research of uncertainty and its impact on the economy.
On the Different Approaches of Measuring Uncertainty Shocks
Johannes Strobel, University of Regensburg∗
April 16, 2015
Abstract
As uncertainty has become an increasingly prominent source of business cycle fluctuations, various uncertainty proxies have been proposed in the liter- ature. This paper shows that uncertainty measures based on realized variables fluctuate more than the measures that are based on forecasts. More precisely, the variation in the realized cross-sectional standard deviation of profit growth and stock returns is larger than the variation in the forecast standard deviation.
Moreover, the forecast standard deviation of profit growth and stock returns are negatively or uncorrelated, the uncertainty measures increase stock returns due to a risk premium, but they decrease profit growth.
Keywords: Uncertainty Shocks; Sectoral Impact; GARCH-in-mean; Profit Growth.
JEL Codes: E3.
Contact Information: University of Regensburg, Universitaetsstr. 31, 93040 Regensburg. Phone +49 941 943 5063, johannes.strobel@ur.de
∗I thank the seminar participants at the University of Regensburg and the Bavarian Graduate Program in Economics and Gabriel Lee. I gratefully acknowledge financial support from the German Research Foundation ((DFG) LE 1545/1-1).
Title Page
1 Introduction
Uncertainty has become increasingly prominent as a source of business cycle fluc- tuations. Since there is no objective measure of uncertainty, various uncertainty proxies have been proposed in the literature, with “uncertainty” often formalized as time-varying second moment.1 Bloom, Floetotto, Jaimovich, Saporta-Eksten, and Terry (2012), for instance, use uncertainty proxies derived from both realized and forecast real variables to calibrate their model, while Bloom (2009) uses a measure of forecast stock market volatility. Chugh (2012) and Dorofeenko, Lee, and Salyer (2014), in turn, derive uncertainty on a sectoral level based on realized real data.
This paper shows that ex ante, the standard deviation of profit growth and stock returns in the U.S. economy, in the manufacturing sector and in the services sector fluctuates less than ex post by comparing the conditional standard deviation forecast to the realized cross-sectional standard deviation and to the interquartile range (IQR). This finding corroborates the argument of Leahy and Whited (1996, p. 68), that “since uncertainty relates to expectations and not to actual outcomes, it would be incorrect to use the ex post volatility of asset returns as a measure of the variability of the firm’s environment. We therefore need an ex ante measure”.
Moreover, my results also show that the forecast standard deviation of profit growth and stock returns are negatively or at times uncorrelated.
I use a Generalized Autoregressive Conditional Heteroskedasticity-in-mean (GARCH- M) model to forecast the conditional standard deviation of profit growth and stock returns in the manufacturing sector, the services sector and the U.S. economy. The results of the GARCH-M estimation also show that a higher conditional standard deviation increases stock returns due to a higher risk premium and decreases average profit growth.
2 Data
For the following analysis, two data sets used in Bloom (2009) are considered.2 The first data set contains observations on pre-tax profits, sales and industry for a total of 347 firms, 242 of which are in manufacturing and 23 are in the services sector
1A comprehensive survey of the literature can be found in Bloom (2014).
2A detailed description is included in the Appendix.
1
*Manuscript
Click here to view linked References
in the United States from 1964Q4 to 2005Q1. The growth rate of quarterly profits
∆Πt, normalized by salesSt, is calculated as ∆ ˜Πt= 1/2(SΠt−Πt−4
t+St−4).3 The second data set contains information on firm-level stock returns for firms in the United States included in the Center for Research in Securities Prices (CRSP) stock-returns file with 500 or more monthly observations.4 The analysis focuses on the manufacturing sector, the services sector and the whole economy. In the absence of selection bias, mean, and standard deviation can be interpreted as return and risk per month from investing in a representative firm in of the sectors or the economy.5 As the data are constructed to reflect an average firm’s mean and standard deviation of stock returns and profit growth, the conditional variance reflects uncertainty and innovations to the conditional variance mirror uncertainty shocks in a sector. Using a GARCH- M model, I can predict the conditional standard deviation of stock returns and profit growth of an average firm, test whether uncertainty shocks have an effect on profit growth or stock returns and compare them to the realized cross-sectional standard deviation. Due to its theoretical correspondence, the conditional variance of productivity growth complements the uncertainty proxies.6
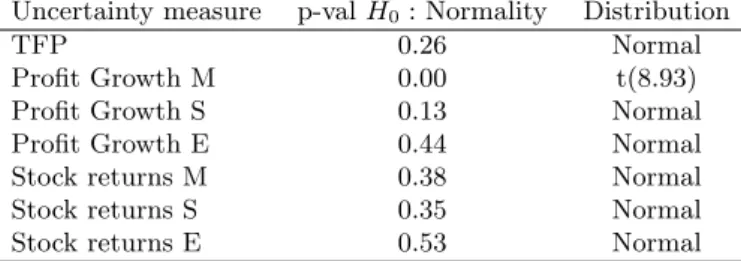
The mean equation of the GARCH-M model is formulated as xt = µ+θσ2t + ut, ut|It−1 ∼ N(0, σt2), while the conditional variance σt2 is assumed to follow a GARCH(1,1) process with one-step-ahead predictions given byσ2t+1|t=ω+αu2t+βσ2t (Engle, Lilien, & Robins, 1987). xt corresponds to stock returns, profit growth or TFP growth,µis the mean,σt2 is the conditional variance andutis an uncorrelated but serially dependent error. Normality ofutis a starting point and will be tested for.
The one-period forecast ofσ2t, based on TFP growth data is this paper’sBenchmark uncertainty estimation. The usefulness ofσt+1|tas benchmark is due to four reasons.
First, uncertainty shocks are identified as innovations to the conditional one period forecast of the variance. Second, heteroskedasticity is modeled conditional on past information. Third, the GARCH-M approach allows for the conditional variance to affect profit growth, stock returns or TFP and fourth, out of sample forecasts can be done easily.7
3Profit growth is calculated year-on-year to account for seasonality.
4More precisely, it contains data on 361 firms, 208 of which are in manufacturing and 10 are in the services sector, ranging from 1962M8 to 2006M12.
5Selection bias might be an issue, as only firms with 500 or more monthly data are included in the analysis. However, the bias is downward, potentially understating the impact of uncertainty.
6Quarterly data on TFP growth from Basu, Fernald, and Kimball (2006) from 1950Q1 to 2013Q4.
7Test results for the presence of ARCH effects using Engle’s Lagrange multiplier (LM) test are reported in the appendix.
3 Results
Table 1 reports the distribution of ut and parameter estimation results. The effect of the conditional variance on profit growth or stock return depends on the sector. A
Profit growth Stock returns TFP Growth
Manufacturing Services Economy Manufacturing Services Economy
Distribution t(8.93) Normal Normal Normal Normal Normal Normal
µ .017*** .014*** .013*** .004 .004 .003 .006
θ -16.48*** -.906 -10.156 4.491 3.026* 5.806 6.053
α .470*** .389** .411** 0.788*** .070** .079** .065
β .477*** -.599*** .405 .880*** .907*** .872*** .883***
ω .000 .000 .000 .000 .000 .000 .000
Table 1: Parameter estimates of the GARCH-M model based on mean profit growth (1964Q4 - 2005Q1), mean stock return (1962M8 - 2006M12) and TFP growth (1950Q1 - 2013Q4) in the manufacturing sector, in the services sector, in the U.S. economy. The distribution for the maximum likelihood estimation is chosen based on the Kolmogorov-Smirnoff test. Test results are reported in table 5 in the Appendix. Asterisks indicate significance at the 1%, 5% and 10% level based on Bollerslev-Wooldridge robust standard errors. Source: Compustat Database, CRSP, Federal Reserve Bank of San Francisco.
hypothetical increase of 50% in the variance across time decreases expected quarterly profit by 29% in the manufacturing sector and by 8% in the services sector, although only the former result is significant.8
The risk premia of 1.20% in the services sector, 1.03% in the manufacturing sector and 1.07% in the whole economy seem rather low and might be driven by aggregation and a downward bias, given a p-value of 9.6% in the services sector, 18.6% in the manufacturing sector and 10.8% in the U.S. economy.9
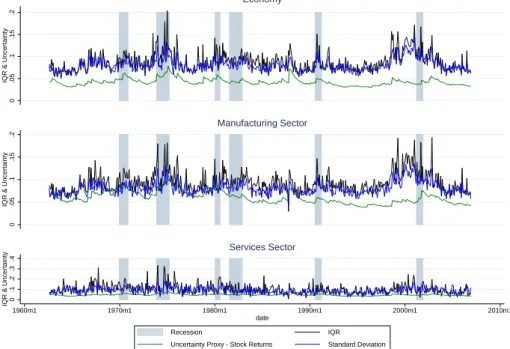
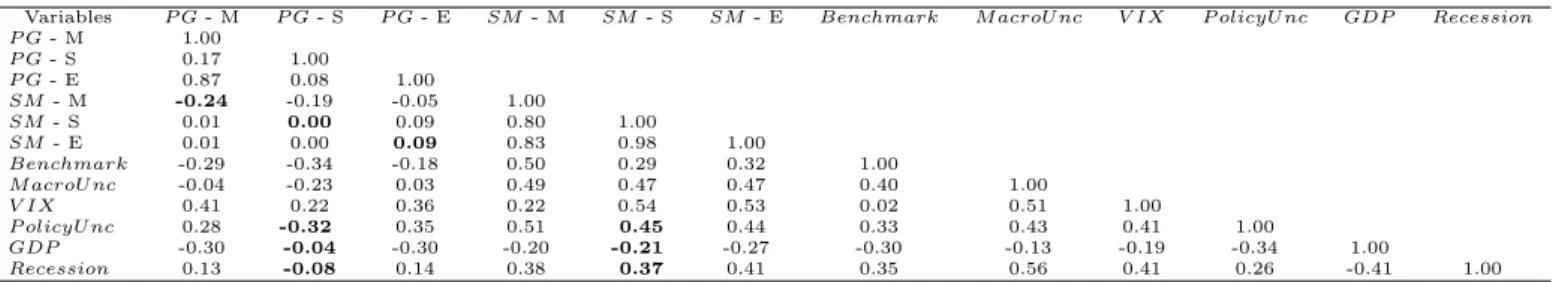
Figure 1 shows IQR, realized and forecast standard deviation per period, esti- mated as explained above using data on profit growth. Forecast fluctuations are lower than the realized ones in the whole economy, as well as in both sectors. In the manufacturing sector, uncertainty increases after recessions, while this is not as clear for the IQR and standard deviation. In the services sector, the fluctuations do not seem to be associated with the occurrence of recessions. A similar pattern is observable for the IQR and standard deviation.10 Figure 2 shows somewhat similar results for stock returns. As can be seen in Figures 1 and 2, IQR and realized stan- dard deviation fluctuate much more than their predicted counterpart which suggests
8The change in expected quarterly profit growth in the manufacturing sector is calculated as [(.0182247+1.5*.0003164 *(-20.9759))/(.0182247+.0003164 *(-20.9759))]-1=-0.2863 and analo- gously in the services sector.
9The risk premium is calculated as e.g. 3.026∗σ¯2t = 1.20% in the services sector.
10Table 4 displays the summary statistics of the time-series, and it can be seen that, on average, the expected conditional standard deviation fluctuates less than the realized standard deviation.
3
0.1.2.3 Standard Deviation
0.1.2.3IQR & Uncertainty
Economy
0.2.4 Standard Deviation
0.1.2.3IQR & Uncertainty
Manufacturing Sector
0.2.4.6.8 Standard Deviation
0.1IQR & Uncertainty
1965q1 1970q1 1975q1 1980q1 1985q1 1990q1 1995q1 2000q1 2005q1
date
Recession IQR
Uncertainty Proxy - Profit Growth Standard Deviation
Services Sector
Figure 1: IQR, standard deviation and uncertainty proxy for the manufacturing sector, the services sector and the U.S. economy based on normalized profit growth from 1964Q4 to 2005Q1. Source:
Federal Reserve Economic Data (FRED), Compustat Database.
0.05.1.15.2IQR & Uncertainty
Economy
0.05.1.15.2IQR & Uncertainty
Manufacturing Sector
0.1.2.3.4IQR & Uncertainty
1960m1 1970m1 1980m1 1990m1 2000m1 2010m1
date
Recession IQR
Uncertainty Proxy - Stock Returns Standard Deviation
Services Sector
Figure 2: IQR, standard deviation and uncertainty proxy for the manufacturing sector, the services sector and the U.S. economy based on stock returns from 1962M8 to 2006M12. Source: FRED, CRSP.
that realizations of profit growth or stock returns further away from the mean occur more frequently than expected.
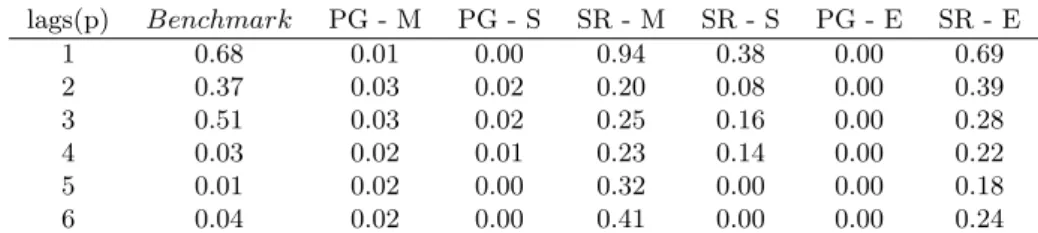
To compare these uncertainty proxies to more prominent ones, table 2 shows the pairwise correlation coefficients of M acroU ncertainty of Jurado et al. (2013), the V IX used in Bloom (2009), P olicyU ncertainty constructed by Baker, Bloom, and Davis (2012), this paper’s forecast-based proxies including theBenchmark, the cyclical component of HP-filtered real GDP and a recession indicator. Interestingly, the correlation of the conditional standard deviation forecast for profit growth and stock returns are very low or even negative. Moreover, the correlation coefficients of the volatility of stock returns and profit growth are quite different from each other.
Variables P G- M P G- S P G- E SM- M SM- S SM- E Benchmark M acroU nc V IX P olicyU nc GDP Recession P G- M 1.00
P G- S 0.17 1.00
P G- E 0.87 0.08 1.00
SM- M -0.24 -0.19 -0.05 1.00
SM- S 0.01 0.00 0.09 0.80 1.00
SM- E 0.01 0.00 0.09 0.83 0.98 1.00
Benchmark -0.29 -0.34 -0.18 0.50 0.29 0.32 1.00
M acroU nc -0.04 -0.23 0.03 0.49 0.47 0.47 0.40 1.00
V IX 0.41 0.22 0.36 0.22 0.54 0.53 0.02 0.51 1.00
P olicyU nc 0.28 -0.32 0.35 0.51 0.45 0.44 0.33 0.43 0.41 1.00
GDP -0.30 -0.04 -0.30 -0.20 -0.21 -0.27 -0.30 -0.13 -0.19 -0.34 1.00
Recession 0.13 -0.08 0.14 0.38 0.37 0.41 0.35 0.56 0.41 0.26 -0.41 1.00
Table 2: Correlation coefficients of the uncertainty proxies of Jurado et al. (2013), Bloom (2009), this paper’s forecast proxies, the cyclical component of HP-filtered GDP and a recession indicator.
PG corresponds to the uncertainty proxy based on profit growth, SM to the uncertainty proxy based on stock market returns; M refers to the manufacturing sector, S to the services sector and E to the whole economy. Source: Jurado et al. (2013), Bloom (2009), FRED.
4 Conclusion
This paper presents empirical evidence that ex post, profit growth and stock returns fluctuate more than ex ante. Moreover, fluctuations differ across sectors and depend on whether financial or real variables are used to calculate uncertainty. It is impor- tant to calibrate theoretical models accordingly, so as not to overstate the role of uncertainty. Uncertainty shocks decrease profit growth and increase stock returns.
Variation in the forecast standard deviation of profit growth is not or negatively correlated with the forecast standard deviation in stock returns.
5
References
Baker, S. R., Bloom, N., & Davis, S. J. (2012). Measuring economic policy uncer- tainty. policyuncertainy. com.
Basu, S., Fernald, J., & Kimball, M. (2006). Are technology improvements contrac- tionary? American Economic Review,96(5), 85-106.
Bloom, N. (2009, 05). The impact of uncertainty shocks. Econometrica, 77(3), 623-685.
Bloom, N. (2014). Fluctuations in uncertainty. Journal of Economic Perspectives, 28(2), 153-76. doi: 10.1257/jep.28.2.153
Bloom, N., Floetotto, M., Jaimovich, N., Saporta-Eksten, I., & Terry, S. J. (2012, July). Really uncertain business cycles (NBER Working Papers No. 18245).
National Bureau of Economic Research, Inc.
Chugh, S. K. (2012, March). Firm risk and leverage based business cycles (Boston College Working Papers in Economics No. 844). Boston College Department of Economics.
Dorofeenko, V., Lee, G. S., & Salyer, K. D. (2014). Risk shocks and housing supply:
A quantitative analysis. Journal of Economic Dynamics and Control, 45, 194-219.
Engle, R., Lilien, D., & Robins, R. (1987, March). Estimating time varying risk premia in the term structure: The arch-m model. Econometrica,55(2), 391- 407.
Leahy, J. V., & Whited, T. M. (1996). The effect of uncertainty on investment:
Some stylized facts. Journal of Money, Credit and Banking,28, 64-83.
A Appendix
Compustat and CRSP data were downloaded from, http://www.stanford.edu/
~nbloom/quarterly2007a.zip.
Federal Reserve Economic Data
• Real GDP - GDPC1
• NBER Recession Indicator - USREC
Jurado et al.’s Uncertainty Proxy
Downloaded from http://www.econ.nyu.edu/user/ludvigsons/jlndata.zip.
Baker, Bloom and Davis’ Uncertainty Proxy
Downloaded from http://www.policyuncertainty.com/us monthly.html.
Tables
lags(p) Benchmark PG - M PG - S SR - M SR - S PG - E SR - E
1 0.68 0.01 0.00 0.94 0.38 0.00 0.69
2 0.37 0.03 0.02 0.20 0.08 0.00 0.39
3 0.51 0.03 0.02 0.25 0.16 0.00 0.28
4 0.03 0.02 0.01 0.23 0.14 0.00 0.22
5 0.01 0.02 0.00 0.32 0.00 0.00 0.18
6 0.04 0.02 0.00 0.41 0.00 0.00 0.24
Table 3: LM test results (p-values) ARCH effects. H0: No ARCH effects. PG refers to profit growth in the respective sector, SR to stock market returns.
Variable Period Obs. Mean Std. Dev. Min Max
Benchmark 1950Q2-2013Q4 255 0.0322011 0.0046514 0.0249326 0.0445141 PG - Uncertainty - M 1965Q1-2005Q1 161 .0165385 .006576 .0098383 .0492981
PG - SD - M 1964Q4-2005Q1 162 0.1218006 0.081629 0.0338525 0.3934643 PG - IQR - M 1964Q4-2005Q1 162 0.0463093 0.0140203 0.027208 0.1056035 PG - Uncertainty- S 1965Q1-2005Q1 161 .0325351 .0123575 .0062582 .0924728
PG - SD - S 1964Q4-2005Q1 162 0.1149527 0.1034904 0.0160815 0.750572 PG - IQR - S 1964Q4-2005Q1 162 0.0534658 0.0229156 0.0144204 0.1328126 PG - Uncertainty - E 1965Q1-2005Q1 161 .016468 .0055934 .0106198 .0460832
PG - SD - E 1964Q4-2005Q1 162 .1422853 .0751701 .0371676 .3778371 PG - IQR -E 1964Q4-2005Q1 162 .044808 .0126902 .0255474 .1030053 SR - Uncertainty - M 1962M9-2006M12 532 .0599957 .0136417 .0376273 .1099285 SR - SD - M 1962M8-2006M12 533 .0794473 .0143971 .0417152 .1368466 SR - IQR - M 1962M8-2006M12 533 .0930246 .0229461 .0293718 .1932621 SR - Uncertainty - S 1962M9-2006M12 532 .0464516 .0083419 .0323597 .0787909 SR - SD - S 1962M8-2006M12 533 .0854849 .0297119 .0232313 .1796676 SR - IQR - S 1962M8-2006M12 533 .1025599 .0479853 .0066667 .3346002 SR - Uncertainty - E 1962M9-2006M12 532 .0421943 .007941 .0297886 .0785901 SR - SD - E 1962M8-2006M15 533 .079327 .0144982 .0553241 .1450797 SR - IQR - E 1962M8-2006M15 533 .0880501 .0219151 .050024 .2045099 Table 4: Summary statistics of the Uncertainty Measures. PG corresponds to profit growth in manufacturing (M), services (S), and the whole economy (E), SR to stock market returns.
7
Uncertainty measure p-valH0: Normality Distribution
TFP 0.26 Normal
Profit Growth M 0.00 t(8.93)
Profit Growth S 0.13 Normal
Profit Growth E 0.44 Normal
Stock returns M 0.38 Normal
Stock returns S 0.35 Normal
Stock returns E 0.53 Normal
Table 5: Test results - standardized residuals after GARCH-M estimation. Normality tested using the Kolmogorov-Smirnov test.