Experiment design for particle discovery
Data analysis 2021 – Group project I
Vadym Denysenko, Patrick Owen, Olaf Steinkamp April 13, 2021
1 Motivation
Your job is to design an experiment whose aim is to discover a hypothetical particle (Z’) predicted by a particle physics theory. If the particle exists, it will be produced in your experiment and be detected at a constant rate predicted by the particle theory.
In addition to the particle signature, there will be data corresponding to background events. The goal of your experiment is to statistically determine whether the signal is present.
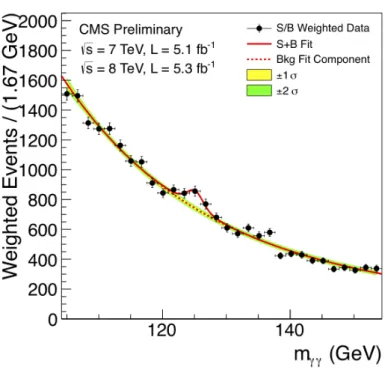
The way in which this will be done is similar to what was done for the Higgs boson discovery in 2012. In this case, the mass distribution was fitted and the statistical sig- nificance of the signal was determined using Wilk’s theorem (see lecture 14 of PHY231).
A fit to determine the existence Higgs boson is shown in Fig. 1. The idea is to compare the negative-log-likelihood (NLL) between the signal fit and the background only fit and use that to determine the significance of the signal.
The signal shape is dominated by the resolution of the detector, and will therefore follow a Gaussian PDF centered on the true mass of the particle with the width the size of the resolution. The background can be assumed to follow an exponential distribution, where the size and shape of the exponential is left to vary in the fit.
The aim of this project is to determine the parameters of a new experiment which
searches for a heavier particle than the Higgs boson, a so-called Z’ boson. The particle
will decay into an electron-positron pair in the detector from which the mass is recon-
structed. Similarly to the Higgs boson case, there will be a Gaussian signal peak on top
of a smooth exponential background.
Figure 1: Caption
2 Setup
A particle physics theory predicts the existance of a Z’ boson with a mass of 1 TeV
1. According to the theory, 50 Z’ particles will be produced each year in your experiment.
The resolution of the detector is predicted to be 0.02 TeV.
Unfortunately, there will also be accidental combinations (background) present. Accord- ing to detailed simulations, you also expect 2k background events distributed according to an exponential function between the values 0.8-1.2 TeV. The decay constant of the exponential for background is found to be λ = 2T eV
−1.
3 Experiment duration
The goal of the first part of the project is to determine how long you need to run the experiment to have a 95% chance to make a discovery (significance > 5σ). To this end:
(a) Setup a composite PDF with both signal and background components, with a fraction parameter controlling the size of the signal relative to the background.
Generate 1000 Monte Carlo datasets from this PDF assuming one year of running.
(b) Fit the Monte Carlo datasets and determine the signal fraction for each one. Cal-
1