Monograph 12 April 2004
Economic and Political Relations
Between Bhutan and Neighbouring Countries
A Joint Research Project of The Centre for Bhutan Studies (CBS) and Institute of Developing Economies, Japan
External Trade Organization (IDE/JETRO)
Contents
INTRODUCTION ...3
CHAPTER 1: OVERVIEW OF THE ECONOMY...5
1.1 N
ATURE ANDS
IZE OF THEE
CONOMY...5
1.2 B
HUTAN’
S ECONOMIC INTEGRATION AND INTERDEPENDENCE...6
1.3 M
ACROECONOMICP
ERFORMANCES ANDF
UTUREO
UTLOOK...7
CHAPTER 2. ECOMOMIC DEVELOPMENT POLICY...19
2.1 D
EVELOPMENTS
TRATEGY...19
2.2 E
CONOMICR
EFORMS ANDA
PPROACH...20
CHAPTER 3. ECONOMIC RELATIONS WITH THE NEIGHBOURING COUNTRIES AND AREAS...24
3.1 R
EGIONALE
CONOMICC
OOPERATION...24
3.2 B
HUTAN’
S ADVANTAGEOUS AREAS...31
CHAPTER 4. ECONOMIC AND POLITICAL RELATIONS BETWEEN BHUTAN AND INDIA ...37
4.1 A H
ISTORICALB
ACKGROUND ONI
NDO-B
HUTANR
ELATIONS...37
4.3 I
NDO-B
HUTANC
OOPERATION...40
CHAPTER 5. BHUTAN’S PERSPECTIVES ON REGIONAL COOPERATION ...62
5.1 B
HUTAN ANDSAARC...62
5.2 B
HUTAN’
SR
ELATIONSW
ITH ITSR
EGIONALN
EIGHBOURS...68
CONCLUSION...80
ANNEXURE 1...81
T
REATY BETWEENI
NDIA ANDB
HUTAN, 1949...82
ANNEXURE 3...85
T
HES
OUTHERNB
HUTANP
ROBLEM ANDP
EOPLE IN THER
EFUGEEC
AMPS INN
EPAL...85
ANNEXURE 4...89
A
GREEMENT BETWEEN THEG
OVERNMENT OF THEP
EOPLE'
SR
EPUBLIC OFC
HINA AND THEG
OVERNMENT OF THEK
INGDOM OFB
HUTAN ON THEM
AINTENANCE OFP
EACE ANDT
RANQUILITYA
LONG THES
INO-B
HUTANESEB
ORDERA
REAS...89
BIBLIOGRAPHY ...91
INTRODUCTION
Bhutan is a Himalayan Buddhist Kingdom that is physically small with limited economic dimensions and military might. Unlike its neighbours in the region, it was never colonized; while two world wars and the cold war ushered the world into an atmosphere of instability and alignments, Bhutan was spared such direct impact. Nevertheless, Bhutanese society has traditionally been sensitive to issues of security, and preserving its sovereign independence and territorial integrity has historically been a constant challenge.
With the launch of planned development in the 1960s, socioeconomic development and gradual political reforms have been additional and main issues of priority.
While Bhutan had historical ties with Tibet, its less definite dealings with China and the shedding of an isolationist policy gradually led Bhutan to develop political orientation towards India. Since the 1950s, Bhutan’s foreign policy focused on building a close relationship with its southern neighbour, thereby enhancing its territorial security and prospects for socioeconomic development. At the same time, the Himalayas to the Indians were natural barriers that could enhance India’s security vis-à-vis China. The first visit of India’s Prime Minister Jawahalal Nehru to Paro Bhutan in 1958 was the initiation of a
“special relationship” between the two countries. Looking back over the decades since then, it is the expansion of Indian assistance in every field of Bhutan’s development that has facilitated Bhutan’s socioeconomic growth. Among all other donors today, India continues to provide the largest economic assistance to Bhutan.
The diversification of Bhutan’s relations began with its entry into the United Nations in 1971, and while external relations continued to be largely confined to India, the establishment of its relations in other areas and at various levels gained momentum over time. This has enhanced the recognition of Bhutan as a sovereign and independent nation, and resulted in the facilitation of economic and development cooperation. As of now, Bhutan has diplomatic bilateral relations with 22 countries.
1Realizing the need for economic diversification in achieving self-sufficiency and to remove constraints inhibiting its expansion, Bhutan’s interactions at the bilateral and multilateral levels have increased substantively. Today, Bhutan not only looks toward building up a strong export-oriented economy to compete in the regional market, it also awaits accession to the WTO in the near future. Given the realities of its economy, however, Bhutan’s trade and other economic relations are confined to only a few countries in the sub-region, mainly India, Bangladesh and Nepal, and a few countries outside the sub- region. And while most analysts agree that the pattern of Bhutan’s economic growth is highly people-oriented, the pace of growth resulting in necessary diversification of domestic economy is yet to come about. However, the adoption of the unique development philosophy of Gross National Happiness has brought about a distinct position for Bhutan in the region and beyond, and it is this principle that is meant to serve as the guiding philosophy in Bhutan’s socioeconomic development initiatives.
The subsequent chapters mainly reflect on the various facets of Bhutan’s political economy in relation to neighbouring countries in the region. Chapter one provides an
1
South Asian nations, Japan, Korea, Kuwait, Bahrain, Switzerland, Denmark, Austria, Netherlands, Sweden,
Norway, Finland, Australia, Canada, Singapore, and EU.
Overview of Bhutan’s Economy discussing its size and nature, its gradual economic integration, macroeconomic performance and future outlook, as well as its growth profile over the last four decades. These elements have substantively been presented by drawing comparisons with other countries in the South Asian region.
Chapter two looks at Bhutan’s Economic Development Policy with consideration of various economic reforms that have taken place over the years including development strategy and Bhutan’s cautious move towards economic liberalization with its proposed accession to the WTO.
Bhutan’s Economic Relations with the Neighbouring Countries and Areas is explored in chapter three by looking at various levels of Bhutan’s involvement in regional integration, and its future outlook in such setting is considered by examining some of Bhutan’s advantageous areas in production and policy coordination.
The prominence of Indian involvement in Bhutan’s economic and political affairs is highlighted in chapter four, which covers Economic and Political Relations between Bhutan and India. This section shows that even within regional cooperation and amidst processes of diversification, India remains the most important development partner for Bhutan. It also covers various areas of concern with special emphasis on the issue of militant insurgents from India and their illicit penetration into Bhutanese territory.
In Chapter five, Bhutan’s Perspectives on Regional Cooperation is mainly focused on SAARC
and briefs on bilateral relations between Bhutan and the member countries (with the
exception of India since this section has been covered abundantly in chapter four). With
regard to Bhutan-Nepal relations, the main issue of concern hovering over the verification
of people in the camps in eastern Nepal has been attached in the annexes as a
backgrounder. In light of the fact that China figures considerably in Bhutan’s regional
outlook, some attention has been given to relations with this neighbour in the north.
Chapter 1: OVERVIEW OF THE ECONOMY 1.1 Nature and Size of the Economy
Bhutan is a landlocked country located between the Tibetan autonomous region of China in the north and India in the south, with formidable mountainous terrain ranging from 100 meters to 7,500 meters in height. It is a predominantly rural economy with more than 79 percent of its population living in rural areas (Planning Commission: Ninth Five Year Plan 2002-07, p.3). The population of the country is estimated at 658,000 in 2000 with as large as 39.1 percent below 15 years of age. According to the World Bank classification of countries Bhutan is a low-income country (World Development Report 2004). The adoption of the holistic philosophy of Gross National Happiness as a development tool nurtures the view that “Gross National Happiness in more important than Gross National Product”. It also reflects the symbiotic relationship that exists between people and the environment, and many other symbioses found in various facets of life in Bhutan. It stands to shed light on the religious nature of the country that has traditionally developed a culture relatively free from western influence. (Royal Government of Bhutan 2000: Development Towards Gross National Happiness, pp.15-23).
Bhutan’s economy is small by all measures and more so in comparison to the whole of South Asia, as well as most individual South Asian countries except Maldives. Table 1 suggests that the population of Bhutan is just 0.05 percent of the whole of South Asia, whereas its area is slightly higher and comes to 0.75 percent of the total. Bhutan is little more than one fourth of Nepal in area and about 2.7 percent in its population. Bhutan’s natural setting in terms of mountainous environment is better as compared to Nepal. The size of Bhtuan’s gross national income is about 0.8 per ent of the whole of South Asia and about 9 percent of Nepal. However, the per capita income of Bhutan is much higher in comparison to almost all South Asian countries, except for Sri Lanka (US $ 840 in 2002). It is perhaps due to its small population that Bhutan enjoys a per capita income that comes in more than double of Nepal and almost 23 percent more than India.
Table 1: Bhutan in South Asia, 2002: Size of the Economy Country Population
(million)
Population Density
(people per sq. km.
of land area)
Surface Area
(1000 sq.
km.)
Gross National Income (US $ billion)
Per Capita Income (US $)
Bhutan 0.658 17 38.394 0.505 590
India 1048 353 3287 501.5 480
Bangladesh 136 1042 144 48.5 360
Nepal 24 169 147 5.6 230
South Asia 1401 293 5140 640.5 460
Note: The World Bank’s reporting of South Asia figures include seven countries of the sub-region—
Afghanistan, Bangladesh, Bhutan, India, Maldives, Nepal, Pakistan and Sri Lanka.
Source: i. World Development Report 2004, World Bank; ii. Ninth Five Year Plan 2002-07, Royal Government of
Bhutan.
1.2 Bhutan’s economic integration and interdependence
During the 1990s, the economies of the sub-region underwent extensive reforms towards more permissive and open policies resulting in a quantum jump in the proportion of trade in their national incomes from 22 percent to nearly 30 percent over the 1990s (RIS 2002, p.1). Bhutan’s benefit from trade during this period has been moderate. In 1999, Bhutan accounted for roughly 3.5 percent of the total Intra-SAARC exports, mostly directed towards India, Bangladesh and Nepal. This may be understood taking into account the small size of the economy and limited trade opportunities in absence of diversified production base and specialization. Nevertheless, Bhutan is able to maintain a high ratio of exports to its Gross Domestic Product (GDP). Over the decade Bhutan’s exports accounted for an average 28.5 percent of its GDP. This shows that trade is extremely important for Bhutan seeing that it constitutes one of the largest sources of earning for the country. Further, this suggests that Bhutan’s economy is much more integrated with the rest of the world today than in the past.
Table 2 suggests that the ratio of exports to GDP for Bhutan consistently increased and peaked around the mid-90s and thereafter started sliding. During the second half of 1990s, as the rest of South Asia witnessed a decline in exports, Bhutan too seemed to have experienced a decline in the ratio of exports to GDP and in the growth of export.
However, the export growth rates for Bhutan witnessed volatile fluctuations between some years around the mid-90s. Figure 1 suggests that South Asian and Indian exports growth rates have followed a close trend with the world trade growth rates. Bhutan’s export growth rates seem to follow the world trade graph with a higher quantum growth and Indian exports graph with a time lag of one year. This is more evident in the second half of the ‘90s. For example, Indian exports growth rate peaked in 1994 before sliding, while Bhutan’s exports growth rate peaked one year later in 1995 and then started declining. The recovery of exports growth rates for India and Bhutan followed over a period after 1998. Between 1996-98, Bhutan seems to have followed the world trend, and unlike Indian exports growth rates it did not present a stretched recession of several years.
This once again suggests that Bhutan’s economy is much more integrated today with the rest of South Asia and the world than ever before.
South Asia reaps the benefits of intensified integration through the absorption of international specialization, spillover of knowledge and technological developments.
However, this has also resulted in the transmission of external trends to these economies,
and the world economic trends are more likely to affect the economies of South Asia
today. This can be seen in the broad correspondence between world growth of trade and
South Asian exports growth. When world trade plummeted due to the East Asian crisis,
South Asian economies also felt the spillover of this crisis (see Table 2). However, such a
broad correspondence may not be fully felt in Bhutan, although the possibility of such
transmission cannot be ignored. Since Bhutan’s trade is largely confined to India and a
few other countries, the transmission of trend growth in trade and also the growth of the
economy via Indian impact cannot be ruled out. Thus, not only is the economy more
integrated, there is also greater reason for influence by the global trend. However, it
would be premature to say that the transmission of the external trend to Bhutan’s
economy is direct and visible. Bhutan’s economy would continue to be affected more by
the regional economy of northeast India, more precisely economic trends in Assam and Bengal.
Figure 1
Grow th Rates of World Trade and Exports of Bhutan, India and South Asia
-20 -10 0 10 20 30 40 50 60 70
1991 1992 1993 1994 1995 1996 1997 1998 1999 2000 2001
Percentage
Bhutan Exports India Exports South Asia Exports World Trade
Table 2: Growth of Exports: World, South Asia, India and Bhutan during 1990s
Bhutan India South Asia World
GDP (in million Nu.)
Exports (in million Nu.)
Ratio of exports to GDP (%)
Annual growth
rate of exports (%)
Annual growth rate of exports (%)
Annual growth
rate of exports (%)
Annual growth rate of trade (%)
1990 4848 1192.4 24.6
1991 5342 1478.9 27.7 24.0 -1.1 5.2 4.5
1992 6178 1738.2 28.1 20.2 3.3 8.0 4.5
1993 7008 1990.4 28.4 14.5 20.2 15.3 3.8
1994 8151 2082.7 25.5 4.6 18.4 21.3 9.0
1995 9611 3349.1 34.8 60.8 20.3 20.2 9.0
1996 11406 3553.8 31.1 6.1 5.6 6.5 7.0
1997 13994 4274.1 30.5 20.3 4.5 4.8 10.4
1998 16081 4455.6 27.7 4.2 -3.9 -0.1 4.4
1999 18541 4967.9 26.8 11.5 9.5 4.4 5.8
2000 21166 4615.8 21.8 -7.1 19.6 17.2 12.6
2001 23933 4994.7 20.9 8.2 0.1 1.1 0.1
Note: figures in bracket are percentage growth for total volume of trade.
Source: i. Asian Development Bank and International Monetary Fund data; ii. National Accounts Reports, Various Issues, CSO, Thimphu; iii. Statistical Year Book of Bhutan (1999), CSO, Thimphu.
1.3 Macroeconomic Performances and Future Outlook 1.3.a. Growth profile by major sectors
Construction, Electricity, Manufacturing and Mining
Over the 1960s and 1970s, the focus of planning was basically on removing the major
hurdles in terms of infrastructure and on creating conditions for future growth.
Accordingly, the First and Second Five Year Plans (FYP) allocated 66 and 44 percent of total outlay on the construction of road network, mainly with the help of Indian technical and financial assistance. The formulation of initial plans in Bhutan was constrained by the unavailability of information and data on the country’s potential and resources. The Second FYP (1966-71) made it clear in the very beginning—“As no census has been taken nor has any detailed statistical information been collected so far it is difficult to assess the resources and potential of the country and to formulate a coordinated development plan”
(p.1). The 1960s, covering the first two plans (1961-71), may be seen as preparatory plans as they basically tried to create the building blocks of infrastructure to pave the way for future development. The first priority was assigned to the construction of road network.
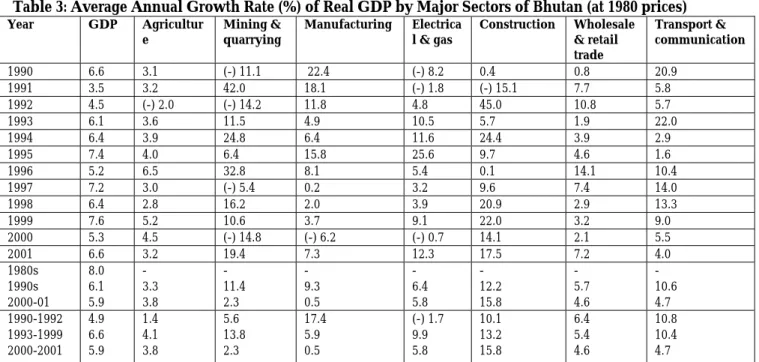
Pommaret (1994, pp.69-72) looks at the first plan as little more than an agreement between India and Bhutan to focus on infrastructure development. Similarly, UNDP’s Joint Donor Database Report (2000, p.VII) mentions that the first plan provided a framework for the allocation of Indian assistance, mainly in the form of road construction as a way of linking Bhutan internally as well as to India. The allocation on the establishment of road network continued to increase up until the third FYP (1971-76). With the commissioning of the Chhukha Hydropower Project, the real GDP experienced a major increase of 18 percent between 1986-87. This resulted in good economic performance that has been consistent over the second half of the 1980s, producing a strong growth average of 8 percent for the whole decade.
The performance over the 1990s, however, could not match that of the 1980s. The average real GDP growth of 6.1 percent achieved during the 1990s is much lower in comparison to 8 percent in the 1980s. However, the growth performance over the 1990s has been much more stable and consistent, and appears to have consolidated a great deal in the second- half of the decade. Table 3 presents the average annual growth rate of real GDP and some major sectors during the 1990s and also for 2000-01. It suggests that growth rate of real GDP has been affected mainly because of the variations witnessed in sectors like electricity, manufacturing and construction (see Figure 2). An examination of Table 3 reveals three periods in growth, recovery and slow down –
¾ Slow down between 1990-92
¾ Recovery and growth between 1993-99
¾ Further slow down in 2000
During the period 1990-92, growth rate suffered mainly because of the negative growth witnessed in the electricity sector and a slowdown in mining and quarrying activities.
The real GDP growth picked up between 1993-99, reaching a peak of 7.4 percent in 1995, mainly due to strong recovery in the electricity and mining sector; this came about with the commissioning of a ferro-alloy plant and a cement plant. An important contributory factor was the capacity expansion of the Chukha hydropower project and the enhancement in export tariff from Nu. 0.20 to Nu. 1.50/kwh. Once again in the year 2000 due to a slowdown in the electricity, mining and manufacturing sectors, real GDP growth suffered and averaged 5.3 percent in comparison to the peak of 7.6 percent observed in the previous year. The recovery of growth in 2001 is clearly attributed to a strong growth in the mining (19.4 percent), electricity (12.3 percent) and construction (17.5 percent) sectors.
Besides initiating development waves in the country, hydropower generation has also
caused the simultaneous growth of manufacturing, trade and other sectors, demonstrating
a strong linkage-effect of investment. The construction sector, for example, has been largely affected by the pre-commissioning stage of hydropower projects. This is why it has demonstrated average growth trends of slowing down between 1993-97 (the post- commissioning stage of Chukha project) and a strong recovery between 1998-99 with the massive construction work taken up towards the installation of Tala hydropower project in 1997-98 and other projects at Kurichu and Basochu.
Figure 2
Real GDP Grow th and its Relaionship w ith Mining, Manufacturing, Electric and Construction
-20 -10 0 10 20 30 40 50
1990 1991 1992 1993 1994 1995 1996 1997 1998 1999 2000 2001
Percentage
GDP Grow th Rates Mining Grow th Rates Manufacturing Grow th Rates Electricity Grow th Rates Construction Grow th Rates
Table 3: Average Annual Growth Rate (%) of Real GDP by Major Sectors of Bhutan (at 1980 prices)
Year GDP Agricultur
e Mining &
quarrying Manufacturing Electrica
l & gas Construction Wholesale
& retail trade
Transport &
communication
1990 6.6 3.1 (-) 11.1 22.4 (-) 8.2 0.4 0.8 20.9
1991 3.5 3.2 42.0 18.1 (-) 1.8 (-) 15.1 7.7 5.8
1992 4.5 (-) 2.0 (-) 14.2 11.8 4.8 45.0 10.8 5.7
1993 6.1 3.6 11.5 4.9 10.5 5.7 1.9 22.0
1994 6.4 3.9 24.8 6.4 11.6 24.4 3.9 2.9
1995 7.4 4.0 6.4 15.8 25.6 9.7 4.6 1.6
1996 5.2 6.5 32.8 8.1 5.4 0.1 14.1 10.4
1997 7.2 3.0 (-) 5.4 0.2 3.2 9.6 7.4 14.0
1998 6.4 2.8 16.2 2.0 3.9 20.9 2.9 13.3
1999 7.6 5.2 10.6 3.7 9.1 22.0 3.2 9.0
2000 5.3 4.5 (-) 14.8 (-) 6.2 (-) 0.7 14.1 2.1 5.5
2001 6.6 3.2 19.4 7.3 12.3 17.5 7.2 4.0
1980s 1990s 2000-01
8.0 6.1 5.9
- 3.3 3.8
- 11.4 2.3
- 9.3 0.5
- 6.4 5.8
- 12.2 15.8
- 5.7 4.6
- 10.6 4.7 1990-1992
1993-1999 2000-2001
4.9 6.6 5.9
1.4 4.1 3.8
5.6 13.8 2.3
17.4 5.9 0.5
(-) 1.7 9.9 5.8
10.1 13.2 15.8
6.4 5.4 4.6
10.8 10.4 4.7
Source
:i. National Accounts Statistics Report 2001, CSO, Planning Commission, Royal Government of Bhutan;
ii. Selected Economic Indicators, June and September 2001, Royal Monetary Authority, Royal Government of
Bhutan.
Agriculture, Animal Husbandry and Forestry
The agriculture sector consists of the agriculture sector proper, forestry and logging, and livestock production. Estimates
2suggest that arable and horticultural production together account for about 53 percent of sector output, with rice, maize and wheat being the main food crops, and major cash crops being apples, oranges, potatoes, ginger, and cardamom.
Forest products consisting of timber and firewood supplied to the domestic markets and the export of swan timber and unsawn logs to India account for about 26 percent of sector output. Exports of wood and wood products to India were valued at Nu. 271 million in 1993, although a downward trend in recent years reflect the government’s concern to ensure sustainable practices in forest utilization. Livestock production is estimated to account for around 21 percent of sector output, with cattle providing draught and manpower being owned by 90 percent of households. With meat and livestock products mostly retained for home consumption, the marketed amounts are small.
Although the livestock production grew at an annual rate of 3 percent in 2002 from 1.3 percent in the previous period, a significant slowdown in the agriculture proper sector from 4.3 percent in 2001 to 2.4 percent in 2002 resulted in a lower overall growth in the sector.
Estimates indicate that the output growth of the agriculture sector continued to weaken to 2.5 percent in 2002. Although the contribution of the agriculture sector to the GDP is estimated to have fallen further to about 33 percent in 2002, after rising from 35 percent in 1999 to almost 36 percent in 2000, it still remains the most significant sector. Agriculture is a source of livelihood for almost 4/5
ththe population who largely practice subsistence farming although rough terrain, poor soil quality and limited arable land (approximately 7%) pose limitations to its growth. It is nevertheless anticipated that the sector will benefit from the increasing emphasis being given to rural development activities, and expected to result in improved access to inputs, services and markets during the 9
thFYP period (2002- 2007).
Table 4: Share of Agriculture, livestock and forestry to GDP (at factor cost)
At current Prices in Millions of Ngultrum Year Agriculture,
livestock &
forestry
(a) Agriculture
proper (b) Livestock
production (c) Forestry &
logging GDP
1980 621.4 309.9 139.2 172.3 1095.5 1993 2801.9 1526.6 545.9 729.4 7007.5 1994 3427.1 1814.6 703.5 909.0 8150.5 1995 3897.7 2043.2 805.5 1048.9 9610.6 1996 4538.0 2253.7 910.2 1374.1 11405.6 1997 5368.9 2506.4 1237.5 1625.0 13995.6 1998 6057.5 2893.4 1374.1 1790.0 16080.9 1999 6630.0 3175.1 1486.9 1968.0 18540.5 2000 7772.5 3877.5 1625.0 2270.0 21165.6 2001 8470.8 4213.5 1770.3 2487.0 23933.0 2002 (e) 9325.5 4592.7 1947.3 2785.4 27532.7 (%) Share of
GDP in 2002
32.9 16.2 6.9 9.8 100.0 Source: RMA Annual Report 2002/2003, Royal Monetary Authority.
2
(i) 8
th Plan Main Document 1997-2002 (ii) 9thPlan Main Document 2002-2007, Planning Commission, Royal
1.3.b The decadal growth profile
The decade of 1960s: Foundation for development
The 1960s witnessed the execution of the first two five year plans in the country over the period of 1961-71. The 1
stFYP (1961-66) of Bhutan was prepared by the Planning Commission of India with a total outlay of Nu. 175 million fully funded by the Government of India (GOI). The road networking accounted for Nu. 62 million of total expenditure, which was about 35 percent of total outlay. Education received second priority with an allocation of Nu. 10 million (5.7 percent of the total outlay), followed by transport (Nu. 7.5 million), health (Nu. 3.2 million), forests (Nu. 3.2 million), agriculture (Nu. 2 million), power (Nu. 1.6 million), animal husbandry (Nu. 1.5 million) and industries (Nu. 1.1 million). An expenditure of Nu.9.1 million was incurred on miscellaneous pursuits. The First Plan resulted in the construction of 1770 kilometers of roads in Bhutan, including the 208 km highway connecting Phuntsholing to Thimphu and Paro. Other roads constructed were from Paro to Ha, Trashigang to Samdrup Jongkhar and from Sarbhang to Gelephu. The 2nd FYP (1966-71) envisaged a total outlay of Nu. 200 million with top priority given to road, water supply and power accounting for an allocation of Nu. 78 million or 39.5 percent of the total outlay. This time agriculture received second priority in terms of allocation and accounted for 17.5 percent of the total outlay, followed by education (12.5 percent), transport (7.6 percent), and health (6.4 percent).
The resultant expansion of road network in the country generated two parallel impacts.
One, there was a diversion of manpower towards development activities, mainly towards construction, which resulted in labour shortage in agriculture. This affected agricultural output, at least in the short period. However, with further influx of a large number of workers connected to construction activities, food supply was counter balanced partially on account of the quota of 200 tonnes of grain a month provided by the Government of India, enough to fulfill the cereal need of 7,000 workers at a time (Second Five Year Plan 1966-71, pp.1-3). The creation of wage-employment increased the cash inflow and thereby the demand for petty consumer goods. The prices of such goods tended to increase several times.
Two, before the closure of the Tibetan border in 1951, Bhutan was supposedly self- sufficient in cereal production. It also enjoyed a small surplus that was exported to Tibet.
The decline in demand for food-grain in the post-1951 period was compensated by a rise in domestic demand resulting from increased construction activities. The post-second plan period witnessed a further rise in domestic production of food gains. This was also the time when informal trade inflow from India, especially in food and other consumer items, started picking up. The increased road network brought about a tremendous rise in trade, providing farmers an opportunity to opt for specialized production. The construction of education and health infrastructure also started coming up in a big way.
The second impact ultimately proved stronger than the first one and the economy was in a
position to consolidate the gains of the past.
The decade of 1970s: Consolidation of gains
The 2nd FYP (1971-76) envisaged an outlay of Nu. 355 million and laid emphasis on improving agricultural production, setting up cooperative marketing societies and improving local livestock. In this Plan, an overarching stress was put on transport and communication with an allocation of Nu. 90.7 million, which was one-fourth of the total outlay. Bhutan quickly realized the significance of the social sector and the need for investment in health and education. The allocation on social services was about 31 percent of the total outlay of the plan. The most important feature of the third plan was reflected in the country’s ability to generate revenue from domestic sources. The Royal Government of Bhutan (RGOB) was able to finance about 70 percent of the total outlay of Nu. 355 million, while the rest came from the GOI. This was partly the result of heavy investment incurred in power and the resultant spillover in other sectors such as direct productive activities. The 4
thFYP (1976-81) continued to lay emphasis on education, health and forestry. As a result of the concerted efforts of the RGOB the country was able to lay down the foundations of socio-economic development by the end of the 1970s.
The beginning of the 1970s was also a period of grief for Bhutan due to the untimely demise of the 3
rdKing Jigme Dorji Wangchuck. However, the void was quickly filled in by the enthronement of the fourth king of Bhutan Druk Gyalpo Jigme Singye Wangchuck in 1972. Under the able and farsighted leadership of the young King Jigme Singye Wangchuck, Bhutan embarked upon a path of sustained growth. The 1970s was a significant period for Bhutan as it acquired a new face in the world on joining several international bodies, including the United Nations. In August 1975, Bhutan attended the Non-Aligned Foreign Ministers Conference at Lima, Peru and began participating in the World Food Programme (WFP), the Colombo Plan, the United Nations Development Programme (UNDP), and International Labour Organisation (ILO). Here again, the bonds of friendship with India proved strong and Indian assistance in strengthening international recognition for Bhutan was unfaltering.
The decade of 1980s: On a sustained growth path
The process of modern economic development in the country took on greater strength by the 5
thFYP period (1981-87). The period witnessed the initiation of industrial development in the country. Hydropower development was rightly identified as the main source of revenue generation and an initiator of growth impulses. By the beginning of the 6
thFYP (1987-92), Bhutan was able to meet two-thirds of its development budget from internal revenue generation. Although India’s assistance to Bhutan increased in nominal terms, it reduced relatively in the funding of the Five-Year plans. This was an indication of the growing strength of the Bhutanese economy. The decade of the 1980s put the economy on a higher growth path with real GDP experiencing a quantum jump of 18 percent over 1986-87. The commissioning of the Chukha Hydropower Project proved to be a real boon for the economy as it produced a strong growth average of 8 percent for the whole decade.
The decade of 1990s: Period of fluctuating fortune
The goal of self-sufficiency and less dependency on foreign capital and labour was further
emphasized in the 7
thFYP (1992-97). The 1990s also witnessed concerted efforts towards
the process of decentralization. The 8
thFYP (1997-2002) crystallized the idea of sustainable
development. At the same time, the need for expanding the public sector has been felt and
measures initiated for its development. The growth of hydropower projects resulted in a strong growth of the industrial sector in the country. However, as has been already explained, the average annual growth rate of the economy during the 1990s could not match that of 1980s. The economy suffered during the beginning of the decade due to political turbulence in the south.
3A recovery was witnessed only at the end of the decade.
Growth fluctuated a great deal over the period of 1990s, once again to decelerate in the post-2000 period.
1.3.c. Budgetary position
Table 6 reports the overall budget surplus/deficit as percentage of GDP for Bhutan and also internal revenue generation position of the country. These percentages have been calculated from the actual figures presented in table 5 containing a summary of budgetary operations. Bhutan maintained a relatively low deficit ratio till recently, and it was only during 1999-2000 that the ratio climbed slightly and crossed 5 percent in 2000. The explanation appears to lie in the relative position of total revenue and expenditure of the government. The ratio of total revenue including grants saw a decline during 1999-2000.
On the positive side, the tax revenue to GDP percentage improved considerably over time and during 1999-2000, it crossed 10 percent for the first time indicating the growing strength of the economy.
Table 5: Summary of Budgetary Operations
Millions of Ngultrum Item 1993/94 1994/95 1995/96 1996/97 1997/98 1998/99 1999/00 2000/01(r) Revenue
Tax Non-tax Others
1,666.3 503.3 1,064.9 98.1
1,877.4 649.8 1,032.1 195.5
2,127.7 844.2 1,086.9 196.6
2,424.4 868.9 1,204.1 351.4
3,133.0 1,246.4 1,743.4 143.2
3,656.9 1,265.8 2,220.0 171.1
4,585.4 1,977.1 2,355.5 252.8
5.097.6 2,200.6 2,470.9 426.1 Grants
From India Others
1,456.3 607.5 848.8
1,773.2 728.0 1,045.2
2,363.6 1,168.9 1,194.7
2,232.1 947.6 1,284.5
1816.3 1,045.1 771.2
3,262.6 1,928.5 1,334.1
3,274.1 1,927.1 1,347.1
3,310.7 1,663.4 1,647.3 Total Revenue and
Grants
3,122.6 3,650.6 4,491.3 4,656.5 4,949.3 6,919.5 7,859.5 8,408.3
Expenditure Current Capital
3,167.5 1,550.9 1,616.6
3,642.7 1,906.7 1,736.0
4,252.7 1,968.2 2,284.5
4,957.2 2,341.2 2,616.0
4,806.0 2,627.8 2,178.2
7,224.4 3,178.3 4,046.1
8,624.1 3,702.1 4,921.9
9,704.9 4,397.6 5,307.4 Budget Surplus/Deficit -44.9 7.9 238.6 -300.7 143.3 -304.9 -764.5 -1,296.6 Financing Transactions
External borrowings (Net of principal repayments) Internal resource gap
Internal borrowings (Net of principal repayments) Cash and bank balances Others
45.0 24.0
21.0 22.5 -1.5 -
-7.8 -6.7
-1.1 2.5 -3.6 -
-238.7 -26.8
-211.9 37.2 -249.1 -
300.8 124.2
176.6 -100.0 276.6 -
-143.3 336.3
-479.6 -1.8 -477.8 -
304.9 553.6
-248.7 - -248.7 -
764.5 606.6
158.0 - 158.0 -
1,296.6 496.6
800.0
Source: Selected Economic Indicators, June 2001, Royal Monetary Authority.
3
Background provided in the annexes.
Table 6: Budget surplus/deficit, total revenue and tax revenue as percentage of GDP of Bhutan
Budget surplus/deficit as % of GDP
Total revenue (including grants) as
% of GDP
Tax revenue as % of GDP
1993 - 0.6 44.6 7.2
1994 0.1 44.8 8.0
1995 2.5 46.7 8.8
1996 - 2.6 40.8 7.6
1997 1.0 35.4 8.9
1998 - 1.9 43.0 7.9
1999 -4.1 42.4 10.7
2000 - 6.1 39.8 10.4
Source: Calculated from data provided in Selected Economic Indicators, June 2001, Royal Monetary Authority.
However the percentage increase in total revenue including grants show a consistent decline (Table 7). Data on total revenue of the government indicate that it increased by 40 percent in 1998-99 over the previous year, declined to 14 percent in 1999-00, further down to 7 percent in 2000-01, and was then estimated to decrease further by 4 percent in 2001- 02. The expenditure side suggests that percentage rise in total expenditure, both current and capital, has tended to decline over time and is kept within prudent limit. It is basically the grant factor that has resulted in a large budget deficit that recently occurred. On the grant side, the most important factor seems to be the recent decline in the proportion of Indian grants in total grants received by Bhutan (Table 6). Indian grants in proportion to total grants to Bhutan has declined from 59 percent in 1998-99 to 50 percent in 2000-01 and is estimated to go down further to 46 percent in 2001-02. Even the absolute amount of grants from India in the post-1999 period seems to have gone down from Nu.1927.1 million in 1999-00 to Nu.1663.4 million in 2000-01, and the amount is expected to go decrease further to Nu.1340.3 in 2001-02. Table 8 presents a summary of Individual grant donors including India since 1993/1994 – 2002/2003.
Table 7: Revenue and Expenditure Position of Bhutan
Percentage rise in total expenditure Percentage rise in total
revenue including
grants Current Capital
Percentage of Indian grants in total grants received by Bhutan
1998-99 40 21 86 59.1
1999-00 14 16 22 58.8
2000-01 7 19 8 50.2
2001-02e -4 5 2 45.9
Note: e is estimated.
Source: Selected Economic Indicators, September 2001, Royal Monetary Authority.
Table 8: Individual Grant Donors (1993/1994 – 2002/2003) In Millions of Ngultrum
Agency 1993/93 1994/95 1995/96 1996/97 1997/98 1998/99 1999/00 2000/01 2001/02 2002/03 Govt. of India
DANIDA JICA Netherlands UNDP Austria HELVETAS Swiss Dev. Coop.
EU UNCDF Others
607.5 141.3 225.8 14.9 47.2 26.1 80.9 27.7 45.0 30.7 209.1
721.4 173.0 313.4 60.6 18.5 45.8 26.1 42.0 60.4 85.0 198.5
1168.9 155.3 0.0 253.6 21.9 1.9 106.0 29.9 107.8 43.9 464.9
947.6 218.2 475.0 84.0 44.5 22.0 18.1 62.2 33.5 118.2 208.7
1045.1 135.6 0.0 66.8 100.3 85.3 15.0 49.5 57.1 88.4 173.1
1928.5 385.2 0.0 88.8 122.1 170.7 147.2 200.6 35.1 37.4 146.9
2187.9 318.7 7.1 74.4 140.8 143.0 75.8 106.2 29.9 10.6 179.7
2551.2 394.8 0.0 147.6 51.4 174.2 94.3 66.8 18.0 27.2 185.4
945.3 534.8 4.2 274.5 132.7 44.2 0.0 62.6 112.5 26.9 559.3
2631.8 525.8 0.0 201.0 85.6 68.7 0.0 103.5 130.8 26.6 707.9 Total 1456.2 1744.7 2354.0 2232.1 1816.3 3262.6 3274.1 3711.0 2696.9 4481.7
Percentage change on the Previous Year
Total 18.4 19.8 34.9 -5.2 -18.6 79.6 0.4 13.3 -27.3 66.2 Source: RMA Annual Report 2002/2003, Royal Monetary Authority.
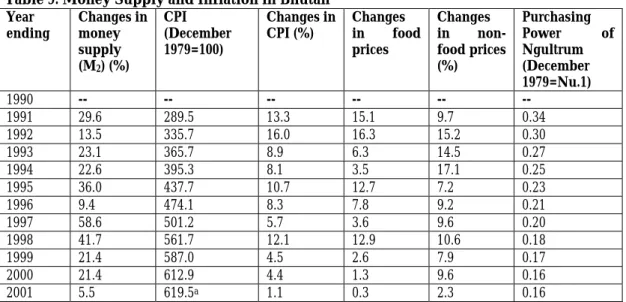
1.3.d Money supply and inflation
The annual average growth rates of money supply, measured in terms of broad money excluding term deposits M
2, have fluctuated a great deal (see Table 9). The M2 supply has fluctuated the maximum around the mid-1990s. However, the post-1997 period has seen a consistent decline in M
2supply, and this has presumably affected inflation rates over time.
The average inflation rate over the 1990s has consistently gone down for Bhutan and in 2001 it was just 1.1, one of the lowest in the sub-region. Food prices seem to have fluctuated a great deal, while changes in non-food prices have been sharper and higher than that of food prices. Table 6 suggests that both food and non-food prices have tended to stabilize on the lower side since 1999.
Figure 3 provides a plotting of money supply growth rates along with the inflation rates in Bhutan. The plotting lends support to the notion that inflation has moderately, if not closely, followed the growth of money supply in the country.
Table 9: Money Supply and Inflation in Bhutan
Yearending
Changes in money supply (M2) (%)
CPI (December 1979=100)
Changes in CPI (%)
Changes in food prices
Changes in non- food prices (%)
Purchasing
Power of Ngultrum
(December 1979=Nu.1) 1990 -- -- -- -- -- -- 1991 29.6 289.5 13.3 15.1 9.7 0.34 1992 13.5 335.7 16.0 16.3 15.2 0.30 1993 23.1 365.7 8.9 6.3 14.5 0.27 1994 22.6 395.3 8.1 3.5 17.1 0.25 1995 36.0 437.7 10.7 12.7 7.2 0.23 1996 9.4 474.1 8.3 7.8 9.2 0.21 1997 58.6 501.2 5.7 3.6 9.6 0.20 1998 41.7 561.7 12.1 12.9 10.6 0.18 1999 21.4 587.0 4.5 2.6 7.9 0.17 2000 21.4 612.9 4.4 1.3 9.6 0.16 2001 5.5 619.5a 1.1 0.3 2.3 0.16 Note: a. Figure pertains to June
Source: Various issues of Selected Economic Indicators, Royal Monetary Authority, RGOB.
Figure 3
Growth Rates of Money Supply and Inflation in Bhutan
0 10 20 30 40 50 60 70
1991 1992 1993 1994 1995 1996 1997 1998 1999 2000 2001
Percentage
Growth Rates of Money Supply
Inflation Rates
1.3.e International reserves and foreign capital
Bhutan’s international reserves include convertible currency reserves and rupee reserves.
An important point to be noted here is that Bhutan’s requirement for convertible currency reserve has increased gradually. This is due to economic diversification and growing ties with countries other than India, though the proportion of convertible currency reserves in total reserves has gone down recently, from almost 85 percent in 1997 to 77 percent in 2001. This might have its implications, especially in trade. For example, 20 percent of import is paid for in convertible currencies whereas export proceeds fetch a mere 5 percent of earnings in convertible currencies (Wangyel 2003). However, the building up of rupee reserve has provided a stable basis and easy flow of trade with India.
Bhutan joined the IMF on September 28, 1981 and since then its SDR quota increased consistently from US $ 1.7 million in 1981 to US $ 6.3 million in 1999. Bhutan’s reserves position at IMF has increased from US $ 0.57 million in 184 to US $ 1.02 million by September 30, 2003, reflecting the growing strength of the Bhutanese economy.
1.3.f Future Outlook: IMF’s Projection
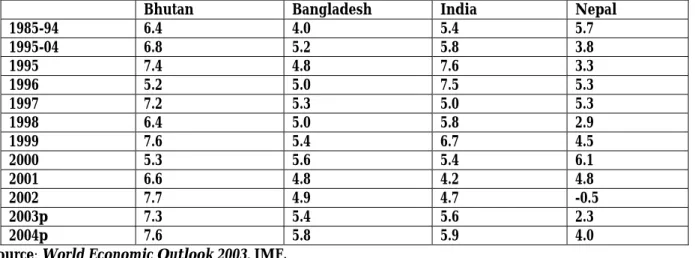
The IMF’s World Economic Outlook (WEO) 2003 provides future outlook for 2003-04 for the growth of the economy. The data pertaining to Bhutan and its neighbouring countries as reported in this report is presented in Table 10 below.
The decadal comparison points out that except for Nepal, other countries have shown
improved performance in the average growth rate of GDP during 1995-2004 in
comparison to 1985-94. However, the average growth rate difference between the decades
has not been very significant for any of the countries, the highest being demonstrated by
Bangladesh (by 1.2 percent point). The trend growth suggests a downward movement
during the close of the 1990s and a probable recovery by the beginning of 2001-02. For
Bhutan, however, growth rate seems to have fluctuated a great deal between the periods
with a projected recovery by 2004.
Table 10: Growth Outlook of Bhutan and Neighbouring Countries as Projected by IMF’s World Economic Outlook 2003 (%)
Source: World Economic Outlook 2003, IMF.
Overall, the performance of the Bhutanese economy indicates its macroeconomic stability, while at the same time highlighting its dependency on other countries, especially India, in several crucial areas. This increases the vulnerability of the economy. It has also been pointed out that in the absence of diversification in production and trade, the Bhutanese economy may become more dependent on imports with every enlargement in ‘hydro- Ngultrum’ earnings. For example, the commissioning of the Tala hydropower project of 1020 MW by 2004-05 is expected to increase the GDP growth by 18.1 percent by 2006-07, which is likely to induce the GDP per capita further by 40 percent with an expected population base of 0.792 million. Since the share of manufacturing is expected to reach 30 percent of GDP only by 2012, this newly generated ‘hydro-Ngultrum’ will further increase the demand for imports. This may be explained as dependency amidst plenty syndrome (Pankaj 2003). Further, the limited growth of the private sector poses constraints on the desired diversification of the economy. Perpetuated, this can undermine Bhutan’s capacity to reap advantages from the multilateral trading system when it joins the WTO.
Bhutan Bangladesh India Nepal
1985-94 6.4 4.0 5.4 5.7
1995-04 6.8 5.2 5.8 3.8
1995 7.4 4.8 7.6 3.3
1996 5.2 5.0 7.5 5.3
1997 7.2 5.3 5.0 5.3
1998 6.4 5.0 5.8 2.9
1999 7.6 5.4 6.7 4.5
2000 5.3 5.6 5.4 6.1
2001 6.6 4.8 4.2 4.8
2002 7.7 4.9 4.7 -0.5
2003p 7.3 5.4 5.6 2.3
2004p 7.6 5.8 5.9 4.0
Chapter 2. ECOMOMIC DEVELOPMENT POLICY 2.1 Development Strategy
The development strategy of Bhutan seeks to strike an appropriate balance among social, economic, political, cultural and environmental goals. While mapping the future development course, Bhutan 2020: A Vision for Peace, Prosperity and Happiness (Planning Commission 1999, RGOB) clearly brings out these goals in the ‘Normative Architecture for Change and Development’ (p.49). The various elements of this ‘architecture’ are put under the following broad categories: Social - Human Development; Economic - Self-Reliance, Sustainability, Flexibility, Balanced and Equitable Development; Political - Independence, Sovereignty and Security of the Nation- State and Governance; Cultural - Identity, Unity and Harmony, Preserving and Promoting Culture and Heritage; Environmental - Preservation through Environmentally Sustainable Development.
The development strategy places human development at the center-stage. A holistic approach to development has been designed to take care of material as well as spiritual needs of individuals. Health and education are considered priority areas for basic capacity development towards the generation of human capital. This is to be achieved within the framework of traditional values and ethics so that the “society in transformation” continues to draw inspiration from the nation’s cultural heritage (Planning Commission 1999: Bhutan 2020, pp.47-48). It is crucial that sustainability be observed because an untenable proposition in any field is likely to have a negative impact on the sovereignty and security of the nation (Ibid: Bhutan 2020, p.45).
The national development vision accords Gross National Happiness (GNH)
4as the central development concept, one that encompasses goals, principles, objectives and direction of development. His Majesty King Jigme Singye Wangchuck propounded the philosophy of GNH, emphasizing that Gross National Happiness is more important than Gross National Product. This vision of GNH has been articulated and groomed into the overall guiding principles for the development of Bhutanese society and economy. The expression GNH is essentially a summarization of the basic tenets of Vajrayana Buddism, the state religion of Bhutan, which spreads the culture of harmony and compassion.
The GNH does not essentially reject material progress, but takes it as a precondition for enlarging self-reliance, opportunities and choices (Ibid: Bhutan 2020, p.47). At the operational level, the theory of GNH would mean that every policy and every project is to be planned and evaluated not simply in terms of the enhancement it makes to GNP and the material basis of society but also by its contribution to the total well-being of individuals and society (RGOB 2000: Development Towards Gross National Happiness, p.22), including the impact it will have on the environment. The GNH is, therefore, “Bhutan’s bridge over the gap between values and development” (Ibid: DTGNH 2000, p.23). The doctrine of GNH has not only allowed the development process to emanate from the cultural roots; it has also provides a cautious and rational defense against the impoverishing and detrimental impact of global changes. This places Bhutan on a better footing, where it can exercise options and obtain judicious benefits from the process of liberalization.
4
More information on GNH can be accessed at http://www.bhutanstudies.org.bt: Gross National Happiness
– Discussion Papers, The Centre for Bhutan Studies, Thimphu, 1999.2.2 Economic Reforms and Approach
Bhutan’s pursuit of development is intended to be holistic in nature to ensure flexibility and sustainability. While flexibility is explained in terms of the country’s ability to adapt and respond effectively to changes, sustainability has to be taken into account in the social, financial, economic, cultural and environmental fields. The process of economic reforms in Bhutan is essentially set against this backdrop.
Nevertheless, over the last four decades of planned economic development Bhutan’s interactions at the bilateral and multilateral levels have increased considerably. Bhutan’s development strategy has gradually started moving towards incorporating the benefits of globalization and increasing participation in international trade, through structural changes geared at ensuring faster growth and economic diversification. However, the process of economic reforms in Bhutan has not emanated from any serious economic crisis and therefore differs from ‘conditionality driven’ reforms. For Bhutan, it has been more a process of self-adjustment based on the changing needs of its society and economy. Such changes are driven by domestic needs as well as influence from external developments, especially those occurring in the neighbouring countries. In light of this, the process of economic reforms in Bhutan can be described as an attempt to make up for discrepancies in policies with regard to its major economic development partners. Another way of looking at the process of economic reforms in Bhutan is from the participatory requirement point of view. Bhutan’s perceived need to join international communities and share the benefits of liberalization has propelled its active commitment under several forums and treaties within and outside the sub-region. Today Bhutan is committed to join the WTO, and a constant perusal of policy is required to fulfill the requirements of WTO and to benefit from the new regime.
2.2.a The External Sector
The external sector is extremely important for Bhutan as it provides two most important sources of growth—exports earnings and foreign aid. The top listed items of exports are electricity, mineral products, products of chemical industries, base metals and products, wood & wood products and processed foodstuff. Bhutan is dependent on imports for its requirements of capital goods, raw materials, basic consumer goods and medicine and pharmaceuticals. Bhutan has bound its tariff structure at a moderately low level that is relatively lower than India and other South Asian countries. Bhutan sales tax rates for most commodities range up to 15 percent with a high of 50 percent for alcohol and tobacco products. Custom duties range between 10 to 30 percent for most items and 50 percent for non-alcoholic beverages and beer. For alcoholic beverages and tobacco products the custom duty is fixed at 100 percent (Department of Revenue and Customs, RGOB 2002). In the absence of a well-diversified domestic economy, Bhutan depends heavily on imports; consequently, import duties on most items are low and well within the applied rage of 20-40 percent (GATT 1994).
Foreign capital in Bhutan flows mostly in the form of official development assistance
(ODA) and concessional debt. Very little has been received so far in the form of foreign
direct investment (FDI). The ODA to Bhutan is mostly donor-funded in the form of grants,
directed chiefly towards development projects. The country has been dependent on
foreign aid for most of its massive development projects with huge capital requirements.
The aid inflow in Bhutan mostly comes from bilateral donors, who are also its development partners with India being the most important one.
While such bilateral aid flows averaged about 62 percent of the total during the1990s, about 15 percent on average had been received by the UN systems (UN 2001: UN: Country Presentation for Bhutan 2001, p.53). The sector-wise inflow of foreign aid over the 1990s suggests that on average the Renewable Natural Resources sector received the maximum of 19 percent, followed by Transport and Communication (16 percent), Human Resource Development (14 percent), Health (11 percent), Development Administration (11 percent), Energy (8 percent), Industries (4 percent) and social development (7 percent).
Bhutan follows the principle of achieving self-reliance in the course of economic progress and sustainability in each aspect of its development process. This underscores the idea that development should not be financially unsustainable with indulgence in investments that can be ill afforded. More precisely, untenable increases in debt service obligations in blind pursuit of development, is strongly discouraged (Planning Commission 1999:
Bhutan 2020, pp.44-45). Such guidelines have helped the country in utilizing foreign aid resources quite efficiently and effectively, with most of the aid being well directed and in the form of technical co-operation, project assistance and investment related technical assistance.
Bhutan’s cautious policy towards foreign capital has resulted in its acceptance of loans strictly on concessional terms. Even though the volume of such debt has increased over time, the overall situation seems comfortable. However, debt-volume is expected to go up slightly by 1999-2000 in the wake of increased borrowings for the construction of power projects. The overall debt portfolio suggests that the maximum outstanding commitment of US $ 194.86 million (more than 50 percent of total loan commitment) falls in the energy sector, with 90 percent from India as Rupee loans. An outstanding loan commitment of about US $ 73.37 million stands towards ADB, World Bank and other international institutions, basically being utilized in the Renewal Natural Resources sector (UN 2001:
UN: Country Presentation for Bhutan 2001, p.36).
2.2.b Foreign Exchange Regime
The Bhutanese Ngultrum is pegged to the Indian rupee, which is accepted as legal tender in Bhutan. However, this is confined to current account transactions only and restrictions apply in dealing with capital account transactions. Current account controls include:
ceilings on amount of foreign exchange that commercial banks can hold; limits on foreign exchange requirements for importers; limits on foreign exchange earnings exporters can retain in foreign in foreign currency; and limits on foreign currency that business people or private travelers can take out of the country. Capital account controls include Foreign Direct Investment, and offshore investment and borrowings. In the case of other currencies, convertibility restrictions are followed on both current and capital account.
2.2.c Private Sector Development
While the total investment in the economy has increased tremendously, the share of
private investment has not picked as up much. Private investment in manufacturing is
quite low with investments largely directed towards residential dwellings. The Royal
Government has taken a host of measures to encourage private sector development in the
country (for details see RGOB 2000: Development Toward Gross National Happiness, pp.83-86 and Planning Commission 2002: Ninth Five Year Plan 2002-07, pp.61-65). The Bhutanese government is following an active divestiture program towards privatizing many major public sector enterprises. The postal services, road maintenance, forestry services and agricultural machinery are on the list of future privatization in the country. However, views have been expressed that this should await further growth in the private sector, especially in consideration of a small population of local labour, small capital market, shortage of skills and insufficient infrastructure and the extremely small presence of foreign capital (World Bank 1996, p.8).
2.2.d Foreign Direct Investment Policy
Bhutan has pursued a conservative and restrictive foreign investment policy until very recent times. This has been in keeping with concerns over the undesirable impact that FDI could have on Bhutanese tradition and culture, as well as in the interests of a relatively weak private sector that could face undue pressure from the competitiveness of foreign investors. Considered on a "case by case basis" foreign investment up to date has been limited as shown in table 11.
Table 11
Year Local Partner % Foreign Partner % Public 1. 1971 Bank of Bhutan 80 State Bank of India 20 0 2. 1990 Bhutan Ferro Alloys Ltd. 40.12 Marubeni Corp (Japan) 20 39.88%
3. 1996 Bhutan National Bank* 27.2 Asian Development Bank 20.1 52.77%
4. 2001 Bhutan Tourism Co. Ltd. 30 Aman Resorts (Singapore) 60 10%
5. 2001 Bhutan International Company
530 Hotel Property Ltd.
(Singapore)
60 10%
Source: Monthly Statistical Bulletin January 2003, Royal Monetary Authority, Thimphu, Bhutan.
Following the entry of the State Bank of India as the first foreign investor in Bhutan, there was a long gap before the Marubeni Corporation made investments into the Bhutan Ferro Alloys Ltd., and the Asian Development Bank facilitated the transformation of the Unit Trust of Bhutan into the Bhutan National Bank. Now, with the coming of the two international hotel chains to the country, Bhutan has for the first time allowed foreign investors a majority shareholding.
The government's approval of the Foreign Direct Investment (FDI) Policy in December 2002 is a significant landmark in Bhutan’s gradual process towards economic liberalization. With its broad objectives to support private sector development, generate employment, facilitate transfer of capital, technology and skills, and broaden the revenue base, a number of areas in the manufacturing and service sectors where foreign investors can hold up to 70% equity have been identified
6. However, it is observed that the FDI Policy is still somewhat conservative (Wangyel 2003), presenting several constraints to
6