Policy Research Working Paper 6155
Unlocking Bangladesh-India Trade
Emerging Potential and the Way Forward
Prabir De Selim Raihan Sanjay Kathuria
The World Bank South Asia Region
Economic Policy and Poverty Sector August 2012
WPS6155
Public Disclosure AuthorizedPublic Disclosure AuthorizedPublic Disclosure AuthorizedPublic Disclosure Authorized
Produced by the Research Support Team
Abstract
The Policy Research Working Paper Series disseminates the findings of work in progress to encourage the exchange of ideas about development issues. An objective of the series is to get the findings out quickly, even if the presentations are less than fully polished. The papers carry the names of the authors and should be cited accordingly. The findings, interpretations, and conclusions expressed in this paper are entirely those of the authors. They do not necessarily represent the views of the International Bank for Reconstruction and Development/World Bank and its affiliated organizations, or those of the Executive Directors of the World Bank or the governments they represent.
Policy Research Working Paper 6155
The primary objective of this study is to analyze the impact on Bangladesh of increased market access in India, both within a static production structure and also identifying dynamic gains. The study shows that Bangladesh and India would both gain by opening up their markets to each other. Indian investments in Bangladesh will be very important for the latter to ramp up its exports, including products that would broaden trade complementarity and enhance intra-industry trade, and improve its trade standards and trade-handling capacity. A bilateral Free Trade Agreement would lift Bangladesh’s exports to India by 182 percent, and nearly 300 percent if transaction costs were also reduced through improved connectivity. These numbers, based on existing trade patterns, represent a lower bound of the potential increase in Bangladesh’s exports arising from a
This paper is a product of theEconomic Policy and Poverty Sector, South Asia Region. It is part of a larger effort by the World Bank to provide open access to its research and make a contribution to development policy discussions around the world. Policy Research Working Papers are also posted on the Web at http://econ.worldbank.org. The authors may be contacted at prabirde@hotmail.com, sraihan_duecon@yahoo.com, skathuria@worldbank.org.
Free Trade Agreement. A Free Trade Agreement would also raise India’s exports to Bangladesh. India’s provision of duty-free access for all Bangladeshi products (already done) could increase the latter’s exports to India by 134 percent. In helping Bangladesh’s economy to grow, India would stimulate economic activity in its own eastern and north-eastern states. Challenges exist, however, including non-tariff measures/barriers in both countries, excessive bureaucracy, weak trade facilitation, and customs inefficiencies. Trade in education and health care services offers valuable prospects, but also suffers from market access issues. To enable larger gains, Bangladesh-India cooperation should go beyond goods trade and include investment, finance, services trade, trade facilitation, and technology transfer, and be placed within the context of regional cooperation.
Unlocking Bangladesh-India Trade:
Emerging Potential and the Way Forward
Prabir De1, Selim Raihan2, and Sanjay Kathuria3
1. Fellow, Research and Information System for Developing Countries (RIS), New Delhi, e-mail:
prabirde@hotmail.com. 2. Associate Professor, Department of Economics, University of Dhaka, Dhaka and Executive Director, South Asian Network on Economic Modeling (SANEM), Dhaka, e-mail:
sraihan_duecon@yahoo.com 3. Lead Country Economist, SASEP, the World Bank, Bangladesh, e-mail:
Skathuria@worldbank.org.
The authors wish to thank Mia Mikic, Thomas Farole, Olivier Cadot, Md. Abul Basher and Zahid Hussain for their useful comments on earlier versions of this paper, and Poulomi Dasgupta for her research assistance. They also acknowledge the support provided by the World Bank for this study. The views expressed are the authors‘ alone, and not necessarily those of the World Bank, RIS, University of Dhaka and SANEM. The usual disclaimers apply.
[Sanjay Kathuria is affiliated to the EPOL Sector Board, and is a Lead Economist in SASEP]
Key words: Bangladesh, India, FTA, Trade facilitation, Trade liberalization, CGE model JEL codes: F10, F13, F15, F17
ii
Table of Contents
Abstract ... i
1. Introduction ... 1
Data and Methodology ... 2
2. Quantifying the Benefits of Trade Liberalization and Facilitation between India and Bangladesh: Brief Review of the Literature ... 2
3. Market Access for Trade in Goods and Selected Services ... 5
3.1. Bangladesh‘s Trade with Neighboring Countries ... 5
3.2. Trade Complementarity and Intra-Industry Trade ... 8
3.3. Trade in Services in Education and Health Sectors between Bangladesh and India ... 12
3.4. Scenario Analysis with the Global Computable General Equilibrium (CGE) Model ... 13
3.4.1. Removal of India‘s Negative List and Its Impact on Bangladesh‘s Export to India ... 15
3.5. Market Access Issues ... 19
3.6. Beyond Trade in Goods ... 21
4. Connectivity, Trade Facilitation, and Transit ... 21
4.1. Implications ... 27
5. Conclusions and Policy Implications ... 27
References ... 31
1. Introduction
Despite bonds of culture and a shared history, as well as neighborly proximity, economic ties between Bangladesh and India are far below potential. There is a feeling that rapid growth in both countries and increasing levels of economic sophistication in India now present opportunities for enhanced economic cooperation. Bangladesh could export far more, for example, to India‘s vast market, and Indian firms could invest in Bangladesh, benefiting from abundant and relatively inexpensive labor, and re-export to India as well as other countries. And there are plentiful opportunities for trade in services.
Current reality is different. Trade in South Asia in general––and between India and Bangladesh, in particular––faces innumerable barriers, some of which are purely economic in nature. Because of these barriers, the loss to industry and consumers in general is considerable. For example, if markets were to open up effectively, Bangladesh could increase its exports of leather and ceramic products to India, and India could increase its sugar exports to Bangladesh, where currently it is being smuggled in. Pakistan could increase its trade in fresh and dry fruits. India could buy molasses and cement from Pakistan and export machinery back, or increase its export of yarn to Sri Lanka. Since this is not the case at present, South Asian traders have to contend with a multitude of trade barriers, while the absence of proper facilitating mechanisms multiplies trade costs. For example, a surgical equipment manufacturer in Pakistan sells equipment to Indian hospitals via a third country simply because India and Pakistan do not trade in these products directly. The landed cost of jamdani sarees or hilsa fish from Bangladesh in the West Bengal state of India is high because the trade standards adopted by the two countries are very different. There are many other examples. Pakistan imports tea from Kenya, when neighboring India and Sri Lanka offer much better options. India exports a significant amount of cotton yarn to Bangladesh, but not to Sri Lanka or Nepal, which are deficient in cotton yarn. As a result, informal trade in South Asia has grown considerably and in many cases exceeds the formal trade volume.
Better market access, improved physical connectivity and transit, and energy trade between India and Bangladesh are important instruments for unlocking bilateral trade potential. Greater engagement in these areas would also stimulate employment and other economic and social activities, which in turn would help to reduce poverty (particularly in the border areas), enhance foreign direct investment (FDI) flows, and generate new business opportunities for the private sector. Bilateral trade and investment offer immense opportunities for accelerating growth and reducing poverty. India could become a hub for stimulating the growth of intra-industry trade and boosting FDI inflow to Bangladesh. At the same time, Bangladesh can become an additional source of trade and investment for India‘s eastern and north-eastern states. Furthermore, in view of several regional and sub-regional cooperation initiatives involving India and Bangladesh, greater bilateral economic cooperation and integration between these two economies is a critical step for an integrated South Asia. This integration will eventually provide a basic foundation for a more effective SAARC (South Asian Association for Regional Cooperation) in moving towards more free-market and trade-oriented policies. Deeper India-Bangladesh cooperation would be a part of the process towards a stronger SAARC.
The prospects of cooperation between Bangladesh and India seem brighter than ever, particularly since the governments of both countries have recently shown political interest in this regard. The Prime Ministers of the two countries met in 2010 and 20111 and agreed to cooperate in (i) broadening access to each other‘s markets, (ii) improving physical connectivity, including sub-regional transit, and (iii) electricity trade. Would deeper cooperation in these fields lead to significant economic and social benefits? A full-length study on bilateral economic cooperation between India and Bangladesh would be needed to answer that question.
1 Refer to the joint communiqué issued on the occasion of the visit of the Prime Minister of Bangladesh to India on January 12 2010, and the joint statement issued on the occasion of the visit of the Prime Minister of India to Bangladesh on 7 September 2011.
2
This study‘s primary objective is to explore the benefits for trade and economic growth that could be derived from enhanced market access for Bangladesh in India, and improved physical connectivity between the two countries. It studies the impact of market access on trade in goods, an area of particular interest to Bangladesh. It also analyzes trade facilitation and transit issues between the two countries, and examines a set of emerging challenges for the region, setting out a road map for deepening bilateral economic relations.
Data and Methodology
The study is based on secondary data.2 A computable general equilibrium (CGE) model was used to address market access issues and to assess the impact of, say, a free trade agreement (FTA) on potential exports. The indirect effects of even a single tariff reduction may be quite complex, and this complexity increases with the number of trade policies and markets involved. As FTAs cover multiple sectors and various trade reforms, they are often simulated using CGE modeling. The CGE model relies on standard microeconomic theory for rigor and consistency and on computer algorithms for model-solving.
An augmented gravity model was also used to assess the effect of trade facilitation and trade cost elements on bilateral trade. Estimated results from this partial equilibrium model would help to estimate the potential for trade, whereas those from the CGE model would provide directions to the way forward.
2. Quantifying the Benefits of Trade Liberalization and Facilitation between India and Bangladesh: Brief Literature Review
In trade theory, welfare effects of any regional trade agreement (RTA) are analyzed using two concepts:
trade creation and trade diversion.3 The fundamental arguments for regionalism rest on evidence that suggests RTAs are predominantly trade-creating.4 The reasoning is that most RTAs are likely to entail relatively low welfare losses resulting from trade diversion, since the countries involved are often neighbors and hence already engaged in substantial trade;5 countries can ―lock in‖ reform through RTAs, which is often politically less feasible under multilateral arrangements,6 and if multilateral trade talks fail or stall, trade liberalization is restricted to RTAs. It is further argued that countries can build on the progress of regionalism and ultimately move towards a freer trade regime on the whole. There are, however, some critical arguments against formation of any RTA. It is alleged that an RTA undermines the spirit of multilateralism, and that the world might be divided into protectionist blocs, and that protectionists might accept RTAs in order to oppose further multilateral liberalization. In that case RTAs might be stumbling blocks to multilateralism. Simultaneous, complicated RTA negotiations could also bring about a ―spaghetti bowl‖ effect.7
2 Data came mostly from national government sources of Bangladesh and India, and multilateral development organizations such as the World Bank, IMF, WTO, UNCTAD, UNESCAP, and UNCOMTRADE.
3 Integration is both a policy of protection and a move towards free trade. The effect of the protectionist element of integration is called trade diversion, and the effect of the trade liberalization element is called trade creation. The RTA‘s overall effect on the welfare for a member country is determined by comparing the trade- creation and trade-diversion effects. If trade creation dominates, the formation of a RTA will enhance welfare;
if trade diversion is greater, the RTA will lead to a welfare loss for the country concerned. Note that if member countries are the low-cost producers of the traded good, there will be no trade-diversion effect and integration will unambiguously increase welfare.
4 See Rodríguez-Delgado (2007).
5 See Krugman (1991).
6 Whalley, (1996), for example, asserted that a desire for increased credibility of domestic reforms was a central preoccupation behind the Mexican negotiating position on the North American Free Trade Agreement (NAFTA).
7 See Bhagwati and Panagariya (1996).
3
Baysan et al. (2006) have argued that the economic case for any regional integration in South Asia has been relatively weak. They point to three important features of the South Asian economies that they believe make a regional FTA economically unattractive. Firstly, the economies are relatively small:
despite its population (one-fifth of the world), the region‘s per-capita income is low, so its economic size remains small: less than 5 percent of the world‘s GDP, and just 0.4 percent if India is discounted. Since, as Baysan et al. contend, it is improbable that the most efficient suppliers to the member countries are located within the region, the probability that the FTA would be largely trade diverting is quite high.
Secondly, they argue that the levels of protection among all South Asian countries, with the possible exception of Sri Lanka, are too high to make a regional arrangement practical. Third, they contend that when countries in an FTA are allowed to choose sectors to exclude from tariff preferences, domestic lobbies press to protect those sectors of their country that may not withstand foreign competition. The rules of origin, too, may be misused by bureaucrats to block imports if an inefficient domestic competitor is affected.
Baysan et al.‘s first argument, however, may not apply to bilateral trade between India and Bangladesh, since India has been a major source of imports for Bangladesh, suggesting that India might be the most efficient import source for many products. Secondly, study has shown that tariffs in India are often redundant because competition between Indian producers is so intense that it forces down prices domestically, even to levels below world prices.8 The third argument may stand, however, because the sensitive lists of SAFTA members are long.
Empirical quantitative studies on regional integration in South Asia differ significantly in terms of the methodologies employed. Broadly, three types of models have been used: (i) gravity models; (ii) partial equilibrium models; and (iii) CGE models.
Gravity models have been widely used to predict the impact of RTAs on bilateral trade flows,9 and their findings have been mixed.10 Srinivasan and Canonero predicted that the impact of SAFTA on trade flows would be small for India but much larger for the smaller countries. Coulibaly found net export creation, whereas Tumbarello and Hirantha found net trade creation from the South Asian Preferential Trading Arrangement (SAPTA). On the other hand, Hassan observed net trade diversion effects from SAPTA, and Rahman (2003) found that regional integration is unlikely to generate significant trade expansion in this region. Using an augmented gravity model, Rodríguez-Delgado found that trade liberalization under SAFTA might influence regional trade flows mainly by increasing India‘s exports and both Bangladesh‘s and Nepal‘s imports.
The advantage in partial equilibrium models11 is that they are generally based on disaggregated data and are also flexible, which facilitates sector-specific study. However, they ignore general equilibrium interactions and thus cannot capture inter-sectoral effects on the economy.
8 See Pursell (2004) and World Bank (2004).
9 The gravity models basically try to explain bilateral trade flows with a set of explanatory variables, which in turn try to predict the impact of the arrangement on bilateral trade flows. Typically, the exercise involves estimating a bilateral trade-flow equation with bilateral trade (imports, exports, or total trade at the aggregate or sector level) as the dependent variable and country characteristics, such as the gross domestic products, population, distance, commonality of language or cultural ties and the existence of preferential trade arrangements, as independent variables. Once estimated, the equation can then be used to predict the impact of a union between country pairs that did not have such a union during the sample period.
10 See Srinivasan and Canonero (1995), Hassan (2001), Coulibaly (2004), Hirantha (2004), Tumbarello (2006), Rahman (2003), and Rodríguez-Delgado (2007).
11 The major partial equilibrium studies on RTA in South Asia have been Govindan (1994), DeRosa and Govindan (1995), Pursell (2004), and the World Bank (2006).
4
To explore the potential of an India–Bangladesh bilateral FTA, the World Bank (2006) provided a comparative assessment between Bangladesh and India with respect to cement, light bulbs, sugar, and readymade garments (RMGs). The partial equilibrium simulation suggested that for cement, lights bulbs, and sugar the likely effects of an FTA between Bangladesh and India were an expansion of Indian exports to Bangladesh, but no exports from Bangladesh to India. This is mainly because Indian export prices for these products are substantially lower than ex-factory, before-tax prices of the same or similar products in Bangladesh. The simulations for RMGs predicted increased Bangladeshi exports to India and also increased RMG exports from India to Bangladesh. The study found that an FTA would bring large welfare gains for consumers in Bangladesh provided there is adequate expansion of infrastructure and administrative capacity at custom borders. It, however, cautioned that the benefits of such an FTA for Bangladesh could be wiped out if it had the effect of keeping out cheaper, third-country imports (mainly from East Asia), and such trade diversion costs could be large. The study suggested that the only way to minimize trade diversion costs would be through further unilateral liberalization.
Studies based on CGE models12 predict the effects of the trading arrangement on all variables including production, consumption, and trade flows in all sectors of the economy as well as on welfare. These studies employed the Global Trade Analysis Project (GTAP) database and model, though they differ in technicalities and assumptions because of the evolution of the GTAP itself. Pigato et al. found that regional integration in South Asia would produce benefits for member nations, though unilateral trade liberalization would yield larger gains. Bandara and Yu argued that, in terms of real income, such integration would lead to gains for India and Sri Lanka, while Bangladesh would stand to lose. Raihan and Razzaque found that Bangladesh would incur a net welfare loss from SAFTA because, despite a positive trade creation effect, the negative trade diversion effect would be large enough to offset the positive gain. However, all other South Asian countries would gain from SAFTA, and as far as any individual country is concerned, India would gain the maximum.
From a trade perspective, and to forge greater regional integration in South Asia, there is a need to reduce trade costs. Despite falling tariffs, trade in South Asia has suffered because of higher trade costs. Banik and Gilbert (2008) found that for a 100 percent increase in trade costs, exports from India to neighboring Asia are expected to fall between 42 percent and 73 percent. De (2009) found that trade transport costs across South Asia are very high and vary across goods and countries. The cost of trade transport increases for landlocked countries like Nepal. Land borders in South Asia are overcrowded and need special attention to reduce time delays and transaction costs. Higher trade costs not only restrict trade but can also reduce the political will for greater regional cooperation.
Other studies show that trade facilitation reforms significantly contribute to greater regional integration in South Asia‘s intra-regional trade.13 Hertel and Mirza (2009) observed that trade facilitation plays an important role in determining patterns of global trade flows, where the relative effect on bilateral trade of improving exporters‘ border logistics is larger than improving importers‘ trade facilitation. The study also revealed that proportionate increases in intra-regional trade are larger in all countries for textile and clothing, automobiles and parts, and other manufactured goods.
South Asia is notoriously weak in facilitating trade at borders.14 The region suffers from excessive direct costs and time taken at border crossings, and inefficiencies in cross-border transactions. Trade in this region is also constrained by poor infrastructure, congestion, high costs, and lengthy delays. These problems are particularly severe at border crossings, many of which pose significant barriers to trade. De and Ghosh (2008) argued that transaction costs of India‘s exports to Bangladesh have increased despite
12 Major studies that applied the CGE model to regional integration in South Asia are Pigato et al. (1997), Bandara and Yu (2003), and Raihan and Razzaque (2007).
13 Refer, for example, Asian Development Bank (ADB)-UNCTAD (2008)
14 See, for example, De (2008a, 2008b), and De (2011).
5
simplification of documentation at borders. The paper concluded that the rent-seeking informal economy is deep-rooted and makes trade transaction expensive at borders. Sharma (2007) observed that removing such inefficiencies in trade transactions would increase welfare in the region by about US $116 million per annum as compared to a gain in income of US$ 418 million from a preferential removal of regional trade tariffs. However, it is worth noting that some smaller countries in the region gained much more from removal of transaction inefficiencies than from trade liberalization. This underscores the importance of implementing reforms in border infrastructure and logistics in tandem with other policy reforms to enhance regional integration.
Nahar and Siriwardana (2009) examined, in a CGE framework, the contribution of trade liberalization policies to household welfare and poverty in Bangladesh. They found that complete removal of tariffs favors export-oriented, labor-intensive sectors, such as RMGs and the knitting industry in Bangladesh in both the short and long term. They argued that in rural areas trade liberalization has a positive impact on poverty in the short run, and in urban areas it has helped raise poor people to the non-poor category in the long run, despite a negative impact in the short run.
3. Market Access for Trade in Goods and Selected Services
South Asia‘s ability to integrate successfully with the global economy is drawing increasing international interest. However, bilateral trade barriers present an impediment not only to access for trade in goods between countries but integration of the region as a whole. This section discusses market access issues in bilateral trade in goods, particularly for Bangladesh. It presents the pattern of Bangladesh‘s trade with other South Asian countries and applies a global general equilibrium model to explore the effects of an FTA between Bangladesh and India.
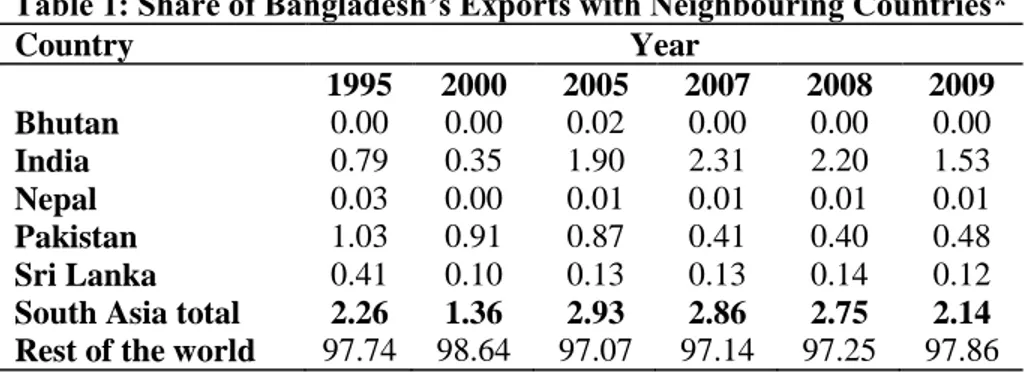
Table 1: Share of Bangladesh’s Exports with Neighbouring Countries*
Country Year
1995 2000 2005 2007 2008 2009
Bhutan 0.00 0.00 0.02 0.00 0.00 0.00
India 0.79 0.35 1.90 2.31 2.20 1.53
Nepal 0.03 0.00 0.01 0.01 0.01 0.01
Pakistan 1.03 0.91 0.87 0.41 0.40 0.48 Sri Lanka 0.41 0.10 0.13 0.13 0.14 0.12 South Asia total 2.26 1.36 2.93 2.86 2.75 2.14 Rest of the world 97.74 98.64 97.07 97.14 97.25 97.86
*As percentage of total export.
Source: Calculated based on UN COMTRADE.
3.1. Bangladesh’s Trade with Neighboring Countries
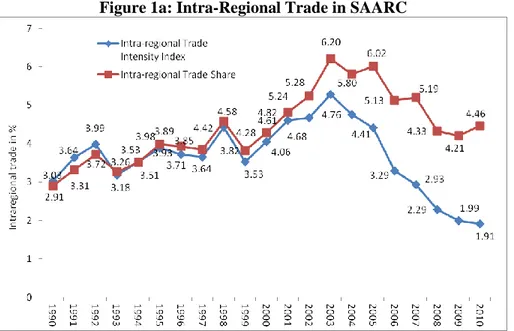
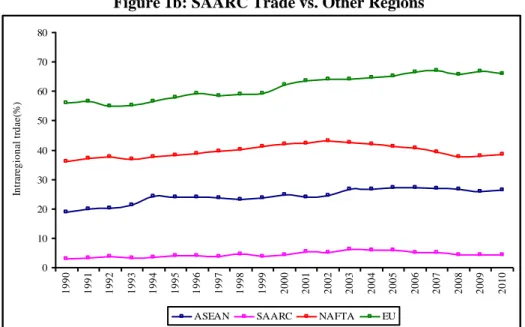
Intra-regional trade between South Asian countries has been low for decades. Prior to 1951, its share of the region‘s total trade was in double digits. By 1967, however, as South Asia became progressively more closed to the world market and political rivalry between India and Pakistan intensified, intra-regional trade fell to just 2 percent of the total. It rose through the 1990s and by 2002 had increased to 4.4 percent (Baysan et al.). It peaked at 6.21 percent in 2004 and then fell back to 4.46 percent in 2010 (Figure 1a), though this decline in intensity is attributable more to South Asia‘s increased trade with the rest of the world than to intra-regional declines.15 The region‘s outward trade may look healthy, but its internal activity, compared to other regions such as NAFTA, ASEAN, and EU, is very low (Figure 1b). South
15 During 2004 and 2008, South Asia‘s trade with the world more than doubled (from US$245 billion in 2004 to US$600 billion in 2008) and increased faster than intra-regional trade (based on IMF DOTS).
6
Asia has been an insignificant export destination for Bangladesh for many years. In 1995, its exports to South Asia were only 2.26 percent of its total. By 2009 this had declined to 2.14 percent (Table 1).
Bangladesh‘s dependence on South Asia for imports also declined, from 15.5 percent in 1995 to 12.02 percent in 2009 (Table 2).
Table 2: Share of Bangladesh’s Imports with Neighbouring Countries*
Country Year
1995 2000 2005 2007 2008 2009
Bhutan 0.13 0.03 0.00 0.00 0.00 0.00
India 11.31 6.66 10.86 11.83 13.78 10.36
Nepal 0.01 0.01 0.00 0.00 0.00 0.02
Pakistan 3.95 1.40 1.24 1.41 1.52 1.55
Sri Lanka 0.11 0.13 0.09 0.10 0.09 0.10
South Asia total 15.52 8.22 12.20 13.34 15.39 12.02 Rest of the world 84.48 91.78 87.80 86.66 84.61 87.98
*As percentage of total import.
Source: Calculated based on UN COMTRADE.
Figure 1a: Intra-Regional Trade in SAARC
Note: Intra-regional trade intensity index is the ratio of intra-regional trade share to that of world trade with the region, based on export data. An index of more than 1 indicates intra-regional trade flows larger than expected given the importance of the region in the world.16 Intra-regional trade is the percentage of intra-regional trade to total trade of the region, based on export data. A higher share indicates a higher degree of dependency on regional trade.
Source: ARIC, ADB
16 Intra-regional trade intensity index was calculated based on following:
wy wy wd wd
sw sw sd sd
X X
X
X , where s is the set of
countries in a region, d is the destination in the region, w and y represent countries in the world, and X is the bilateral flow of total exports.
7
Figure 1b: SAARC Trade vs. Other Regions
Source: Calculations based on Direction of Trade Statistics Online Database (DOTS), IMF.
Figure 2: Bangladesh Trade with India (1980–2010)
0 500 1000 1500 2000 2500 3000 3500 4000 4500
1980 1982 1984 1986 1988 1990 1992 1994 1996 1998 2000 2002 2004 2006 2008 2010
US$ million
Exports to India Imports from India
Source: IMF DOTS.
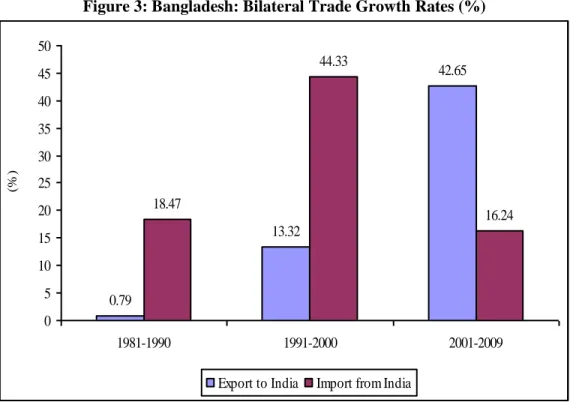
Bangladesh‘s trade with neighboring countries is unequally distributed, having little to do with Bhutan, Nepal, or Sri Lanka. India is Bangladesh‘s primary trading partner, followed by Pakistan. Bangladesh has a high deficit in its trade with India––having risen from US$ 44 million to US$ 2.5 billion from 1981- 2009 (Figure 2).17 The ten years from 2000-2009 have seen the fastest rise in Bangladesh‘s exports to India (42.65 percent per annum growth), while Bangladesh‘s import growth from India declined to 16.24 percent per annum (Figure 3). Nevertheless, Bangladesh exports are only 1 percent of India‘s total imports and the range of products is small, mostly fertilizers and jute products. RMGs are Bangladesh‘s major exports, but the share going to India is very small, at least so far.
17 From a macroeconomic point of view, the issue is whether the current account deficit is sustainable, and this has not been a concern because Bangladesh has had consistent trade surpluses with trading partners like the US and EU, and has also enjoyed surpluses on its invisibles account.
0 10 20 30 40 50 60 70 80
1990 1991 1992 1993 1994 1995 1996 1997 1998 1999 2000 2001 2002 2003 2004 2005 2006 2007 2008 2009 2010
Intraregional trdae(%)
ASEAN SAARC NAFTA EU
8
Figure 3: Bangladesh: Bilateral Trade Growth Rates (%)
0.79
13.32
42.65
18.47
44.33
16.24
0 5 10 15 20 25 30 35 40 45 50
1981-1990 1991-2000 2001-2009
(%)
Export to India Import from India Source: Calculated based on IMF DOTS.
3.2. Trade Complementarity and Intra-Industry Trade
The trade complementarity index (TCI) indicates whether trade is likely to grow between countries.
Research indicates that trade complementarity between India and Bangladesh is relatively limited, although it has grown.18 The TCI at the disaggregated level (6-digit HS) for 2002 and 2007 offers mixed results for the two countries (Table 3). Bangladesh had a higher trade complementarity than India in both years,19 though Bangladesh‘s decreased and India‘s increased. The scale of trade is driving the complementarity. Hence, although India‘s TCI score is lower, the number of commonly traded products is far higher, so India fulfills a larger proportion of Bangladesh‘s import demands; similarly, Bangladesh‘s higher TCI score for fewer traded products indicates a smaller trade creation potential with the existing basket of goods. The TCI scores do indicate, however, that bilateral trade between India and Bangladesh has the potential to grow, since trade in similar product lines has grown. This will deepen production networks between the two countries.
The scope for production networks and vertical trade between the two countries can be judged by the intensity of intra-industry trade (IIT) at the disaggregated (6-digit HS) level. IIT occurs when a country simultaneously imports and exports similar types of products within an industry or sector. There are two types of IITs––horizontal and vertical.20 IIT has been described also as a measure of the degree to which
18 In some of the literature, it is observed that the lack of complementarity and high degree of competition in export structures imply daunting prospects for expanding regional trade in South Asia. Refer, for example, Pitigala (2005).
19 The TCI measures the degree to which the export pattern of one country matches the import pattern of another.
A high degree of complementarity is assumed to indicate more favourable prospects for a successful trade arrangement. The index lies on the range 0–100, with 100 indicating perfect complementarity. The latest period for Bangladesh trade data in UN Comtrade and other comparable sources was 2007. Before calculating TCI, data coordinates at HS nomenclature H2 were matched for both the countries for both years. For further details on TCI, refer Mikic and Gilbert (2007, p. 72).
20 Greenaway et al. (1995).
9
trade in a particular sector is based on scale economies and/or market structure.21 By engaging in IIT, a country can reduce the number of similar goods it produces and benefit from scale economies. Higher IIT ratios suggest that these sources of gains are being exploited. The IIT index measures the degree of overlap between imports and exports in the same commodity category, with a value of 1 indicating pure intra-industry trade and a value of 0 indicating pure inter-industry trade.22
Table 3: Trade Complementarity Index (TCI) at 6-digit HS Reporter
(Exporter)
Partner (Importer)
TCI (%) Number of Commonly Traded Products
(2002) (2007) (2002) (2007)
Bangladesh India 42.0 39.3 1,057 1,752
India Bangladesh 27.1 32.2 4,256 4,270
Source: Calculated based on UN COMTRADE.
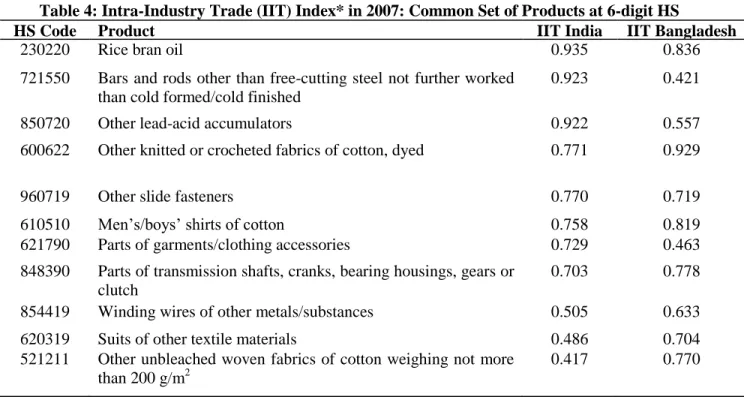
Table 4: Intra-Industry Trade (IIT) Index* in 2007: Common Set of Products at 6-digit HS
HS Code Product IIT India IIT Bangladesh
230220 Rice bran oil 0.935 0.836
721550 Bars and rods other than free-cutting steel not further worked than cold formed/cold finished
0.923 0.421
850720 Other lead-acid accumulators 0.922 0.557
600622 Other knitted or crocheted fabrics of cotton, dyed 0.771 0.929
960719 Other slide fasteners 0.770 0.719
610510 Men‘s/boys‘ shirts of cotton 0.758 0.819
621790 Parts of garments/clothing accessories 0.729 0.463
848390 Parts of transmission shafts, cranks, bearing housings, gears or clutch
0.703 0.778
854419 Winding wires of other metals/substances 0.505 0.633
620319 Suits of other textile materials 0.486 0.704
521211 Other unbleached woven fabrics of cotton weighing not more than 200 g/m2
0.417 0.770
*IIT index was calculated for bilateral trade between India and Bangladesh.
Source: Calculations based on UN COMTRADE.
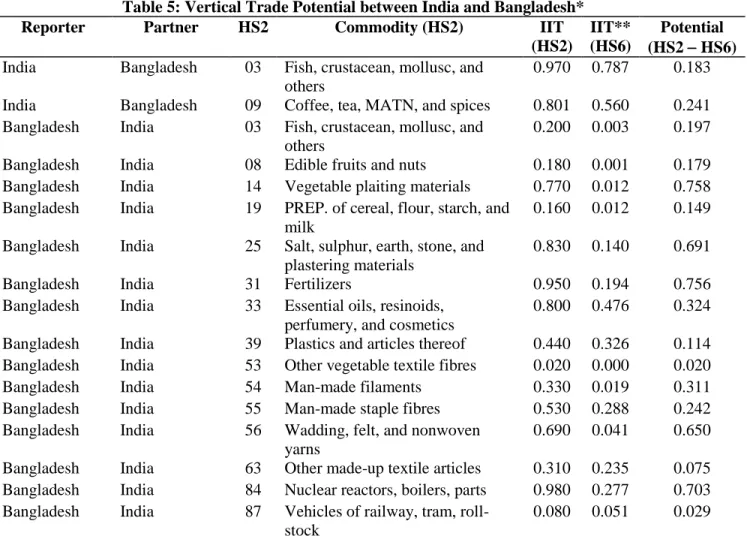
To identify the vertical IIT, the indices at a high disaggregated level (HS 6) are compared with those at a low disaggregated level (HS 2). IIT indices that are low at HS 6 and high at HS 2 are a necessary, although not sufficient, condition for the existence of vertical trade because they suggest that the countries trade different products in the same sector.23 Examination of the common set of traded goods between
21 Horizontal IIT refers to the simultaneous exports and imports of goods classified in the same sector and at the same stage of processing, usually based on product differentiation. Vertical IIT refers to the simultaneous exports and imports of goods classified in the same sector but at different stages of processing, usually based on the ―fragmentation‖ of the production process into different stages, each performed at different locations and taking advantage of the local conditions. See, for example, Sodersten and Reed (1994).
22 Before calculating IIT, data coordinates at HS nomenclature H2 were matched for both countries. The traditional way to measure the degree of intra-industry trade is the Grubel-Lloyd Index (G-L Index). For further details, refer to Mikic and Gilbert (2007, p. 76).
23 The authors are grateful to the referee for asking to carry this particular comparison. However, the usual caveat is that there might be aggregation bias. When the IIT index is observed to be low at HS6 but high at HS2, one
10
India and Bangladesh (Table 4) and the estimated IIT indices for major products for both partners (Appendix 1), brings the following to light:
Table 5: Vertical Trade Potential between India and Bangladesh*
Reporter Partner HS2 Commodity (HS2) IIT
(HS2)
IIT**
(HS6)
Potential (HS2 HS6) India Bangladesh 03 Fish, crustacean, mollusc, and
others
0.970 0.787 0.183 India Bangladesh 09 Coffee, tea, MATN, and spices 0.801 0.560 0.241 Bangladesh India 03 Fish, crustacean, mollusc, and
others
0.200 0.003 0.197
Bangladesh India 08 Edible fruits and nuts 0.180 0.001 0.179
Bangladesh India 14 Vegetable plaiting materials 0.770 0.012 0.758 Bangladesh India 19 PREP. of cereal, flour, starch, and
milk
0.160 0.012 0.149 Bangladesh India 25 Salt, sulphur, earth, stone, and
plastering materials
0.830 0.140 0.691
Bangladesh India 31 Fertilizers 0.950 0.194 0.756
Bangladesh India 33 Essential oils, resinoids, perfumery, and cosmetics
0.800 0.476 0.324 Bangladesh India 39 Plastics and articles thereof 0.440 0.326 0.114 Bangladesh India 53 Other vegetable textile fibres 0.020 0.000 0.020
Bangladesh India 54 Man-made filaments 0.330 0.019 0.311
Bangladesh India 55 Man-made staple fibres 0.530 0.288 0.242
Bangladesh India 56 Wadding, felt, and nonwoven yarns
0.690 0.041 0.650 Bangladesh India 63 Other made-up textile articles 0.310 0.235 0.075 Bangladesh India 84 Nuclear reactors, boilers, parts 0.980 0.277 0.703 Bangladesh India 87 Vehicles of railway, tram, roll-
stock
0.080 0.051 0.029
*IIT indices are calculated for bilateral trade between India and Bangladesh at H2 nomenclature.
**Average of multiple products at HS6.
Source: Calculations based on UN COMTRADE.
1. The IIT index levels are higher in manufactured products than in primary products, reflecting the greater role of economies of scale in the production of manufactures.
2. IIT index scores suggest there are production-sharing opportunities, in a static sense, in 11 products, with varying potential. The range of this potential varies from textile and clothing (highest concentration) to iron and steel (lowest concentration). Electrical machinery and equipment and mechanical appliances occupy the middle portion of the value chain, with mid- level concentrations. The estimated results in Table 5 support this.
3. Only two sectors for India and Bangladesh had IIT shares in the moderate range: textiles and clothing, and electrical machinery and mechanical appliances. All other sectors had low or negligible IIT shares.
How, then, to intensify vertical IIT between the two countries? Sectors with increasing shares of IIT and high economies of scale are most likely to have bilateral trade growth potential. To realize that potential, should check on a case-by-case basis whether the different products are differentiated as final products or as parts and components versus final products.
11
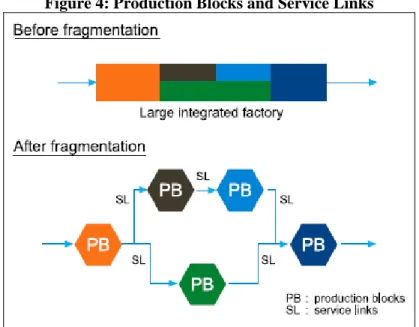
both countries need to further liberalize trade: reduce tariffs (largely in the case of imports into Bangladesh), remove non-tariff barriers, reduce trade costs by improving trade facilitation at borders and then inland. It has been argued that by driving down real trade costs and trade and transport logistics barriers, India and Bangladesh may realize the potential of higher production-sharing arrangements.24 The World Bank has stated that the drivers of such trade go beyond relative factor endowments to factors such as complementary use of information and communication technologies and natural geographies (clustering, agglomeration, and scale effects).25 Kimura and Kobayashi argue that according to fragmentation theory, the key to attracting fragmented production blocks is to improve the advantages of location by, for example, developing special economic zones (SEZs) with at least an improved local-level investment climate, and to reduce the cost of service links that connect remotely located production blocks by improving trade and transport facilitation (see Figure 4 that illustrates the link between improved service links and strengthening of production networks).
Figure 4: Production Blocks and Service Links
Source: Kimura and Kobayashi (2009).
Table 6: Number of South Asian Students in Indian Universities
Country Year
1991–92 1995–96 2001–02 2005–06 2007–08
Afghanistan 125 118 33 70 976
Bangladesh 565 1244 545 345 368
Bhutan 112 155 254 365 487
Maldives 18 23 14 42 264
Nepal 725 695 873 1252 1821
Pakistan 12 4 3 4 8
Sri Lanka 487 363 504 431 997
South Asia 2044 2602 2226 2909 4965
Source: Association of Indian Universities (AIU), New Delhi.
24 See World Bank (2010, 2012).
25 Manufacturing production sharing (or vertical specialization) is a key characteristic in East Asia‘s regional integration and export dynamism. See, for example, Yeats (2008), Kimura (2006), Ando (2007), and Kimura and Kobayashi (2009).
12
3.3. Trade in Services in Education and Health Sectors between Bangladesh and India
A large part of services trade between India and Bangladesh is informal. There has been a small, formal flow of trade in education and health-related services between the two countries but, generally, barriers inhibit this bilateral trade. Barriers to trade in services are not like tariffs; they are typically regulatory, rather than explicit taxes. The barriers between the two countries are complex and have been taxing such trade for years. For example, trade in higher education services––in which Bangladeshi students pursue higher education in India––has fallen at a time when the number of foreign students studying in India has increased strongly overall (Table 6).26
Capacity and quality constraints in Bangladeshi institutions encourage students to pursue higher education in India and elsewhere. Generally, consumption abroad (mode 2, students moving abroad to study), is assumed to be the most frequently-used mode by which education services are traded between India and Bangladesh. However, a host of problems prevent the two countries opening up their facilities, raising standards, recognizing each other‘s standards (mutual recognition), and removing barriers to education services trade. The Bangladesh government has unilaterally allowed foreign direct investment (FDI) through joint ventures in educational services. But Indian educational institutions (except those in information technology) are yet to open branches under mode 3 (commercial presence) in Bangladesh.
With the setting up of the South Asian University (SAU) in India, the flow of Bangladeshi students in higher education might rise. The flow presently is unidirectional, to India, and at least some observers believe that there is substantial informal trade in the sector.27 Both countries need to remove the barriers prohibiting formal movement of students, by issuing hassle-free and long-term multiple-entry visas. The Bangladesh government could facilitate Indian universities and institutions to set up branches in major cities in Bangladesh, with free interaction between faculties of Bangladeshi and Indian universities (say, under mode 4), thereby encouraging inter-personal contact between the two countries. The prime ministerial meeting in Bangladesh in September 2011 brought about some progress in this regard. The two leaders agreed to promote trade in services under the SAARC agreement and directed early completion of work to harmonize the education curricula and mutually recognize degrees in the two countries.28
Health services trade consists mainly of patients crossing borders. However, South Asian countries face a host of obstacles to opening up health services, recognizing each other‘s standards, and removing barriers to health-care trade. Bangladeshi patients visit India for treatment every year, largely because of a paucity of quality domestic health infrastructure.29 At the same time, the informal trade in health services is huge and unaccounted for. Consumption abroad (mode 2) is known to be the most popular mode of trade in health services between the two countries, but the number of Bangladeshi patients travelling to India in this mode is unknown.30
26 Due to the absence of mode-wise trade in higher education between the two countries, in value terms, it is difficult to pinpoint the actual flow of higher education services in either direction.
27 According to Rahman (2002), a considerable number of Bangladeshi students studying in India use Indian identities.
28 See the joint statement issued after the visit of the Indian Prime Minister to Bangladesh on September 7, 2011.
29 Refer, Raychaudhuri and De (2012). Rahman (2002) states that about 57 percent of Bangladeshi patients seeking treatment abroad in 1999 went to India, and most chose India because of the unavailability of medical facilities in Bangladesh and because the Indian medical services are better.
30 Rahman (2002) estimated that about 50,000 Bangladeshi patients were treated in India in 1999, through which India earned about US$30 million.
13
Several barriers are responsible for the rise in the informal trade in health services between the two countries.31 A 2010 survey of patients‘ perceptions about barriers to accessing Indian health services showed a high proportion of similar complaints, from visa issues to medical insurance limitations and high air fare costs (Table 7). To reduce the barriers: (i) the Bangladesh government could allow Indian medical institutions to set up hospitals under mode 3 (India‘s Apollo Group has set up a hospital in a joint venture at Dhaka, but it is too small to meet local demand32); (ii) professionals in health services could be allowed to move freely (under mode 4) between the two countries; and (iii) genuine patients from Bangladesh coming to India for treatment could be granted visas on arrival at Indian land ports or airports. Although both governments have agreed to facilitate the granting of long-term, multiple-entry visas to research scholars and students, and people visiting on medical grounds, the progress on the ground has been slower than what has been targeted.
Table 7: Perceptions of Bangladeshi Patients* about Indian Health Services
Particulars Percentage of
Patients (%)
Complicated visa 77.90
Fraud of informal foreign exchange traders 40.00 Lack of pan-South Asia medical insurance 80.00
High airfare 64.70
*Sample size: 190 patients.
Source: Banik et al. (2010).
3.4. Scenario Analysis with the Global Computable General Equilibrium (CGE) Model
The global CGE modeling framework of the GTAP uses aggregated data on regions and commodities for its objectives.33 Version 7 is used here, covering 57 commodities, 113 countries/regions, and 5 factors of production––although for purposes of this study the 113 countries/regions are aggregated to 6.34
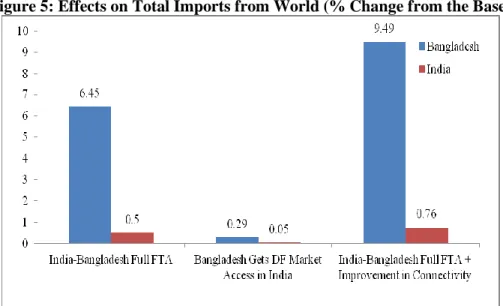
Three scenarios are considered: (i) a full FTA for goods between Bangladesh and India, (ii) India‘s unilateral duty-free, quota-free (DFQF) offer to Bangladesh, and (iii) a full FTA for goods and improved connectivity (FTA plus). To capture the improvement in connectivity, a 25 percent drop in the bilateral trade-cost margin between Bangladesh and India is simulated.
An FTA-plus–improved-connectivity option clearly would have the greatest impact on world imports to both countries (Figure 5). In both FTA-only and FTA-plus scenarios, Bangladesh‘s imports would rise more than India‘s because India is Bangladesh‘s primary source and Bangladesh is an insignificant source for India. With the DFQF option, imports into Bangladesh would increase by only 0.29 percent, since Bangladesh would not liberalize its trade regime. With regard to exports (Figure 6), it is notable that Bangladesh‘s increase would be higher with the FTA-only scenario than the DFQF option. This is because the FTA would increase access to cheaper raw materials through tariff liberalization, which would not occur in the DFQF scenario. However, exports from Bangladesh would rise most in the FTA-
31 Rahman (2002) found that about 20 percent of the approximately 50,000 Bangladeshis that chose to go to India for treatment in 1999 went without the right visas: in most cases, patients chose tourist visas to avoid the more arduous medical visa process.
32 Another new Apollo Group hospital is being established in Chittagong.
33 See Appendix 2 for explanation of the GTAP model. This study uses the Version 7 database, with 2004 as base. This has been adjusted with some pre-simulations to reflect the base year as close to 2010 as possible.
34 See Appendices 3 and 4.
14
plus scenario––by 10.96 percent. India‘s small 0.21 percent rise is due to the fact that its export base is already large and exports to Bangladesh are a small part of global exports.
Figure 5: Effects on Total Imports from World (% Change from the Base)
Source: GTAP simulation results.
Figure 6: Effects on Total Exports to World (% Change from the Base)
Source: GTAP simulation results.
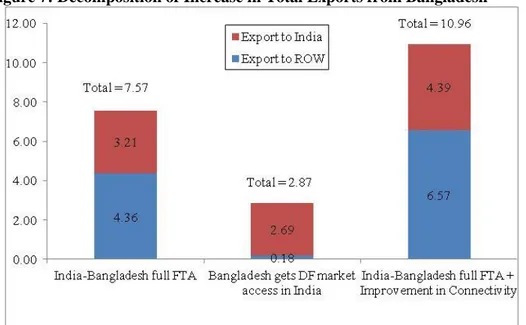
In a decomposition of the increase in exports for Bangladesh (Figure 7), it appears that of the 7.57 percent increase under an FTA-only option, 3.21 percent would be due to the increase in exports to India; the remaining 4.36 percent increase would go to the rest of the world. In the DFQF scenario, most of the 2.87 percent increase (2.69 percent) would go to India. In the third scenario, a full FTA-plus-improved- connectivity, a little less than half of the 10.96 percent increase in total exports from Bangladesh, or 4.39 percent, would be due to the increase in exports to India.
Under all these scenarios, Bangladesh’s exports to India increase significantly in percentage terms.
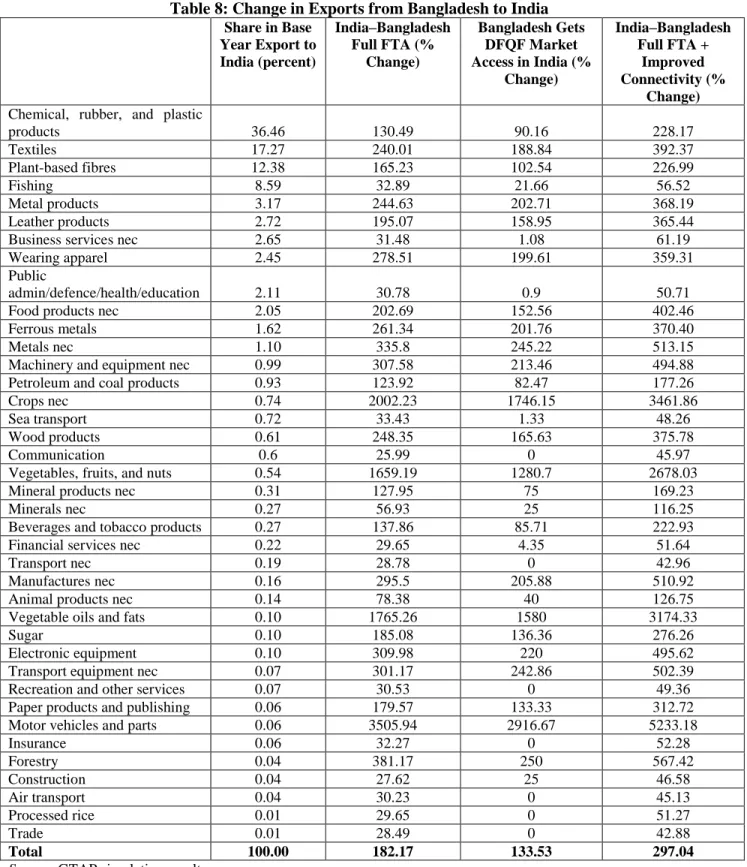
The next step is to separate out the bilateral component of the overall increase in exports. Under the FTA- only scenario, total exports to India would increase by nearly 182 percent (Table 8). Three categories of products, namely––chemicals, rubber & plastic, textiles, and plant-based fibers (jute)––account for 66
15
percent of Bangladesh‘s total exports to India. Under a full bilateral FTA, exports to India of these three products would rise by 130 percent, 240 percent, and 165 percent. Export of other products, too, would rise significantly. In the DFQF scenario, exports to India increase by 134 percent, but the FTA-plus scenario offers a 297 percent rise in exports to India. So, reducing transaction costs in trade seems to have a significant stimulatory effect on exports.
Figure 7: Decomposition of Increase in Total Exports from Bangladesh
Source: GTAP simulation results.
India‘s exports to Bangladesh also increase significantly (Table 9). An FTA-only option would raise India‘s exports to Bangladesh by about 126 percent. The leading export item (i.e., textiles) would jump by 259 percent, and exports of processed rice, and chemicals, rubber & plastics would also rise strongly. A DFQF offers negligible benefits (since the offer is from India), but a full FTA-plus-improved connectivity would boost Indian exports to Bangladesh the most, by 172 percent.
3.4.1. Removal of India’s Negative List and Its Impact on Bangladesh’s Export to India
The above analysis has become relevant since there have been developments in market access offers from India. Ahead of the state visit of Indian Prime Minister Manmohan Singh to Bangladesh in September 2011, India removed all 46 textile lines affecting Bangladesh from its negative list in SAFTA‘s provisions for least-developed countries (LDCs), thereby zero-rating the duty on those items.35 With further tariff concessions and removal of items from India‘s negative list just before the 2011 SAARC Summit, Bangladesh to India exports are now close to free-trade, except for about 25 items (mostly tobacco and liquor).
To analyze the impact of this action on the Bangladesh-India trade scenario, the change in weighted tariff has been calculated for each of the GTAP sectors,36 and three scenarios simulated, in all of which India gives Bangladesh zero-duty market access: (i) with no sensitive list (i.e., the DFQF scenario above), (ii) keeping India‘s old sensitive list of 480 products for LDCs, and (iii) keeping India‘s sensitive list of 46 products for LDCs.37 Change in exports has been calculated in each of these scenarios with reference to the base.
35 Refer to the joint statement for the visit of the Prime Minister of India to Bangladesh on September 7, 2011.
36 In the GTAP model there are 57 sectors. However, the sensitive lists are provided at the 6-digit HS code.
37 The list of 46 negative-list items appears in Appendix 5.
16
Table 8: Change in Exports from Bangladesh to India Share in Base
Year Export to India (percent)
India–Bangladesh Full FTA (%
Change)
Bangladesh Gets DFQF Market Access in India (%
Change)
India–Bangladesh Full FTA +
Improved Connectivity (%
Change) Chemical, rubber, and plastic
products 36.46 130.49 90.16 228.17
Textiles 17.27 240.01 188.84 392.37
Plant-based fibres 12.38 165.23 102.54 226.99
Fishing 8.59 32.89 21.66 56.52
Metal products 3.17 244.63 202.71 368.19
Leather products 2.72 195.07 158.95 365.44
Business services nec 2.65 31.48 1.08 61.19
Wearing apparel 2.45 278.51 199.61 359.31
Public
admin/defence/health/education 2.11 30.78 0.9 50.71
Food products nec 2.05 202.69 152.56 402.46
Ferrous metals 1.62 261.34 201.76 370.40
Metals nec 1.10 335.8 245.22 513.15
Machinery and equipment nec 0.99 307.58 213.46 494.88
Petroleum and coal products 0.93 123.92 82.47 177.26
Crops nec 0.74 2002.23 1746.15 3461.86
Sea transport 0.72 33.43 1.33 48.26
Wood products 0.61 248.35 165.63 375.78
Communication 0.6 25.99 0 45.97
Vegetables, fruits, and nuts 0.54 1659.19 1280.7 2678.03
Mineral products nec 0.31 127.95 75 169.23
Minerals nec 0.27 56.93 25 116.25
Beverages and tobacco products 0.27 137.86 85.71 222.93
Financial services nec 0.22 29.65 4.35 51.64
Transport nec 0.19 28.78 0 42.96
Manufactures nec 0.16 295.5 205.88 510.92
Animal products nec 0.14 78.38 40 126.75
Vegetable oils and fats 0.10 1765.26 1580 3174.33
Sugar 0.10 185.08 136.36 276.26
Electronic equipment 0.10 309.98 220 495.62
Transport equipment nec 0.07 301.17 242.86 502.39
Recreation and other services 0.07 30.53 0 49.36
Paper products and publishing 0.06 179.57 133.33 312.72
Motor vehicles and parts 0.06 3505.94 2916.67 5233.18
Insurance 0.06 32.27 0 52.28
Forestry 0.04 381.17 250 567.42
Construction 0.04 27.62 25 46.58
Air transport 0.04 30.23 0 45.13
Processed rice 0.01 29.65 0 51.27
Trade 0.01 28.49 0 42.88
Total 100.00 182.17 133.53 297.04
Source: GTAP simulation results.