On the Impact of Incentives in Organizations - Experimental Studies on Compensation, Team Production, and Performance Feedback
Inauguraldissertation zur Erlangung des Doktorgrades der Wirtschafts- und Sozialwissenschaftlichen Fakultät der
Universität zu Köln
2006
vorgelegt von
Diplom-Volkswirtin Kathrin Pokorny
aus Mülheim an der Ruhr
Referent: Prof. Dr. Dirk Sliwka
Korreferent: Prof. Dr. Axel Ockenfels
Tag der Promotion: 15.01.2007
Acknowledgements
Financial support by the Deutsche Forschungsgemeinschaft DFG (IR 43/1-1 and KR 2077/2-3) is gratefully acknowledged.
I am deeply grateful to my …rst supervisor Dirk Sliwka, for his continuous support, encouragement, advice, and humor which made life at the seminar a great experience.
I thank Axel Ockenfels for agreeing to be my second supervisor and the opportunity to use the resources at the Cologne Laboratory for Economic Research. I also thank his sta¤ for their support.
I thank Alwine Mohnen not only for being my coauthor and colleague but also for being a very good friend.
I thank my dear colleagues, the ‘boys’ René Fahr, Patrick Kampkötter, Tom McKenzie, and Matthias Wibral and the ‘girls’Petra Hagemann, Chris- tine Harbring, and Petra Nieken for their open eyes and ears, substantial help in various ways and for being such a good company. I also thank Beate Om- mer for looking after all of us.
I thank Anastasia Danilov, Evgenji Pechimenko, Verena Scherer, and the whole PWL student sta¤ for their nerves and patience when dealing with me and my experiments.
I am deeply indebted to my parents for providing me with all necessary
…nancial and emotional assets and for bearing my constant moaning.
I thank my brother Andi and my sister Tine that I can always rely on their critics to be honest.
I thank all members of the Manthei-Müske-Vogel-Clan and Achim and Melanie Pokorny for sharing the thrills and troubles with me and for keeping
…ngers crossed.
I thank ‘Gruppe Mülheim’for keeping me from working too much on the weekends.
Finally, I thank my husband Daniel who at least su¤ered as much as I
did for this thesis...and probably even more.
Contents
1 Introduction 5
2 Piece Rates and Performance
110
2.1 Introduction . . . 10
2.2 The Real E¤ort Experiment . . . 13
2.2.1 Experimental Set-up and Procedures . . . 13
2.2.2 Hypotheses . . . 15
2.2.3 Results . . . 16
2.2.4 Discussion . . . 21
2.3 An Alternative Theory . . . 23
2.3.1 Incentives and Reference Dependent Preferences . . . . 23
2.3.2 The Model . . . 24
2.4 Concluding Remarks . . . 28
2.5 Appendix to Chapter 2 . . . 31
3 The Role of the Fixed Wage in Setting Incentives
237 3.1 Introduction . . . 37
3.2 The Model . . . 40
3.3 Experimental Design and Procedures . . . 43
3.4 Hypotheses . . . 44
3.5 Results . . . 45
3.6 Interpretation . . . 49
3.7 Conclusion . . . 51
1
This chapter is based on Pokorny (forthcoming).
2
This chapter is based on Mohnen and Pokorny (2006a).
3.8 Appendix to Chapter 3 . . . 53
4 The Impact of Transparency in Team Production
356 4.1 Introduction . . . 56
4.2 The Model . . . 59
4.2.1 Intransparency . . . 61
4.2.2 Transparency . . . 64
4.2.3 A Comparison of both Settings . . . 66
4.3 Experimental Evidence . . . 68
4.3.1 Experimental Design and Procedures . . . 68
4.3.2 Hypotheses . . . 69
4.3.3 Results . . . 70
4.4 Discussion . . . 76
4.5 Appendix to Chapter 4 . . . 79
5 Performance Feedback and the Role of Honesty
485 5.1 Introduction . . . 85
5.2 Theory . . . 89
5.2.1 Model Set-up . . . 89
5.2.2 Theoretical Results . . . 92
5.3 Experimental Design and Procedures . . . 96
5.4 Hypotheses . . . 98
5.5 Empirical Findings . . . 99
5.5.1 Descriptive Results . . . 99
5.5.2 The Existence of Costs of Lying . . . 101
5.5.3 Does Deception Increase with Higher Returns? . . . 107
5.5.4 Long Term Relationships . . . 109
5.5.5 More Honesty and Trust in Long Term Relationships? . 110 5.5.6 Is More Honesty Pro…table and if so, for Whom? . . . 114
5.6 Summary and Discussion . . . 116
5.7 Appendix to Chapter 5 . . . 118
3
This chapter is based on Mohnen et al. (2006).
4
This chapter is based on Mohnen and Pokorny (2006b).
Chapter 1 Introduction
Most of economics can be summarized in four words:
‘People respond to incentives’. The rest is commentary.
[Landsburg (1995) p. 3 ]
This citation of Landsburg shows that people’s reactions to incentives constitute one of the most important characteristics of economic theory which goes along with a very speci…c idea of man. This typical homo economicus acts egoistically such that he always seeks to maximize his own utility. Under the assumption that people behave purely sel…shly the implementation of optimal (monetary) incentives seems to be a relevant question not only in politics or social life but also in organizations.
This thesis is concerned with the impact of monetary incentives in …rms.
This issue has attracted a lot of attention in recent decades. Not only the- oretical (for seminal papers see e.g. Holmström (1979), Grossman and Hart (1983), Hart and Holmström (1987)) but also empirical researchers (e.g.
Paarsch and Shearer (1999), Lazear (2000), Shearer (2004)) have made a
huge e¤ort in exploring the optimal contract design and its actual e¤ects
on e¤ort exertion. For this purpose the relationship between employer and
employee and the resulting divergence of interests has been analyzed. How-
ever, more recently several empirical papers have provided evidence that the
image of the homo economicus is all too simple and does not display all hu-
man traits which are important in practice. In particular the positive e¤ect
of incentives could not always be con…rmed (e.g. Gneezy and Rustichini (2000a), Heyman and Ariely (2004), Fehr and Gächter (2002)). These de- viating …ndings cannot be explained by standard economic theory alone as they represent psychological rather than economic aspects of decision mak- ing. Among the …rst to add psychological elements to standard neoclassic preferences were Geanakoplos et al. (1989) or Rabin (1993), who tried to increase the explanatory power of the economic theory.
The main objective of this thesis is to investigate whether a particular action taken by the employer indeed triggers the desired behavior of the em- ployee and what motivational mechanisms underlie the employee’s behavior when it does not. Each of the subsequent chapters deals with a speci…c as- pect of the incentive problems that arise in organizations. These research questions are analyzed theoretically and experimentally.
Chapters 2 and 3 investigate the impact of di¤erent compensation schemes
on the e¤ort decision. One of the most intuitive and therefore widespread
types of incentives is the introduction of performance-dependent compen-
sation in the form of a piece rate. In Chapter 2 we examine the impact
of varying piece rates on work performance in an economic experiment. If
people react according to the standard homo economicus higher piece rates
should ceteris paribus lead to higher e¤ort levels. We use two simple real
e¤ort tasks to check the validity of this hypothesis. However, we do not …nd
a monotonically increasing relationship between performance and strength of
incentives but an inversely U-shaped pattern. This contrasts not only with
standard economic theory but also with observations in a previous real e¤ort
experiment presented in Gneezy and Rustichini (2000a). To give a possible
explanation for our …ndings we develop a simple theoretical model including
reference dependency and loss aversion into the employee’s preferences. This
approach captures the idea of individuals who do not only consider their
absolute monetary payo¤s but evaluate them compared to reference wage
and was …rst established by Kahneman and Tversky (1979). In case of refer-
ence dependent and loss averse agents there is a non-monotonic relationship
between incentives and performance and therefore high powered incentives
might even lead to decreasing e¤ort levels.
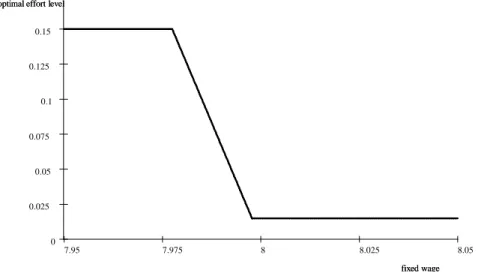
However, if reference dependency and loss aversion are general traits of human preferences and hence in‡uence individual decision making, the …xed part of the compensation also plays a crucial role in setting optimal incen- tives. This is especially important considering that the …xed base salary often constitutes a large part of the total compensation (see e.g. Murphy (1999)).
Although simple principal agent models would lead us to predict that the
…xed wage does not a¤ect the employee’s optimal e¤ort choice, the model including reference dependency and loss aversion demonstrates a weakly de- creasing relationship between the height of the …xed wage and employee performance. In contrast to this recent economic experiments in particular those exploring the gift exchange game have been able to show that indi- viduals exert e¤ort above the theoretically optimal level for increasing …xed wages despite the absence of any incentives (see e.g. Berg et al. (1995), Fehr et al. (1993), Gächter and Falk (2002)).
In Chapter 3 we develop alternative hypotheses on this question and in- vestigate actual human behavior where we again use a real e¤ort task. For this purpose we rewarded all participants with the same performance de- pendent piece rate but exposed them to three di¤erently high …xed wages.
Surprisingly, we observe the highest e¤ort levels with the low and the high
…xed wage. The worst performance, however, is provided under an inter- mediate …xed wage. This outcome can neither be explained by standard preferences nor by reference dependency and loss aversion alone. As social preferences and social norms have been shown to have an important e¤ect on individual decision making (e.g. Fehr and Schmidt (1999), Bolton and Ock- enfels (2000), Charness and Rabin (2002), Engelmann and Strobel (2004)), we argue that it is likely that subjects in the experiment were also led by a social norm demanding a certain e¤ort level with a very high …xed wage.
Social norms seem to play an important role in particular when people interact with each other. Chapters 4 and 5 therefore deal with incentive problems with social interaction. In team production fairness considerations often refer to the colleagues or team mates.
In Chapter 4 we use this idea to provide an explanation for the peer
pressure phenomenon which has been shown to increase individual contribu-
tions in team production. For this purpose we develop a two-period model in which the two team members are inequity averse regarding their noisy contributions. We …nd that the e¤ect of inequity aversion strongly depends on the informational setting. For hidden contributions the agents act as if they were purely sel…sh. However, when contributions are made transparent at an interim stage the agents adjust their second period e¤ort levels accord- ing to the intermediate information they received. That is the agent with higher past contribution will decrease his future contribution and vice versa in order to counterbalance the di¤erence between each other. Anticipating this adaption the agents exert higher e¤ort in the …rst period to increase the counterpart’s e¤ort adjustment in the second. This form of peer pressure leads to a reduction in free-riding and thus to more e¢ cient outcomes.
Similar to the previous chapters we check the theoretical results in a real e¤ort experiment observing strong evidence for the conclusion that trans- parency indeed leads to a considerable e¤ort adjustment such that inequity in contributions is reduced. Yet, the team mates’absolute e¤ort adjustments do not seem to be equal irrespective of whether a subject contributed more or less than his counterpart in the previous period. Instead we …nd asymmetric adjustments which are higher for subjects who have taken the lead in the preceding period and lower for those having made lower contributions. Still, the results show that obviously the occurrence of a social norm together with transparent conditions leads to higher aggregate outputs.
Setting incentives in employer-employee relationships is often very sensi- tive to the agent’s productivity or ability. A standard assumption in economic theory is that the agent has better information on his own ability than the principal. One of the most famous solutions to this asymmetry in informa- tion is job market signaling (see Spence (1973)). But, if an agent joins a …rm directly after leaving university or changes to a new job it also seems pos- sible that the principal or supervisor has a better perception of the agent’s actual ability for the speci…c tasks corresponding to the job. If this is the case the agent might be interested in the information the principal has when considering which e¤ort level to exert.
In Chapter 5 we theoretically and experimentally examine a situation in
which the principal has better information about the agent’s ability than the agent himself does. The principal can inform the agent about his ability by giving him performance feedback but there might be incentives for her to lie about it. Analyzing a simple signaling model yields the following main results: The principal tells the truth if there are su¢ ciently high costs of lying. When the principal’s marginal returns on the agent’s e¤ort increases, deception is more likely to occur.
We observed ambiguity, however, when testing these theoretical results in a lab experiment with abstract e¤ort choices. On one hand, the data provide evidence implying that subjects indeed su¤er from costs of lying in this context. On the other hand, we do not …nd more deception with higher marginal returns on the agent’s e¤ort for the principal. Instead we observe exactly the opposite pattern: higher marginal returns on the agents’ e¤ort lead to more honest principals. This might again be induced by reference dependent preferences and loss aversion or the impact of a social norm.
The results of the four experiments presented in this thesis demonstrate that standard assumptions on the individual’s preferences often do not suf-
…ce to explain human behavior. However, when setting incentives the right
anticipation of the agent’s reaction is critical for their success. Hence, the
development of alternative theories integrating more human motives than
just the maximization of one’s own absolute utility seems to be important.
Chapter 2
Piece Rates and Performance 1
2.1 Introduction
The question of optimal incentive schemes in principal agent relationships with hidden action has been the object of research for many years. A well- established result of most standard hidden action models is that higher in- centives ceteris paribus lead to higher performance. Field studies and exper- iments present evidence for this conclusion (e.g. Lazear (2000); Paarsch and Shearer (1999); Dickinson (1999)).
Still standard results are controversial. Several experimental studies in economics were recently able to show what psychologists have already been claiming for some time namely, that the introduction of incentives does not inevitably stimulate higher e¤ort choices. Moreover, cases exist where intro- ducing an incentive contract even reduces e¤ort. This phenomenon emerges in real e¤ort experiments (Gneezy and Rustichini (2000a); Gneezy and Rusti- chini (2000b); Heyman and Ariely (2004)) as well as in experiments including abstract e¤ort choices (e.g. Fehr and Gächter (2002); Irlenbusch and Sliwka (2003)).
2’
3A frequently cited key concept explaining certain anomalies is motivation
1
This chapter is based on Pokorny (forthcoming).
2
For an overview see Frey and Jegen (2001).
3
Examining the willingness of citizens to accept a nuclear waste repository in their
neighborhood, Frey and Oberholzer-Gee (1997) …nd a similar e¤ect in the …eld of politics.
crowding out (e.g. Frey (1997)). In this framework two types of motivation are speci…ed, namely intrinsic and extrinsic motivation.
4The core of the the- ory in this context is that implementing a performance dependent compensa- tion scheme might strengthen extrinsic incentives while diminishing intrinsic motivation. As a consequence the e¤ect of introducing a variable compensa- tion is ambiguous. Recently economists tried to include these considerations into economic models (e.g. Bénabou and Tirole (2003); Frey (1997)). Bén- abou and Tirole (2003) interpret incentives o¤ered by the principal as a signal of task attractiveness or di¢ culty. In their model the principal has perfect information on the actual attractiveness of the task but the agent only ob- serves an imperfect signal on it. If the actual attractiveness of the task is low the principal fears that the agent receives a low signal of task attractiveness and therefore ensures performance by o¤ering higher extrinsic rewards. That way Bénabou and Tirole (2003) show that higher rewards may diminish the agent’s performance as they represent the principal’s pessimistic information on task attractiveness. Frey (1997) introduces a simple principal agent model including intrinsic motivation where the agent’s utility increases in wage and decreases in e¤ort. If the principal implements stronger incentives the im- pact of the intervention on the agent’s e¤ort choice is not clear. Frey (1997) distinguishes three e¤ects caused by the principal’s intervention namely a price e¤ect, an enhancing e¤ect and a crowding out e¤ect. The price e¤ect simply denotes the e¤ect of higher opportunity costs of lower e¤ort levels.
Representing a positive perception of the principal’s intervention the enhanc- ing e¤ect ampli…es the impact of the price e¤ect. In turn the crowding out e¤ect refers to a negative assessment of the increase in incentives producing lower e¤ort choices. Still, the net e¤ect is hardly predictable since price and enhancing e¤ect point in the same direction, while the crowding out e¤ect a¤ects the opposite. Particularly it seems feasible that for lower interven- tions the crowding out e¤ect dominates the price e¤ect resulting in reduced e¤ort whereas higher interventions cause increasing e¤ort choices due to the
4
Intrinsic motivation denotes an inner drive to do things (e.g. pleasure) while extrinsic
motivation describes a behavior driven by rewards outside the individual. The idea of
intrinsic motivation was …rst introduced by Deci (1971) and DeCharms (1968).
prevailing in‡uence of the price e¤ect.
However, the concept of intrinsic motivation is disputed among psychol- ogists as psychological meta studies present ambiguous results (e.g. Eisen- berger and Cameron (1996); Deci et al. (1999a); Deci et al. (1999b)).
5Fur- thermore, in experiments with abstract e¤ort choices motivation crowding theory fails to provide sensible explanations, as there is no task stimulating intrinsic motivation.
Another part of the related literature examining the relationship between incentives and performance indicates the relevance of reference dependent preferences (e.g. Fehr and Götte (2005); Camerer et al. (1997)). Fehr and Götte (2005) …nd decreasing e¤ort choices with stronger incentives if the reference income has been exceeded. In that case higher piece rates have a diminishing impact on work e¤ort.
This chapter investigates the in‡uence of varying piece rates on work performance. For this purpose we conducted a real e¤ort experiment at the Universities of Bonn and Cologne. Real e¤ort conditions were chosen to pre- vent subjects from restraining on income distribution and more importantly to generate real disutility from higher e¤ort levels. The design of the experi- ment has been inspired by a real e¤ort experiment conducted by Gneezy and Rustichini (2000a) who investigated the in‡uence of varying piece rates on e¤ort for an IQ test task. In one condition subjects were paid a participation fee only while subjects in the other three conditions were paid di¤erent piece rates for every correct answer in addition to the participation fee. Gneezy and Rustichini (2000a) …nd a V-shaped relationship between e¤ort and in- tensity of incentives. Their main result is that subjects in the condition without any incentives outperformed those who were paid a very low piece rate. Moreover, the results indicate that higher piece rates lead to higher e¤ort when only conditions with positive piece rates are considered. Accord- ing to Frey (1997)’s motivation crowding theory one might argue that for the low incentive group the crowding out e¤ect dominated the price e¤ect while for the higher incentive condition the price e¤ect prevailed. As another ap-
5
For a good overview on the literature on intrinsic motivation see Kunz and Pfa¤
(2002).
proach Gneezy and Rustichini (2000a) o¤er an explanation stating that the
…xed wage group thought the work on the IQ test to be part of the contract concluded with the experimenters. Introducing the variable compensation completed the contract with regard to the meaning of the …xed wage as a show-up fee.
To test the e¤ect of di¤erent strengths of incentives on the subjects’per- formance we introduced four di¤erent compensation schemes and two tasks.
The …rst task we used was an IQ test to check whether the Gneezy and Rus- tichini (2000a) results were robust for our design. Hence, these conditions are closely related to theirs. As motivation crowding out might be a reason for the failure of incentives the second objective of this chapter is to explore how far characteristics of the tasks in‡uence the e¤ect of incentives on the subjects’ e¤ort. Since the type of task might be important with regard to the ability of stimulating intrinsic motivation we introduced a counting task in addition to an IQ test. In the counting task conditions the subjects were asked to count the frequency of a particular number in blocks of random numbers which was di¤erent with respect to some features. First it did not consist of various exercises but only one task and second it required a lot of concentration. Thus, we are able to compare performance for two tasks with putative di¤erent ability of stimulating intrinsic motivation.
For the IQ test task we …nd two main e¤ects: (1) Very low incentives induce higher performance than o¤ering no incentives. (2) High piece rates reduce performance compared to very low incentives. So the data indicate an inversely U-shaped relationship between e¤ort levels and incentive inten- sity contrasting Gneezy and Rustichini (2000a). The data of the counting task merely show the latter e¤ect of lower e¤ort levels with high powered incentives. In order to explain the experimental results we develop a simple principal agent model accounting for the agent’s loss aversion.
The remainder of this chapter is structured as follows: Section 2.2 de- scribes the experimental design and procedures and develops hypotheses on the results. Furthermore the results are presented and discussed. In Section 2.3 the model including reference dependency is introduced and developed.
The last section concludes.
2.2 The Real E¤ort Experiment
2.2.1 Experimental Set-up and Procedures
We conducted eight di¤erent conditions with two di¤erent tasks and four dif- ferent compensation schemes. The …rst task was comparable with the Gneezy and Rustichini (2000a) IQ test (IQ) consisting of 48 exercises extracted from a book for logical training. No special skills were necessary to answer these questions. With the other task (CN) participants were required to count the number of ‘ones’ and ‘sevens’ out of 24 blocks of random numbers put together by a computer program.
6For both tasks the maximum number of points that could be achieved was 48.
All participants were told that they would always get 5e as a participation fee. The participants who were assigned to the …rst compensation scheme received the participation fee only (no incentive = NI). The other groups earned 0:01e (very low incentive = VLI), 0:05e (low incentive = LI), and 0:5e (high incentive = HI) respectively for each point scored in addition to the show-up fee.
7The subjects who worked on the IQ task received a point for every correct answer but 0:5 points were subtracted for any incorrect answer.
8In the CN task an answer was valued correct if it corresponded to the correct number of
‘ones’and ‘sevens’respectively with a deviation of one. If the exact number of ‘ones’in a block was for example 30, subjects who counted 29, 30; or 31
‘ones’received one point.
After all individuals had entered the room they were requested to sit down on seats marked with a pen and paper. After everybody had sat down the supervisors handed out the exercises. Each of them was covered with a sheet with the instructions printed on.
9The subjects had 30 minutes to work on the task. After exactly 30 minutes a bell rang and the supervisors handed out forms and asked the subjects to …ll in their answers. Additionally
6
For examples of both tasks see appendix.
7
1e was about 1$ at the time of the …rst sessions of the experiment.
8
That was to prevent subjects from guessing which seemed to be necessary as there were several multiple-choice questions.
9
For a translated version of the instructions see appendix.
a questionnaire was …xed to the form. The participants were granted another 5 minutes to copy the answers into the form and complete the questionnaire.
The questionnaire included several questions such as gender, age, years of study etc. The phase in which the subject answered the questionnaire was critical for the success of the experiment. Subjects might have continued working on the tasks rather than answering the questions and therefore attain higher scores. We discuss this problem again in the results chapter. The supervisors collected the forms and informed the subjects when and where they were requested to come to receive their payment. The whole procedure took about 45 minutes.
We conducted three experimental sessions. The …rst one took place in November 2002 at the University of Bonn. The two other sessions were run at the University of Cologne in July 2003 and October 2005 respectively.
10In total 267 of the universities’undergraduate students of various disciplines participated in the experiment. The remuneration was paid out about one week after each session.
112.2.2 Hypotheses
According to standard theoretical predictions, participants of conditions with higher incentives exhibit higher performance. Those participants who receive the …xed wage are expected to exert the lowest e¤ort level. The monotonically increasing relation between strength of incentives and e¤ort can be expressed by
Hypothesis 1:
e
N I< e
V LI< e
LI< e
HIwhere e denotes the e¤ort level under the respective compensation scheme.
Considering motivation crowding theory things appear di¤erent. Due to the
10
In the sessions in November 2002 and July 2003 we conducted the NI, LI and HI conditions. The VLI session took place in October 2005. For this session we used the online recruitment software ORSEE developed in Greiner (2003). We thank an anonymous referee for the suggestion to conduct a condition with a very low piece rate.
11
In each session there were a few participants who did not come to collect their payment.
No Very low Low High incentive incentive incentive incentive
Mean 16:6 21:8 18:7 16:4
Median 17:5 20:5 19:5 15:5
Stand. dev. 8:2 9:6 9:2 9:8
Table 2.1: Descriptive statistics IQ task
multitude of di¤erent e¤ects a precise prediction is di¢ cult to make. Assum- ing that for small interventions the crowding out e¤ect dominates the price e¤ect but for high interventions the price e¤ect dominates the crowding out e¤ect we might observe a non-monotonic relation. That is, participants in the VLI condition should perform worse than those in the NI condition. Par- ticipants in the HI condition in turn should yield higher scores than those in the VLI and LI conditions. As the IQ conditions resemble the Gneezy and Rustichini (2000a) experiment a similar e¤ect might be expected i.e. sub- jects in the …xed wage condition and in the high incentive condition exert signi…cantly more e¤ort than the very low (and low) incentive group.
Hyptothesis 2:
e
N I> e
V LI< e
LI< e
HI:
Due to the monotony of the CN task di¤erent observations are likely because compared to the IQ its potential to stimulate intrinsic motivation or work pleasure may be lower. Thus, a monotonically increasing relation between wage and e¤ort according to Hypothesis 1 could be expected with these conditions.
2.2.3 Results
For the analysis of the results we use higher point scorings to approximate
higher e¤ort choices. First we look at the performance data of subjects who
participated in the IQ test. The descriptive statistics are presented in Table
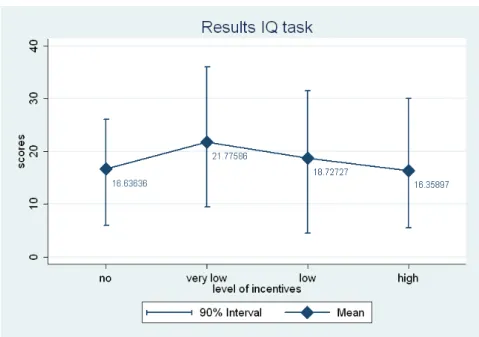
2.1. The means are illustrated in Figure 2.1 where ninety percent of the scores
Figure 2.1: Mean scores IQ task
lie within the interval presented along the vertical lines.
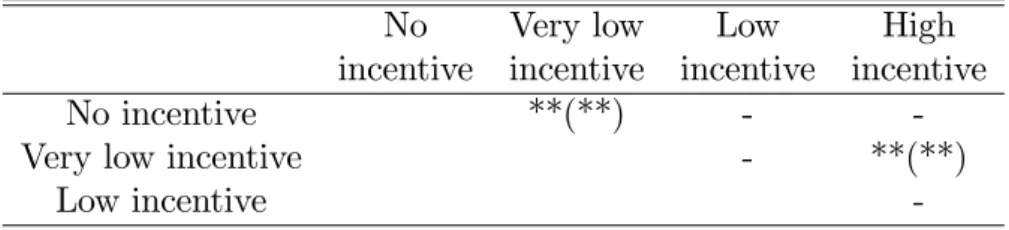
12The descriptive statistics show that subjects in the VLI condition yield the best results. For both no incentives and high incentives the e¤orts levels are almost equally low. All in all, Figure 2.1 depicts an inversely U-shaped relation between strengths of incentives and IQ test scores. In order to check whether the performance di¤erences are signi…cant we ran a pairwise comparison using a two-sided t-test. The results are displayed in Table 2.2.
13Indeed, subjects who are o¤ered very low incentives perform signi…cantly better than those in the NI and the HI conditions. This provides evidence for a positive e¤ect of very low piece rates on work e¤ort in this context. The di¤erence between e¤orts under very low incentives and low incentives is not signi…cant at any conventional level.
Obviously, the performance increase between the no incentives and very low incentives groups contrasts the Gneezy and Rustichini (2000a) …ndings.
Hence, we cannot con…rm that a very low piece rate causes lower e¤ort levels
12
The entire distribution of the data is reported in Table 2.6 in the appendix.
13
We additionally ran all comparisons using a non-parametric Mann-Whitney-U-test.
The results are shown in Table 2.7 in the appendix.
No Very low Low High incentive incentive incentive incentive
No incentive **(**) - -
Very low incentive - **(**)
Low incentive -
**signi…cant at 5%, * signi…cant at 10%; - not signi…cant Results of one-sided test in parentheses
Table 2.2: Results t-test IQ task
No Very low Low High
incentive incentive incentive incentive
Mean 25.5 26.4 25.3 22.4
Median 25 25 26 22
Stand. dev. 10.3 9 8.3 7.3
Table 2.3: Descriptive statistics CN task
compared to a …xed wage. In addition, Gneezy and Rustichini (2000a) …nd increasing scores with higher incentives if they have once been introduced.
However, subjects in the HI condition provided signi…cantly less e¤ort. So our results do not only contrast standard theoretical predictions but also the Gneezy and Rustichini (2000a) results as we observe the opposite behavioral pattern
e
N I< e
V LI> e
LI> e
HI:
Therefore, the IQ task data do neither provide evidence for standard theory
expressed in Hypothesis 1 nor for an undermining e¤ect of incentives of the
form described in Hypothesis 2. Let us now consider the data of the counting
task. The descriptive statistics are presented in Table 2.3 and seem to be
qualitatively similar to the IQ task but less pronounced. Again the subjects
in the VLI condition show the highest mean scores. Figure 2.2 illustrates the
inversely U-shaped relation between level of piece rate and e¤ort exertion for
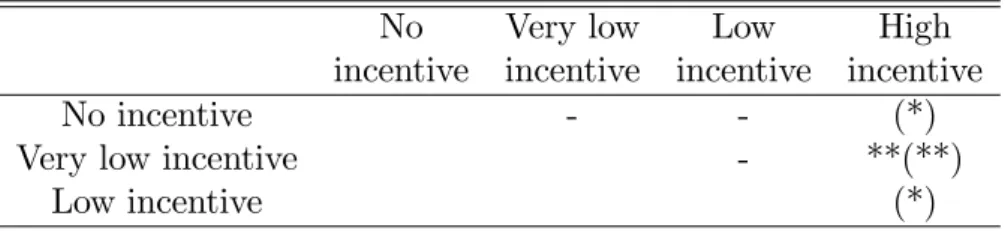
the CN task. However, running a pairwise comparison between conditions
we only …nd signi…cant di¤erences between the high incentive condition and
the other three conditions (see Table 2.4). Again, we neither …nd evidence
Figure 2.2: Mean scores CN task
for standard theory nor con…rmation for the Gneezy and Rustichini (2000a)
…ndings. In turn, the important discovery within the CN data seems to be the decrease in e¤ort with a high rate of variable compensation. Table 2.4 shows a signi…cantly negative in‡uence of the high incentive scheme on point scorings which is line with the e¤ect of high piece rates we observe with the IQ task.
Still, there are two issues which limit the interpretation of the data. First, during the phase in which the subjects were granted time to complete the questionnaire they might have continued working on the task instead of an- swering all of our questions. If they did so this might distort the results.
The second issue is that individual performance data do not only de-
pend on e¤ort but might be in‡uenced by several unobserved factors such
as ability to solve the tasks, the subjects’expectation about the own ability
to solve the task and more importantly risk aversion for which we cannot
control here. However, we have some demographic data we can use to run a
robustness check on the results. Therefore we take the subjects’age (‘age’)
and the number of semesters spent at university (‘semesters’) so far into a
No Very low Low High incentive incentive incentive incentive
No incentive - - (*)
Very low incentive - **(**)
Low incentive (*)
**signi…cant at 5%, * signi…cant at 10%; - not signi…cant Results of one-sided test in parentheses
Table 2.4: Results t-test CN task
simple regression. We also include the squares of these variables (‘age
2’and
‘semesters
2’) to check for the impact of great deviations. In order to control for the task and the compensation scheme we include dummy variables ‘no incentive’ for subjects in the NI conditions, ‘low incentive’ for those in the LI conditions, ‘high incentive’for the HI conditions and ‘IQ test’for the IQ test task. Participants in the very low incentive condition serve as a refer- ence group here. Note that subjects who did not complete the questionnaire are not included in this estimation (since we do not have their demographic data). The results of the analysis are presented in Table 2.5. The analysis demonstrates that none of the control variables has a measurable in‡uence on the point scorings. However, even when controlling for age and semesters spent at university we observe signi…cant poorer performance of participants in the no incentives condition. Moreover subjects in the high incentive con- dition yield signi…cantly 6:2 points less than those in the very low incentive condition. Hence, we can consider the outcomes as being robust with regard to the control variables. Apart from that we …nd that even when we extract the performance data of the subjects from the sample who did not …nish completing the questionnaire this does not alter the outcomes qualitatively.
2.2.4 Discussion
Considering the results described above we obtain two main results. First,
for the IQ task subjects receiving the …xed wage only (NI) perform worse
than those being paid a very low (VLI) piece rate in addition. This con-
tradicts the Gneezy and Rustichini (2000a) results but seems to be in line
Number of point scorings No incentive -3.469**
(1.72) High incentive -6.196***
(1.71)
Low incentive -2.687
(1.73)
IQ test -5.731***
(1.18)
Age -0.452
(1.09)
Age
20.00333
(0.020)
Semesters 0.748
(0.58)
Semesters
2-0.0678
(0.041)
Constant 35.35**
(14.3)
Observations 237
R
20.17
Standard errors in parentheses
*** p < 0.01, ** p < 0.05, * p < 0.1
Table 2.5: Results OLS regression
with standard theory predicting higher e¤ort with stronger incentives. The second major …nding is the signi…cant decrease in point scorings with high powered incentives which occurs for both tasks. A possible interpretation of this result might be an increasing crowding out e¤ect with increasing strength of incentives. That is, the stronger the extrinsic incentive the more intrin- sic motivation is crowded out causing reduced e¤ort choices. However, this theory cannot explain the poor results of the NI group since this group’s per- formance should be better than the VLI group’s. Another explanation might be a growing error rate with increasing incentives. Intuitively one might argue that participants feel excited imagining a very high possible income.
Therefore the implementation of a high piece rate might stimulate very high e¤ort in quantity resulting in worse quality of performance and consequently more mistakes. In that case a rather high e¤ort in quantity would cause the worse results of the HI group compared to the VLI group. Surprisingly, the data do not con…rm this conjecture. For both tasks there are no signi…cant di¤erences between numbers of errors between these conditions if we use a two-sided t-test.
14Therefore this explanation cannot be robustly con…rmed.
However, for us the most convincing interpretation seems to be a theory of reference dependent preferences meaning that the subjects had a certain reference income in mind when participating in the experiment. At the Uni- versities of Bonn and Cologne experiments are run regularly. It is a common habit for students to participate and earn extra money. It is well known that participation in experiments is remunerated with an average of approx- imately 10e although we did not explicitly mention this.
15Still, we might roughly guess what the subjects had expected to earn. Note that this was not the case the session in Cologne in July 2003. By that time no permanent laboratory had been established yet and hence students were not familiar with taking part in economic experiments. Therefore subjects had to be recruited from undergraduate courses by reporting the average wage in the experiment of about 10e. This value refers to the average of earnings over
14
If we apply a one-sided t-test we …nd a weakly signi…cant increase in errors for the IQ task in HI condition compared to the VLI condition.
15
This is an average value. Of course this value varies within the experiments depending
on the role the participant plays. In ordinary jobs students earn about 10 to 15e.
all conditions. So in that case it was possible to in‡uence the participants’
expectations and generate a reference level arti…cially.
Due to the design of the experiment it was not possible to earn 10e for the NI group since their payment was 5e independent of their performance.
Participants in the VLI (LI) group could earn a maximum wage of 5:48e (7:40e) being less than the average of 10e. Still reaching this maximum income was very unlikely since the average number of points actually reached was much lower than the maximum.
16So it can be assumed that members of the VLI and the LI group knew from the start that they would have to work hard and concentrated to get close to their reference wage. In contrast to that the HI group could reach the level of 10e by attaining few points only.
17Consequently the VLI (LI) group had to work a lot harder than the HI group and maybe did so to get closer to the reference wage.
2.3 An Alternative Theory
2.3.1 Incentives and Reference Dependent Preferences
None of the theories discussed above can explain the surprising outcomes of the experiment. For that reason a di¤erent type of theory has to be estab- lished. This section tries to o¤er one possible explanation for the experimen- tal results with a simple model including reference dependent preferences.
The assumption of a reference level of compensation seems to be straight- forward, since people might not only use their actual wage level to eval- uate their utility but take a reference level (e.g. an expected wage or a rival’s/workmate’s wage) into account.
The relevance of reference points has been the object of research in many
…elds. Among the …rst, introducing the concept of reference points are Kah- neman and Tversky (1979) analyzing decisions under uncertainty. They de- velop a model describing loss aversion by designing a utility function includ- ing a reference point. This utility function has a convex slope below the
16
None of the subjects scored the maximum number of points in any condition.
17
In the HI group subjects could earn up to a maximum of 29e.
reference point. It changes at the reference point and develops a concave slope. Hence subjects behave risk seeking below the reference point and risk averse beyond it. Evidence for the relevance of the theory was found early in many experiments (e.g. MacCrimmon and Larsson (1979)). Investigat- ing the e¤ect of loss aversion under risk-less choice Tversky and Kahneman (1991) extent the application of reference dependent utility. Easterlin (2001) examines the relation between happiness and income. Although he …nds a positive relationship between income and happiness, income growth does not a¤ect lifetime happiness since according to his theory aspirations grow with increasing income. Thus, the reference point, from which happiness is eval- uated, changes. There are some empirical studies explaining their …ndings with loss aversion. Fehr and Götte (2005) …nd reduced e¤ort with higher wages in a …eld experiment on the work habits of bicycle messengers. The messengers worked more days a month but decreased their shifts per work- ing day that is reduced e¤ort. On the other hand Oettinger (1999) does not
…nd comparable e¤ects analyzing data of stadium vendors’ work participa- tion decisions. He points out that participation is signi…cantly higher if the expected wage can be assumed to be higher on the respective date of the game. Still, Oettinger (1999) does not observe any explicit e¤ort levels. In a study on New York Cab Drivers Camerer et al. (1997) report decreasing numbers of working hours among Cab Drivers on high wage days. A recent experimental paper …nding lower e¤ort levels with higher variable wages for several real e¤ort tasks is Ariely et al. (2005).
2.3.2 The Model
In this approach the assumption is made that people’s utility does not only
refer to the absolute height but rather to the relative height of monetary
compensations. Beyond the reference point any further income growths rel-
atively lose value. It follows that compared to the standard case less or no
additional e¤ort is rational after reaching the reference level, as costs would
exceed utility gains from wage. The reference wage is de…ned as a point
from where wages are evaluated. This might be a wage the agent expects
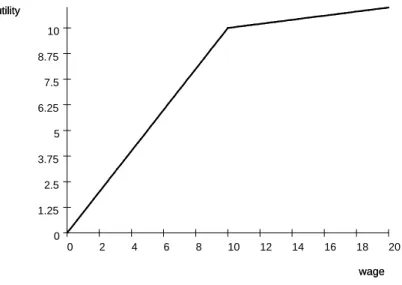
or perceives to be appropriate for a certain task. The utility function in- creases linear in wage but ‡attens as a reference wage is reached. Thus, utility increases slower if wages exceed the reference point.
Since the model described in this section is supposed to be a theoretical approach to explain the experimental results we do not calculate the optimal incentive scheme. We rather take a wage contract comparable to those in the experiment.
Assume a utility function, which is additive-separable of the form:
U(w; e) = v(w) c(e);
where w represents wage and e denotes the agent’s exerted e¤ort. As shown
20 18 16 14 12 10 8 6 4 2 0 10 8.75 7.5 6.25 5 3.75 2.5 1.25 0
wage utility
wage utility
Figure 2.3: Returns on wage
in Figure 2.3 the slope of the utility function is discontinuous at value R v(w) =
( w if w < R
R + (w R)s if w R (2.1)
with 0 s < 1:
The value R represents the reference wage from which the agent evaluates
the actual wage.
18Since s is strictly less than 1, marginal utility from w is smaller above the reference point than below. Assessing the situation from the reference point R the agent is in a loss situation if the …rst inequality is met because she stays below it. If the second inequality is met she is in a win situation. As the agent is work-averse, e¤ort exertion is costly. Costs c(e) are convex in e with c
0(e) > 0, c
00(e) > 0, c (0) = 0 and lim
e!1
c
0(e) = 1 . Furthermore let the wage contract be linear in e with a …xed wage :
w = + e:
The crucial question is for which value of e the agent changes from the left to the right side of the utility function. That is exactly the e¤ort level where the agent earns a wage equal to the reference income. Let us call this decisive value the critical e
e
R= R
: (2.2)
The optimal choice of e¤ort is determined by the …rst order condition of the agent’s objective function.
19The …rst derivative of the corresponding objective function yields
U
0(e) =
( c
0(e) if e < e
Rs c
0(e) if e e
R: This consideration leads to three possible cases.
18
Note, that the advantage of this utility function is that it is a very simple way to include loss aversion and reference dependency. In addition it enables us to precisely determine the reference point.
19
Due to the concavity of the objective function the …rst order condition is necessary
and su¢ cient for a maximum.
Proposition 1 For given values of and the agent’s optimal e¤ort level e is:
e = 8 >
> >
<
> >
> :
c
0 1( ) if < c
0(
R) R if
1sc
0(
R) c
0(
R):
c
0 1(s ) if s > c
0(
R)
(2.3)
Proof: See Appendix.
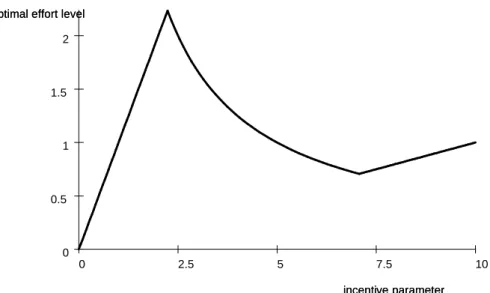
For low values of the employee’s optimal e¤ort choice is located to the left of the critical value. The e¤ort level is located exactly on the critical value for an intermediate . The third row presents the employee’s e¤ort de- cision for su¢ ciently high values of where the e¤ort choice is located to the right of the kink. The change of e in the incentive parameter is presented in Figure 2.4. Figure 2.4 shows that there is an area where the optimal ef- fort level chosen by the agent decreases in the incentive parameter. In this area the agent always chooses e = e
R. Since e
Rdecreases in we …nd a downwards sloping curve in this interval. Consequently, from the principal’s point of view increasing piece rates in this area are counterproductive not only because they are costly but also because they even reduce the agent’s performance. However, our model is subject to some limitations which de- serve mention. The behavioral predictions strongly depend on the reference wage. Obviously a reference wage is an individual’s private information and hence not directly measurable. Furthermore, the reference income might vary between individuals or groups of individuals or over time. Assuming di¤erent reference wages for di¤erent agents seems to be more realistic but exacerbates predictions. The model also lacks any insights into the origin and dynamics of reference points although this might be a critical issue to make more general predictions.
Note that the model would lead us to predict a performance increase between the NI and the VLI groups. As we merely …nd a signi…cant increase for the IQ task, our data do not completely con…rm the predictions of the model.
2020
Another issue is that in our experiment the subjects exerted positive e¤ort even if paid
10 7.5
5 2.5
0 2
1.5
1
0.5
0
incentive parameter optimal effort level
incentive parameter optimal effort level
Figure 2.4: Optimal e¤ort level
Naturally the choice of parameters drives the model. Therefore parame- ters ; R; s and the shape of the cost function determine whether the model generates the experimental results. Moreover, the conditions, under which this model can explain the phenomenon that occurred in the experiment, are very speci…c, assuming rather precise wage expectations. Still it might be a
…rst attempt to explain the special situation in which some experiments take place.
2.4 Concluding Remarks
In this chapter the relation between incentives and e¤ort choices has been investigated. Our results indicate two main e¤ects: With the IQ test task subjects who were exposed to very low incentives exerted more e¤ort than those who only earned a …xed wage. This is in contrast with Gneezy and
independent of their performance (NI group). In our model this can only be rational if we generalize the cost function, so that costs c
0(e) are convex in e with c
00(e) > 0, c(0) = 0 and lim
e!1
c
0(e) = 1 with minimum costs for a strictly positive e¤ort level.
Rustichini (2000a) observing the opposite behavioral pattern. Secondly, with both tasks the experimental results demonstrate that e¤ort does not neces- sarily increase with increasing incentives. Instead the opposite was the case in the experiment, as higher incentives led to lower performance. Since standard theory and motivation crowding theory fail to give a convincing explanation for these results a model including reference dependent utility is applied.
It remains an open question why the outcome was not similar to Gneezy and Rustichini (2000a), not even with the IQ task. Crowding out seems to be a very sensitive …nding which is inherently obvious following the psychological literature on crowding out e¤ects (see e.g. Eisenberger and Cameron (1996);
Deci et al. (1999a); Deci et al. (1999b)). It would be interesting to learn under which conditions these e¤ects are likely to appear since they might dependent on several factors such as task, composition of wages and most importantly the subjects’individual perception of the situation. Those factors might have an essential in‡uence on the impact of incentives and should be subject to further research.
Another interesting observation is that the in‡uence of speci…c task fea- tures seems to be (at least for our tasks) negligible since the outcome is qualitatively similar. A reason for that could possibly be that the di¤erences between the tasks were too small to produce a measurable e¤ect. The hy- pothesis of the IQ task generating more intrinsic motivation than the CN task cannot be con…rmed. Neither the IQ task nor the CN task created a result, which can be interpreted as crowding out of intrinsic motivation.
Nevertheless it is not understood that di¤erent tasks trigger o¤ the same behavior. Still, the in‡uence of task features cannot be resolved with these experiments.
The vital conclusion of the experiment described in this chapter is not
that incentives do not work. Moreover, the implication should be that incen-
tives might work if the agent’s income is below her reference point. Beyond
this point however incentives may fail to provide higher performance. Still,
further evidence is necessary to con…rm the hypothesis that participants,
who were exposed to a higher variable pay, were quickly pleased with their
wage. For this purpose it would be interesting to check whether subjects
reduce their e¤ort once they reached a certain wage level i.e. the reference wage. Unfortunately we did not observe any temporal variation in the data since we explicitly allowed subjects to switch the order of the exercises. That makes it impossible to draw any corresponding conclusions. Another option of gathering evidence for the relevance of reference points might be question- ing the subjects directly (in advance to and/or after the session) what their expectations regarding the wage are. These possibilities should be considered for future research.
It remains the problematical question what practical implications can ac-
tually be derived from the experiment, since it only admits suppositions on
the participants’motives. Yet, the individual wage expectations seem to be
important information required to provide optimal incentives. For this pur-
pose, further examinations of the emergence, development and measurement
of reference points are necessary.
2.5 Appendix to Chapter 2
This is the …rst page of the CN task translated from German Please count the number of ones and sevens
Block 1
0 1 8 5 8 7 0 4 2 4 5 7 0 8 2 4 8 5 7 4 5 8 2 1 6 2 7 6 4 4 3 8 5 2 3 9 7 9 9 3 5 5 6 0 7 1 7 5 3 0 9 6 0 6 3 3 8 5 7 9 6 4 7 6 3 2 2 4 5 8 7 7 5 1 4 2 8 7 6 6 5 3 4 9 8 3 3 0 9 8 2 8 2 6 0 4 7 6 2 0 0 2 5 3 4 5 5 4 7 4 1 1 6 0 2 5 4 3 0 0 4 4 3 1 1 9 2 5 2 4 3 5 4 3 9 8 4 0 2 7 0 8 7 0 5 3 4 3 1 1 3 4 9 8 2 6 3 3 8 2 0 9 3 4 0 0 4 5 5 5 8 9 5 5 0 1 6 4 8 6 2 6 9 0 5 8 8 5 2 1 9 5 0 1 5 3 1 7 0 3 2 4 9 6 2 4 9 7 8 3 8 6 0 5 5 2 9 9 2 3 6 6 8 1 6 3 2 3 5 6 1 4 9 3 4 4 2 1 5 1 9 4 9 3 4 3 3 2 3 0 8 5 7 5 3 7 7 4 0 3 8 3 8 3 7 2 7 7 4 3 8 0 7 2 9 2 2 2 5 4 3 8 5 7 6 6 5 8 7 7 0 0 1 8 3 7 2 0 0 4 9 8 8 6 3 9 7 5 1 5 2 2 6 8 4 8 7 6 3 9 4 9 6 0 3 7 2 6 1 5 0 8 5 2 9 1 1 9 6 7 6 6 3 8 4 3 9 7 2 3 9 8 5 3 9 8 3 2 1 9
Number of ones: 24
Number of sevens: 34
Block 2
8 5 2 6 4 0 5 4 7 9 2 8 6 3 7 2 0 6 5 3 7 2 9 1 1 1 7 8 4 7 6 3 9 8 0 7 8 0 5 7 9 8 1 6 2 1 3 5 9 2 6 5 6 2 7 3 1 9 3 4 0 6 9 4 3 5 6 6 3 8 4 1 2 1 0 3 4 6 9 7 3 9 1 6 7 6 2 1 9 9 1 5 3 3 3 4 0 7 3 3 6 6 0 8 6 9 0 6 6 9 2 0 1 4 6 5 2 4 7 1 5 5 2 7 4 7 9 3 6 5 0 6 8 5 3 9 4 9 8 2 7 1 6 5 9 1 1 4 8 0 0 4 6 7 9 8 5 8 6 5 4 0 4 9 9 7 8 8 9 5 1 9 1 4 8 6 7 8 0 8 0 1 1 5 2 1 0 6 4 9 5 3 0 2 1 1 6 3 2 7 3 6 7 1 8 6 8 2 7 8 1 7 5 6 9 3 6 3 3 5 0 5 4 4 1 8 2 9 0 7 2 2 6 8 4 4 3 9 6 5 0 9 5 2 6 7 0 2 0 3 7 6 9 6 4 4 5 9 0 3 1 5 3 1 9 4 9 7 5 2 7 4 3 5 3 7 5 8 4 1 6 9 5 0 0 0 8 6 6 0 3 9 2 0 3 6 2 2 2 3 8 7 2 3 1 1 0 7 6 2 9 3 4 3 5 4 8 4 0 4 3 9 8 7 0 5 8 6 1 8 9 4 1 5 2 1 8 6 7 5 9 0 0 3 9 4 1 7 6 1 3 5 8 9 5 6 1 9 8 2
Number of ones: 37
Number of sevens: 33
This is the …rst page of the IQ task
Instructions CN task (high incentive condition)
Welcome to this experiment! Please do not talk to other participants at any time during the experiment! Your task is to count the correct number of ones and sevens in a block of random numbers. You can solve the blocks in any order you like. For every correct answer you are scored one point. An answer is valued correct if it states the exact number of ones or sevens with a deviation of one.
Example:
If the exact number of ones in a block is 30 the answers 29, 30 or 31 are valued correct.
You have 30 minutes to work on the task. After that we will hand out forms. Please copy your answers into the form. A questionnaire is …xed to the forms. Please also answer the questionnaire. You will always get a
…xed participation fee of 5e and additional 0.5e for every point scored. The compensation is paid cash on November 26th to 28th from 10.00 to 12.00 o’clock at the Chair’s library (Room 69). You will be informed about your scorings as well. Please bring along your anonymous ID-Code. The ID-Code is printed on your form. Additionally it is …xed to your form on a separate piece of paper. Please tear it o¤ the form and bring it along when you collect your payment. If you have further questions concerning the procedures raise your hand and wait until a supervisor comes over to you. Do not ask any question aloud! Thank You for Your participation!
Instructions IQ task (high incentive condition)
Welcome to this experiment! Please do not talk to other participants at
any time during the experiment! Your task is to solve the following exercises
correctly. Each type of exercise is illustrated by an example. You can solve
the exercises in any order you like. For every correct answer you are scored
one point. For an incorrect answer you get a penalty of 0.5 points. Hence, 0.5
points will be subtracted from your score for an incorrect answer. You have
30 minutes to work on the task. After that we will hand out forms. Please
copy your answers into the form. A questionnaire is …xed to the form. Please
also answer the questionnaire. You will always get a …xed participation fee
of 5e and additional 0.5e for every point scored. The compensation is paid cash on November 26th to 28th from 10.00 to 12.00 o’clock at the Chair’s library (Room 69). You will be informed about your scorings as well. Please bring along your anonymous ID-Code. The ID-Code is printed on your form.
Additionally it is …xed to your form on a separate piece of paper. Please tear it o¤ the form and bring it along when you collect your payment. If you have further questions concerning the procedures raise your hand and wait until a supervisor comes over to you. Do not ask any question aloud! Thank You for Your participation!
Proof. Proposition 1: Due to the strict concavity of the objective function and the assumption on the cost function there must be a unique internal optimum. Suppose that e < e
R, then
e = c
0 1( )
must hold. That is, the agent chooses an e¤ort level to the left of the kink.
This occurs if
< c
0R
:
The equation de…nes a unique cut-o¤ value for such that e = c
0 1( ) i¤
is smaller than the cut-o¤ value. In case of e > e
R, the optimum is de…ned by
e = c
0 1(s ) :
Consequently e must be located right of R which happens if
> 1 s c
0R
:
This cut-o¤ value is strictly larger than the cut-o¤ value de…ned by e =
c
0 1( ). It follows that in all other cases the agent chooses e = e
R.
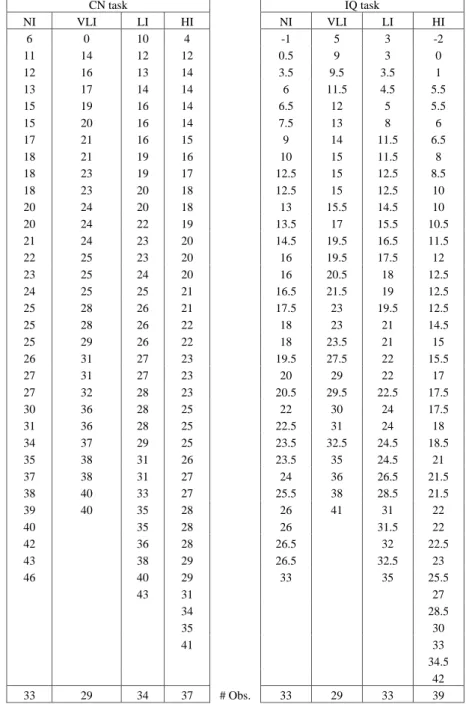
CN task IQ task
NI VLI LI HI NI VLI LI HI
6 0 10 4 -1 5 3 -2
11 14 12 12 0.5 9 3 0
12 16 13 14 3.5 9.5 3.5 1
13 17 14 14 6 11.5 4.5 5.5
15 19 16 14 6.5 12 5 5.5
15 20 16 14 7.5 13 8 6
17 21 16 15 9 14 11.5 6.5
18 21 19 16 10 15 11.5 8
18 23 19 17 12.5 15 12.5 8.5
18 23 20 18 12.5 15 12.5 10
20 24 20 18 13 15.5 14.5 10
20 24 22 19 13.5 17 15.5 10.5
21 24 23 20 14.5 19.5 16.5 11.5
22 25 23 20 16 19.5 17.5 12
23 25 24 20 16 20.5 18 12.5
24 25 25 21 16.5 21.5 19 12.5
25 28 26 21 17.5 23 19.5 12.5
25 28 26 22 18 23 21 14.5
25 29 26 22 18 23.5 21 15
26 31 27 23 19.5 27.5 22 15.5
27 31 27 23 20 29 22 17
27 32 28 23 20.5 29.5 22.5 17.5
30 36 28 25 22 30 24 17.5
31 36 28 25 22.5 31 24 18
34 37 29 25 23.5 32.5 24.5 18.5
35 38 31 26 23.5 35 24.5 21
37 38 31 27 24 36 26.5 21.5
38 40 33 27 25.5 38 28.5 21.5
39 40 35 28 26 41 31 22
40 35 28 26 31.5 22
42 36 28 26.5 32 22.5
43 38 29 26.5 32.5 23
46 40 29 33 35 25.5
43 31 27
34 28.5
35 30
41 33
34.5 42
33 29 34 37 # Obs. 33 29 33 39
Table 2.6: Point scorings by wage and task
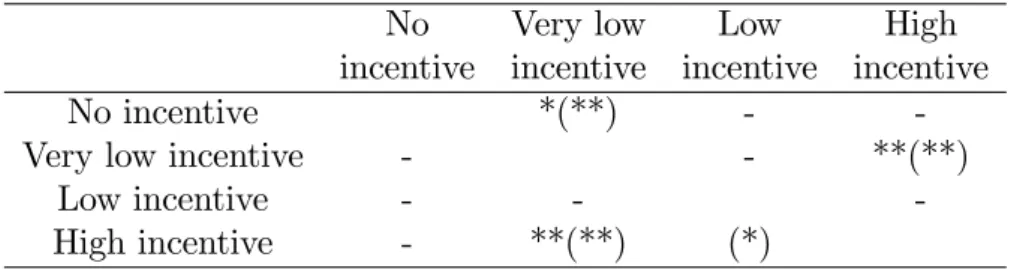
No Very low Low High incentive incentive incentive incentive
No incentive *(**) - -
Very low incentive - - **(**)
Low incentive - - -
High incentive - **(**) (*)
Results above (below) diagonal refer to IQ task (CN task)
** signi…cant at 5%; * signi…cant at 10%; - not signi…cant Results of one-sided test in parentheses
Table 2.7: Results Mann-Whitney-U-test both tasks
Chapter 3
The Role of the Fixed Wage in Setting Incentives 1
3.1 Introduction
As we have discussed comprehensively in the previous chapter, most simple principal agent models predict that stronger incentives ceteris paribus lead to higher performance of the agent. On the other hand, it is noticeable that only a relatively small part of the total compensation is performance depen- dent in many …rms. For example, Murphy (1999) using Towers Perrin’s 1997 Worldwide Total Remuneration report shows that although the composition of executive pay varies considerably between industries, …rm sizes, and coun- tries, predominantly the greater fraction of the total compensation is covered by the base salary which constitutes a …xed compensation. This seems to be especially true for CEO payments outside the US. Due to this observation some questions arise: Does the …xed wage play an additional role in incentive schemes apart from attracting employees and ensuring the acceptance of the contract? Is there a linkage between the height of …xed payments and the strength of incentives within an incentive contract?
In contrast to Murphy (1999) indicating that variable payment plays a minor role in CEO compensation, economic theory teaches us the relevance
1
This chapter is based on Mohnen and Pokorny (2006a).
of variable, performance-based payments. Particularly according to most simple standard agency models only the variable wage component induces incentives. A higher piece rate is followed by an increase in the e¤ort level whereas the …xed wage only ensures the agent’s participation (for seminal papers on the standard approach see, e.g. Holmström (1979), Grossman and Hart (1983) or Hart and Holmström (1987)).
The impact of exclusively paying a …xed wage on the e¤ort decision has been examined empirically. An important approach of designing an employer- employee relationship in the lab is the gift-exchange game (e.g. Berg et al.
(1995), Fehr et al. (1993)). Typically an employer o¤ers a …xed wage to an employee and asks for a certain e¤ort level in exchange. The desired e¤ort level is not binding but e¤ort exertion is costly for the employee. Ac- cording to standard game theoretical predictions the employee should exert the lowest e¤ort level possible and therefore the employer should o¤er the lowest wage possible at the beginning of the game. However, this is not what is observed in most experimental studies (Gächter and Falk (2002) for an overview). Generally, higher wages are paid and higher e¤ort levels are exerted than predicted by theory. Furthermore, e¤ort exertion signi…- cantly increases in the wage o¤ered. These results are commonly explained by concepts of social preferences like reciprocity (Rabin (1993), Dufwenberg and Kirchsteiger (2000)) and inequity aversion or fairness (Akerlof (1982), Falk and Fischbacher (1999), Fehr and Schmidt (1999), Bolton and Ockenfels (2000)). According to reciprocity, individuals’reactions to friendly behavior are friendly as well, and vice versa. Consequently, reciprocity theories pre- dict increasing e¤ort levels with higher wages if a high wage is perceived as friendliness.
In the previous chapter and the related literature (e.g. Camerer et al.
(1997) and Fehr and Götte (2005)) we have seen that reference dependent
preferences have an impact on the e¤ort decision. If this is the case, the
height of the …xed wage has an in‡uence on the incentive power of the piece
rate. So the aim of this chapter is the investigation of the role of the …xed
payment within an incentive contract. To the best of our knowledge, the
e¤ect of varying …xed wages on performance has only been examined for
situations in which the …xed wage is paid exclusively. Therefore we test whether there is an impact of the …xed payment on the chosen e¤ort level.
In our approach we …rst extend the analysis of reference dependent pref- erences and loss aversion concerning linear wage contracts. In particular we try to shed light on the question in how far the …xed wage component drives the e¤ort decision if individuals are loss averse. For this purpose, we de- rive theoretical predictions on the e¤ect of varying …xed wages on the e¤ort decision from the model developed in Chapter 2. Secondly, we test the re- sulting predictions in a real e¤ort experiment at the Universities of Bonn and Cologne. The subjects were all paid the same piece rate but the amount of the …xed payment in the three conditions is varied: low, intermediate and high. All of them were o¤ered to work on the same calculation task and each participant in the experiment knew ex ante the precise duration of the work- ing time and his wage contract. Note that there are no explicit principals in this experiment who bene…t from the agents’e¤ort. We do this to measure the impact of wages in a ‘clean’ way. Including interaction with principals might produce di¤erent motives and hence decisions.
We chose real e¤ort conditions to create an environment which is closer to real work conditions. Laboratory experiments are almost always very abstract and this is likely to a¤ect the results (Gneezy (2004): 4-5, 7-8). Since we have real e¤ort costs instead of a monetary cost function in our setting we believe our results produce better implications for real work environments than in case of an abstract e¤ort choice.
Our experimental results indicate that workers indeed care about the
…xed payments. Subjects receiving the low and high …xed payments worked signi…cantly more than those participants who were paid an intermediate
…xed wage. As the principal agent model including loss aversion can explain only part of the observed behavioral pattern, we provide a di¤erent explana- tion for the results which focuses on a kind of social norm representing the appropriateness of the …xed wage payment.
22