Compensation, Performance and Selection - Empirical Studies on the E¤ectiveness of
Incentive Schemes in Firms
Inauguraldissertation zur
Erlangung des Doktorgrades der
Wirtschafts- und Sozialwissenschaftlichen Fakultät der
Universität zu Köln
2011
vorgelegt von
Diplom-Volkswirt Johannes Berger
aus
Marburg
Referent: Professor Dr. Dirk Sliwka Korreferent: Professor Dr. Bernd Irlenbusch Tag der Promotion: 16.12.2011
Für meine Eltern
Danksagung
Mein allererster Dank gebührt meinem Doktorvater Dirk Sliwka, dessen Geistre- ichtum und konstruktive Kritik mir sehr geholfen hat, Erkenntnisse immer wieder neu zu hinterfragen und meine Analysen weiter zu verbessern. Ich bin ihm überaus dankbar für seine loyale und kollegiale Art der Zusammenarbeit und seine großartige Führung während der gesamten Promotionszeit. Für die hilfreichen Kommentare sowie die Übernahme des Korreferates danke ich Bernd Irlenbusch sehr herzlich.
Von zentraler Bedeutung war für mich die Unterstützung meiner Lehrstuh- lkollegen. Ganz besonders möchte ich mich bei den jetzigen und ehemaligen Mitstreitern Torsten Biemann, Kathrin Breuer, Anastasia Danilov, Christine Harbring, Björn Hartig, Claus Herbertz, Patrick Kampkötter, Felix Kölle, Petra Nieken und Nannan Zhou für ihre o¤ene und unkomplizierte Zusamme- narbeit bedanken. Ohne ihre große Diskussionsbereitschaft und ihre zahlre- ichen Denkanstöße wäre diese Arbeit nicht möglich gewesen. Darüberhinaus möchte ich mich bei unserer Sekretärin Beate Ommer sowie unseren studen- tischen und wissenschaftlichen Hilfskräften Isabella Cetnarowski, Paul Cibu- Deaconu, Alexander Creson, Behnud Djawadi, Saskia Günther, Andrea Ham- mermann, David Hirschfeld, Thorsten Hormesch, Katharina Laske, Michael Lüttjohann, Christiane Schäfer, Ursula Schuh, Kai Seifert, Julia Sohn, An- dreas Sta¤elt und Timo Vogelsang für ihre große Hilfsbereitschaft bedanken.
Auch den (ehemaligen) Mitarbeiterinnen und Mitarbeitern vom Great Place to Work Institut, Frank Hauser, Johanna Kirsch und Karsten Schulte danke ich für die hervorragende Zusammenarbeit.
Besonders möchte ich auch Ste¤en Altman, Armin Falk und Matthias Wibral von der Uni Bonn danken, die mein Interesse für Verhaltensökonomie geweckt und mich in meinem Entschluss zu promovieren bestärkt haben. Vie- len Dank auch an Jordi Brandts, Matthew Ellman, Julian Rohde und die an- deren Mitarbeiter des Research Chair Antoni Serra Ramoneda in Barcelona, die mich während meines Auslandsaufenthaltes herzlich bei sich aufgenom- men haben und mir fachlich und menschlich eine große Hilfe waren.
Ein ganz besonderer Dank geht an meine Eltern und meine Geschwis- ter Gesine und Martin, die mich sowohl während des Studiums, als auch in der Promotionszeit in meinen Entscheidungen getragen und bestärkt haben.
Danken möchte ich auch meinem guten Freund und mittlerweile Arbeitskol- legen Julian Conrads. Unser permanente Austausch über die Diskrepanz zwischen ökonomischer Theorie und experimentalökonomischer Evidenz hat mich immer wieder neu in meinem Forschungsvorhaben bestärkt.
Ein großer Dank gilt auch all denjenigen ehemaligen Studienkollegen aus Trier, Indiana, Bonn und Barcelona, die dazu beigetragen haben, dass das Studentenleben auch nach Vorlesungsende noch abwechslungsreich ver- lief. Hier zu nennen sind vor allem Marc Niewalda, Johannes Stolz, Tobias Springer, Cory Leighty, Ina Karabasz, Javier Pinzon, Michael Muckle, Orsola Garofalo, Christina Rott und Max Weber.
Mein größter Dank geht allerdings an Barbara Dreyer, die mich mit großer Geduld, Ruhe und Selbstlosigkeit durch alle Höhen und Tiefen meiner Pro- motionszeit getragen hat. Ich bin ihr unendlich dankbar für ihr Gespür, mich in den richtigen Momenten von der Forschung abzulenken und an anderen Abenden über Papern, Emails oder Auswertungen alleine sitzen zu lassen.
Ohne ihren starken Rückhalt während der letzten 3 Jahre wäre mir Vieles sehr viel schwerer gefallen.
Contents
1 Introduction 1
2 Performance Appraisals and the Impact of Forced Distribu- tion - an Experimental Investigation 10
2.1 Introduction . . . 10
2.2 Experimental Design . . . 14
2.3 Results . . . 19
2.3.1 Performance E¤ects of Forced Distribution . . . 19
2.3.2 Di¤erentiation and Productivity . . . 27
2.3.3 What drives Rating Behavior? . . . 35
2.3.4 Introducing or Abolishing a Forced Distribution? . . . 38
2.3.5 Forced Distribution and Costly Grades . . . 42
2.3.6 Forced Distribution and Sabotage . . . 44
2.4 Conclusion . . . 47
2.5 Appendix . . . 49
3 Heterogeneous Contestants and the Intensity of Tournaments - an Empirical Investigation 61 3.1 Introduction . . . 61
3.2 Related Literature . . . 63
3.3 The Data . . . 64
3.3.1 The Game of Handball . . . 65
3.3.2 Heterogeneity Measures . . . 65
3.3.3 E¤ort Measures . . . 66
3.4 Results . . . 68
3.4.1 The Impact of Heterogeneity on the Intensity of the
Game . . . 69
3.4.2 The Impact of Heterogeneity on Favorites and Under- dogs . . . 74
3.4.3 Testing our Measure of Game Intensity . . . 78
3.5 Conclusion . . . 82
3.6 Appendix . . . 83
4 Incentives and Cooperation in Firms - Field Evidence 89 4.1 Introduction . . . 89
4.2 Data and Hypotheses . . . 92
4.3 Results . . . 96
4.3.1 Team Incentives and Cooperation . . . 96
4.3.2 Incentives or Self-Selection? . . . 102
4.3.3 Team Incentives and Absenteeism . . . 106
4.4 Conclusion . . . 108
4.5 Appendix . . . 109
5 Gender Di¤erences in Risk Preferences among Workers and Managers - Field Evidence from Germany 113 5.1 Introduction . . . 113
5.2 GSOEP: Data, Methods and Results . . . 115
5.3 GPTW: Data, Methods and Results . . . 123
5.4 Application: Performance-related Pay, Risk and Female Man- agers . . . 131
5.5 Conclusion . . . 133
5.6 Appendix . . . 135
Bibliography 139
List of Tables
2.1 Ratings and bonus payments . . . 16
2.2 Overview of treatments in the core setting . . . 18
2.3 The impact of forced distribution on productivity . . . 24
2.4 The impact of rank and output on bonus payments . . . 29
2.5 The impact of ratings on individual performance . . . 32
2.6 The impact of deliberate di¤erentiation on subsequent output 34 2.7 What drives rating behavior? . . . 37
2.8 E¤ects of the introduction of a forced distribution . . . 40
2.9 Introducing and abolishing forced distribution . . . 41
2.10 Ratings, bonus payments and costs . . . 42
2.11 Summary statistics of all treatments . . . 49
2.12 The performance e¤ect of forced distribution on di¤erent out- put measures . . . 50
2.13 The impact of forced distribution depending on ability . . . . 51
2.14 The impact of forced distribution on productivity in the last 8 periods . . . 52
2.15 The impact of ratings on timeouts . . . 53
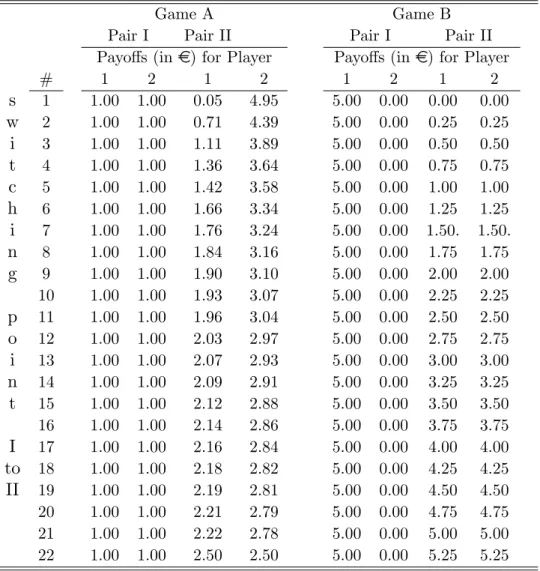
2.16 Eliciting social preferences - "#" indicates the unique switch- ing point from pair I to pair II. . . 54
2.17 The Impact of forced distribution on productivity - treatment variations . . . 55
2.18 The impact of deliberate di¤erentiation on sabotage activity . 56 3.1 The e¤ect of heterogeneity on 2-minute suspensions . . . 71
3.2 The e¤ect of heterogeneity on 2-minute suspensions of fa- vorites and underdogs . . . 77 3.3 Game intensity as a determinant for game outcomes . . . 81 3.4 Calculating the winning probabilities and deriving a hetero-
geneity measure from sports betting odds . . . 83 3.5 Descriptive statistics of key variables . . . 84 3.6 The e¤ect of heterogeneity on 2-minute suspensions - di¤erent
heterogeneity measures . . . 86 3.7 The e¤ect of heterogeneity on 2-minute suspensions in each half 87 3.8 The relation between heterogeneity and 2-minute suspensions
of favorites and underdogs . . . 87 3.9 The e¤ect of heterogeneity on the favorites’ number of 2-
minute suspensions at away games . . . 88 4.1 Utilization of performance-related pay in the sample . . . 94 4.2 Survey items approximating cooperation . . . 95 4.3 Performance-related pay and cooperation among workers . . . 98 4.4 Performance-related pay, cooperation among workers and …rm-
size . . . 99 4.5 Performance-related pay and cooperation among workers -
subsample analysis . . . 101 4.6 Performance-related pay and self-selection . . . 104 4.7 Performance-related pay, self selection and cooperation among
workers . . . 105 4.8 Performance-related pay and absenteeism . . . 107 4.9 Descriptive statistics of explanatory variables . . . 110 4.10 Performance-related pay, HR policies and cooperation among
workers . . . 112 5.1 Gender-speci…c risk di¤erences across hierarchical levels in the
GSOEP - regressions . . . 120 5.2 Gender-speci…c risk di¤erences across hierarchical levels in the
GSOEP - interacted regressions . . . 122
5.3 Gender-speci…c risk di¤erences across hierarchical levels in the GPTW - regressions . . . 127 5.4 Gender-speci…c risk di¤erences across hierarchical levels in the
GPTW - interacted regressions . . . 129 5.5 Share of women across hierarchical positions in Germany . . . 131 5.6 Share of female managers and performance-related pay . . . . 132 5.7 Descriptive statistics - GSOEP . . . 136 5.8 Descriptive statistics - GPTW . . . 137
List of Figures
2.1 Distribution of ratings across treatments . . . 20 2.2 Distribution of group output across treatments . . . 21 2.3 Group output over time across treatments . . . 22 2.4 Distribution of ratings according to relative performance in
the group . . . 30 2.5 Group output over time across treatments when ratings are
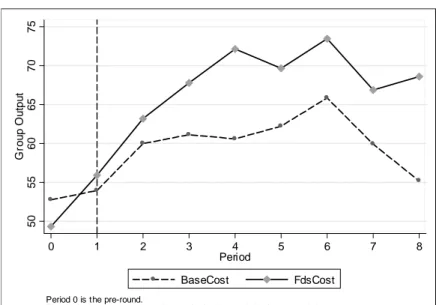
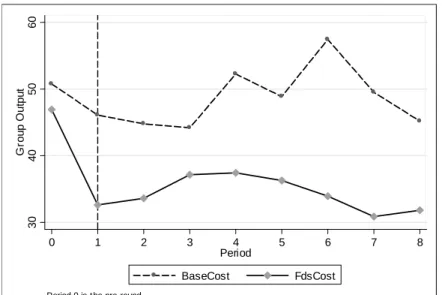
costly . . . 43 2.6 Group output over time across treatments when sabotage is
possible . . . 46 2.7 Real-e¤ort counting task in the experiment . . . 50 3.1 The relation between heterogeneity (based on betting odds)
and the number of 2-minute suspensions . . . 69 3.2 The relation between heterogeneity (based on betting odds)
and 2-minute suspensions of favorites and underdogs . . . 75 3.3 The distribution of 2-minute suspensions in the sample . . . . 85 4.1 Utilization of performance-related pay across German industries 94 4.2 Structure of performance-related pay across German industries 94 4.3 The fraction of cooperative employees across German industries111 5.1 Distribution of the general willingness to take risks in the
GSOEP 2009 . . . 117 5.2 Gender-speci…c risk di¤erences across hierarchical levels in the
GSOEP - descriptives . . . 118 5.3 Distribution of importance of job security in the GPTW 2006 125
5.4 Gender-speci…c risk di¤erences across hierarchical levels in the GTPW - descriptives . . . 125 5.5 Share of female employees across German industries in the
GPTW data set . . . 138
Chapter 1 Introduction
This thesis empirically investigates the e¤ectiveness of incentives systems in
…rms and organizations. We are interested in how employees respond to dif- ferent forms of monetary incentives. By the means of laboratory experiments and …eld data we analyze bonus systems based on subjective performance ap- praisals, tournament incentives and pay-for-performance incentive schemes.
We study individual performance, cooperation, absenteeism and self-selection as potential employee responses evoked by these incentives systems. The interaction between individual preferences and compensation schemes is a second focus of this thesis. In particular, we provide evidence on the link between fairness concerns and evaluation behavior and the relevance of risk preferences for self-selection. Based on the empirical …ndings, we try to de- rive practical implications for the optimal design of incentives in …rms. The following paragraphs brie‡y motivate the research questions of each chapter, summarize the main …ndings and explain how they relate to each other.
Since work e¤ort is assumed to be costly to employees but bene…cial to the …rm, employment relationships comprise a natural con‡ict of interest.
Resolving this con‡ict by appropriate incentive schemes is a central theme of personnel economics (see for instance Lazear and Shaw (2007)). If true e¤ort was perfectly observable and thus contractible, incentives could easily overcome the moral hazard problem and realign interests by compensating employees for their e¤ort costs. Since in practice performance rather than
e¤ort is measurable, the design of optimal incentive plans is a delicate is- sue. Even performance is rarely fully captured by objective measures, which is why companies frequently rely on subjective performance evaluations to decide upon bonus payments. This, however, gives supervisors discretion over the distribution of ratings and thus the distribution of cash rewards in the respective department. As a result, supervisors can bias performance ratings according to individual preferences by, for instance, overstating true performances and neglecting performance di¤erences among subordinates.
There are many reasons why supervisors may want to distort ratings.
Psychology-based explanations refer to the mental costs associated with com- municating negative feedback or the risk of rising frustration and envy in teams with higher pay dispersion. Alternatively, supervisors could try to signal superior leadership competencies by exaggerating low performers’rat- ings. Moreover, when performance measures are fraught with measurement error, supervisors may fear to make mistakes and prefer to pay everybody the same than to pay someone less who actually deserves more. Likewise, some supervisors simply want to avoid pay inequality among subordinates or between themselves and their subordinates for fairness reasons. In‡ated and compressed ratings may thus be the result of generosity or inequity aver- sion. Indeed, several studies …nd the distribution of subjective performance evaluations to be heavily biased to the top and compressed to the middle of the rating scale. Since performance changes are no longer re‡ected in bonus changes, incentives to improve subsequent performance should be watered down (see Prendergast (1999) for a survey).
However, recent behavioral economic models may also predict the oppo- site. Reciprocity models (e.g. Rabin (1993), Dufwenberg and Kirchsteiger (2004) or Falk and Fischbacher (2006)) or the Fair-Wage-E¤ort Hypothesis (Akerlof and Yellen (1988), Akerlof and Yellen (1990)) suggest that in‡ated bonus payments could be perceived as kind gifts which employees may want to reciprocate by putting in extra e¤ort in subsequent years. Also bonus di¤erentiation may be perceived as unfair and -according to recent outcome- based models of inequity-aversion (e.g. Fehr and Schmidt (1999) and Bolton and Ockenfels (2000)) - cause utility decreases for inequity averse employees.
In response to the potential negative e¤ects associated with biased rat- ings, companies have implemented rating systems that prevent lenient and compressed ratings. By assigning ranks or sorting …xed percentages of work- ers in pre-de…ned intervals of a performance distribution, supervisors are sometimes forced to distinguish between good and poor performance. Such systems, of which GE’s "vitality curve" or the recently introduced forced ranking system at AIG are famous examples, remain controversially dis- cussed. While some cherish the bene…ts of a competitive work environment, others stress the lack of acceptance among the workforce. Recent law suits initiated by employees who felt discriminated led some …rms to abolish such systems again.1
Chapter 2 of this thesis investigates the determinants and incentive e¤ects of biased performance ratings in more detail. We use a real-e¤ort laboratory study in which a supervisor repeatedly evaluates the performance of three subordinates on a …ve-point scale. Subordinates are paid according to their individual rating while supervisors bene…t from higher group performance.
In the baseline treatment condition supervisors are unrestricted in their eval- uation behavior and may in‡ate or compress ratings as much as they like. In another treatment supervisors must follow a pre-speci…ed rating distribution, forcing them to di¤erentiate between the top, middle and low performer in their group. The main result of the study is that under enforced di¤eren- tiation workers are roughly 5-12% more productive over the course of the experiment. Importantly, the output increase does not come at the cost of lower output quality.
The key results remains robust, also when the supervisor has to carry some of the costs associated with employees’ bonuses. However, a forced distribution seems to harm individual performance, when employees get the chance to sabotage each other. We observe a signi…cantly higher amount of sabotage activity under the forced distribution system.
While most supervisors in the baseline treatment in‡ate and compress ratings to maximize subordinates’bonuses, those that deliberately di¤eren-
1See for instance “Performance Reviews: Many Need Improvement” in the New York Times (September 10, 2006).
tiate signi…cantly improve group performance in the following periods. The study also reveals that rating biases can be explained by supervisors’concerns for altruism or inequity aversion.
When bonus di¤erentiation is enforced, workers essentially compete for the largest bonus payment in the group. Relative performance becomes more important than absolute performance. The performance increase in the forced distribution treatment may thus be attributed to the willingness of subordinates to outperform their coworkers. To give subjects a realistic chance to a¤ect their relative performance rank, we deliberately matched individuals with others of similar abilities into groups.
In reality, however, individuals that compete for a wage increase, a promo- tion or a contract may considerably di¤er with respect to ability, experience or skill. When ability di¤erences are too large and evident, the inferior con- testant may decide to save e¤ort costs as his chances to win are comparably small. Anticipating such behavior, the superior contestant may decide to hold back e¤ort as well. As a result, the overall e¤ort level and the intensity of the tournament decreases. With regard to the study presented in chapter 1, one could infer that the productivity gains associated with forced distribution are smaller in heterogeneous work groups. While the e¤ect of heterogeneity in tournaments is theoretically well understood (see for instance Lazear and Rosen (1981)), only recently empirical studies provide …rst evidence in line with this prediction.
In Chapter 3 we add to the emerging empirical literature on this question by analyzing professional sports data from the …rst German handball divi- sion. Statistics on sports contest often provide information on the ability or performance of tournament participants, measures that are usually not in- cluded in …rm data sets but needed to test tournament theory. In our study we explore game-speci…c sports betting odds to estimate team abilities and collect data on the number of penalties committed by either team to measure defensive e¤orts and the overall intensity of the tournament. While betting odds allow us to construct a "market-e¢ cient" measure for ability di¤erences between the competing teams, our measure of e¤ort needs more explanation:
We assume that a team who decides to put forth a lot of e¤ort has to play
very physical defense. Often high defensive e¤orts will successfully prevent goals by forcing the opponent to either turn the ball over, miss the goal or commit a time-penalty. In some instances, defensive e¤orts will be outside the legal norm and result in a penalty. In contrast to a game in which neither team tries, penalties should thus be more common in high intensity games.
In line with standard tournament theory, our data show that contests between heterogeneous teams are less intense as the number of committed penalties is lower than in games between teams of similar ability. Our analy- sis also reveals that while in theory both, the low and the top performer, should optimally reduce e¤orts when paired for an asymmetric contest, only the ex-ante dominant handball team plays less intensely. In our data, the underdog shows no signi…cant reaction to the heterogeneity of the match up and tries to win "against all odds". Further sub-analysis also reveals that ex- ante ability di¤erences are not only a good predictor of tournament intensity toward the beginning but also toward the end of the game. Irrespective the observed halftime score, larger di¤erences in ex-ante winning probabilities are associated with less intense play in the second half. Finally, we are able to show that penalties may indeed serve as an e¤ort measure as teams who commit more penalties (as a by-product of high e¤ort) are more likely to win.
Since contests in sports and …rms share essential characteristics, our study points out that promotion tournaments may not be an e¤ective incentive instrument when the competing individuals or teams considerably di¤er with respect to ability or skill. In such instances …rms may have to respond to ex- ante di¤erences by handicapping the more able contestant at the beginning of the tournament or refraining from using tournament incentives at all.
Chapters 2 and 3 thus analyze two incentive schemes frequently applied when individual performance is either not objectively measurable or only measurable in relative terms. Both studies also highlight potential ine¢ cien- cies when individual incentives are used the wrong way. But companies may not only be interested in eliciting optimal individual e¤orts, especially if this comes at the expense of low cooperation. Nowadays a substantial amount of work is organized in teams (e.g. Lazear and Shaw (2007)). Teams are
usually installed when there are bene…ts from combining individual e¤orts.
Due to, for instance, tasks interdependencies, the productivity of each in- dividual’s contribution may depend on the amount of team e¤ort invested by other team members. For …rms to bene…t from teamwork, it is therefore essential that individuals are willing to cooperate. Incentivizing individual performance goals but not team performance can cause employees to allo- cate the bulk of their work time to individual rather than team assignments.
This type of distortion has been analyzed by Holmström and Milgrom (1991) and is generally referred to as the multi-tasking problem. Even worse, when individual incentives are based on relative performance, as for instance in tournaments or under a forced distribution, employees may fully cease help- ing or even decide to sabotage work activities of their colleagues (see Lazear (1989) or Harbring and Irlenbusch (2011) and Chapter 1 for experimental evidence). To prevent this crowding out of cooperation, …rms frequently rely on group incentives such as pro…t sharing schemes or rewards based on unit or department success.
From an economic perspective, the e¤ect of group incentives on cooper- ation is unclear. On the one hand, individuals should cooperate more than in the absence of team incentives as they bene…t from higher team output.
On the other hand, team incentives generally bear the risk of free-riding since individual contributions to a team output are usually not observable.
(Holmström (1982)). Especially when combined with individual incentives, employees are given an incentive to free-ride on their group members team e¤orts to save time and costs, better invested in meeting individual perfor- mance targets. Of course, especially in smaller teams, free-riding is unlikely to be tolerated by others and cooperation may be maintained via mutual monitoring or "peer-pressure" (e.g. Kandel and Lazear (1992)).
In chapter 4 we empirically investigate the relation between compensation schemes and cooperativeness in …rms. We examine a representative sample of 305 German …rms from the year 2006 that provides detailed informa- tion on the existence and strength of performance-related pay components, i.e. the amount of worker pay that depends on individual, team or …rm performance. We map this information to roughly 36,000 employee survey
responses, measuring the level of cooperation among workers in these …rms.
Our main result is that 10 percentage points higher team incentives are as- sociated with an 11% rise of employees who con…rm that workers cooperate in their …rm. Individual performance incentives or …rm-level incentives do not relate to cooperation in the workforce. We also …nd that cooperation is in general higher in smaller teams and that the association between team incentives and cooperation is stronger in smaller companies. Since employees have fewer within-…rm exit options and are more likely to interact with work colleagues in the future, free riding on team incentives may be less likely to occur. In addition, employees are also less frequently absent in …rms with higher team incentives.
The results are robust to subsample analyses and the inclusion of several other control variables, capturing corporate culture and the overall level of job satisfaction among workers. The results also do not seem to be driven by cooperative workers self-selecting into …rms that use team incentives. How- ever, we do …nd that workers with preferences for helping are more likely to work in the health and social assistance industry and less likely to work in
…nancial or business-related services.
In general, the question whether workers self-select into companies de- pending on the compensation scheme in place is a relevant one. Theoretically, performance-related pay should attract above average performing individuals because they should earn more than under a …xed wage contract. In con- trast, below average performing employees should usually prefer contracts with lower variable pay components. The seminal case study by Lazear (2000) shows that selection indeed matters. Roughly half of the productivity increase that followed the switch from …xed to variable pay contracts could be explained by more productive workers self-selecting into the company.
Besides a¤ecting the talent of employees, the introduction of performance- related pay may also cause individuals with particular personality attributes to self-select in or out of a company. Performance pay could, for instance, attract competitive, overcon…dent, or risk seeking individuals. Risk averse individuals, in contrast, should dislike wage uncertainty and prefer a …xed wage. While in principle the relation between risk attitudes and incentive
is straightforward, only recently Bellemare and Shearer (2010) and Grund and Sliwka (2010) provided convincing …eld evidence that risk preferences can indeed explain the likelihood of working under incentive plans (see also Dohmen and Falk (2011) for recent experimental evidence).
Knowing that incentive schemes a¤ect self-selection with regard to risk attitudes, it is of course important to understand the determinants of risk attitudes to foresee the consequences of introducing or changing incentive plans. One of the most intensely studied determinants of risk aversion is gender. In particular, there is a general consensus among recent experimen- tal studies that women are more risk averse than men (see e.g. Eckel and Grossman (2008b) and Charness and Gneezy (2010) for recent surveys). In a recent literature overview Croson and Gneezy (2009), however, point out that gender-speci…c di¤erences in risk preferences do not extend to profes- sionals and managerial employees. According to Croson and Gneezy (2009), one explanation could be that only employees who are willing to take risks select themselves into managerial positions and that after this pre-selection risk preferences are similarily distributed between women and men.
In the last chapter of this dissertation I investigate gender-speci…c di¤er- ences in risk preferences among managerial and non-managerial employees in more detail. In particular, I study two large surveys that are representative for the German working population. At …rst, I analyze the 2009 wave of the German Socio-Economic Panel (GSOEP). The data set includes relatively detailed information on job hierarchy, a validated measure of general risk taking (Dohmen et al. (2011)) and two additional items measuring risk atti- tudes in job-speci…c contexts. In addition to the GSOEP, I also make use of the data set described in chapter 4. While this data set only provides a proxy for individual risk preferences, it includes observations from male and female employees from the same enterprise. This allows to control for unobserved company speci…c …xed-e¤ects which is not possible in the GSOEP data.
The main result of the study is that in both data sets substantial and signi…cant gender-speci…c di¤erences in risk attitudes exist, not only among non-managerial employees but also on the managerial level. Moreover, the gender-speci…c di¤erences do not systematically vary across levels. Indepen-
dent of gender, managers are more willing to take risks than employees on lower levels. Thus while it could be true that more risk-loving employees self-select into managerial positions, the e¤ect is not stronger for women as conjectured by Croson and Gneezy (2009). The second data set also allows me to investigate the connection between incentive pay and risk preferences.
In line with recent …eld evidence by Bellemare and Shearer (2010) and Grund and Sliwka (2010), I …nd that employees who receive performance-related pay are less risk averse than employees receiving a …xed wage. The result seems to be particularly robust for managers.
Chapter 2
Performance Appraisals and the Impact of Forced
Distribution - an Experimental Investigation 1
2.1 Introduction
In most jobs an employee’s true e¤orts are at best imprecisely captured by ob- jective key …gures. Hence, organizations frequently use subjective appraisals to evaluate substantial parts of an employee’s job performance. While this may strengthen the setting of incentives as more facets of job performance are evaluated, the opposite may be true when supervisors bias the evaluations according to personal preferences.2
There is indeed strong evidence from numerous studies indicating that subjective performance ratings tend to be biased. First of all, it has often been stressed that supervisors are too “lenient”and reluctant to use the lower spectrum of possible performance ratings. Moreover, supervisors typically do
1This chapter is based upon Berger et al. (2010).
2For an overview see for instance Murphy and Cleveland (1995), Arvey and Murphy (1998) or from an economics perspective Prendergast and Topel (1993), Prendergast and Topel (1996) or Gibbs et al. (2003).
not di¤erentiate enough between high and low performers such that ratings tend to be compressed relative to the distribution of the true performance outcomes.3 As rating scales nearly always have an upper boundary, rater leniency often directly implies rating compression. While the existence of these biases has been con…rmed in previous studies, the mechanisms behind these biases and the e¤ects on performance have only rarely been analyzed empirically. Rynes et al. (2005), for instance, stress that “although there is a voluminous psychological literature on performance evaluation, surprisingly little of this research examines the consequences of linking pay to evaluated performance in work settings” (p. 572).
A simple economic logic suggests that both of the above mentioned biases should lead to weaker incentives. As high performance is not rewarded and low performance is not sanctioned adequately, employees should have lower incentives to exert e¤ort when they anticipate biased ratings. In contrast, it may be argued that rating leniency can trigger positive reciprocity and rating compression reduces inequity among coworkers which both may lead to increased employee motivation.4
To avoid potential negative consequences of rater biases, some …rms have adopted so-called “forced distribution”systems under which supervisors have to follow a predetermined distribution of ratings. At General Electric, for example, the former CEO Jack Welch promoted what he called a “vitality curve”, according to which each supervisor had to identify the top 20% and the bottom 10% of his team in each year. According to estimates, a quarter of the Fortune 500 companies (e.g. Cisco, Intel, Hewlett Packard, Microsoft etc.) link parts of individual bene…ts to a relative performance evaluation (Boyle (2001)). However, the use of these systems is often very controversially
3These two biases are often referred to in the literature as the “leniency”and “central- ity” bias. See for instance Landy and Farr (1980), Murphy (1992), Bretz et al. (1992), Jawahar and Williams (1997), Prendergast (1999), or Moers (2005).
4Many experimental studies have now con…rmed that higher wage payments indeed trigger positive reciprocity and in turn can lead to higher e¤orts. See, for instance, Fehr et al. (1993), Fehr et al. (1997), Hannan et al. (2002) or Charness (2004). Evidence from …eld experiments is somewhat less pronounced. Recent studies …nd mostly moderate support for positive reciprocity. See for instance Gneezy and List (2006), Cohn et al.
(2010), Kube et al. (2010), Bellemare and Shearer (2009) and Hennig-Schmidt et al. (2010).
discussed and in some …rms even led to lawsuits as employees claimed to have been treated unfairly.5
From an economic perspective, forced distribution systems have the struc- ture of rank-order tournaments (see Lazear and Rosen (1981)), in which con- testants compete for a limited number of prizes. In a forced distribution system workers compete for one of the scarce good performance ratings that are typically associated with a monetary reward, e.g. a bonus or a salary in- crease. A well-known downside of tournaments, however, is the danger that cooperation among workers within the organization is put at risk as there is always an incentive to improve one’s relative position by increasing one’s productive e¤ort but also by harming others, i.e. sabotaging others (Lazear (1989)).
A key reason for the lack of …eld evidence on the consequences of a forced distribution is that, even when a …rm changes its performance appraisals system, there is typically no control group within the same …rm with an unaltered scheme. This in turn makes it hard to identify the causal e¤ect of the modi…cation. Moreover, to measure the performance consequences an objective measure of individual performance is necessary. But such objective measures are typically not available when subjective assessments are used.6
Hence, in this paper we investigate the performance consequences of a forced distribution system in a real-e¤ort experiment. In each experimental group, one participant in the role of a supervisor has to evaluate the per- formance of three participants in the role of employees over several rounds.
Participants have to work on a real-e¤ort task where the outcome of their work directly determines the supervisor’s payo¤. At the end of each round, the supervisor learns the work outcome of each individual employee and is then asked to individually rate their performance on a …ve-point scale. The employees receive a bonus payment based on this performance rating. We
5See for instance “Performance Reviews: Many Need Improvement” in the New York Times (September 10, 2006).
6Typical examples of departments in which objective measures of performance are available are sales functions in which revenues of individual sales agents can be measured.
But in these departments subjective assessments and in particular forced distributions are hardly ever used because the objective performance measures already lead to di¤erentiated ratings.
examine two experimental settings: In the baseline treatment supervisors are not restricted in their rating behavior. In a forced distribution treatment they have to give di¤erentiated ratings. We also investigate additional treat- ments in which a forced distribution system is either abolished or introduced after some rating experience with or without such a system. Moreover, we study a setting in which supervisors share the costs of the bonuses paid out to the subordinates, as well as two additional treatments in which subordinates can sabotage each other.
Our key result is that worker productivity in our experiment is about 5-12% higher under a forced distribution system when there is no possibility to interfere with the colleagues’work. Moreover, we …nd that in the absence of a forced distribution system, supervisors who care more for the well-being of others tend to assign more lenient and therefore less di¤erentiated ratings.
But weaker degrees of di¤erentiation lead to lower performance in subsequent rounds. If, for instance, an employee receives the best potential rating, knows about his relative performance and does not have the highest work outcome in the group, his subsequent performance decreases. Interestingly, supervisors seem to learn the advantages of di¤erentiation as they assign less lenient and more di¤erentiated ratings after the forced distribution has been abolished as compared to a setting in which it has never been used. In contrast, the performance e¤ect of a forced distribution is strongly reduced when the participants have experienced the more “liberal”baseline setting before and, hence, have di¤erent reference standards and expectations. The key results are robust in a situation in which it is costly for the supervisors to assign high bonuses.
While, to the best of our knowledge, there are no previous studies inves- tigating the e¤ects of the introduction of a forced distribution on incentives, some recent …eld studies investigate the e¤ects of rating compression on fu- ture outcomes. Engellandt and Riphahn (2011), Bol (2011), Kampkötter and Sliwka (2011) and Ahn et al. (2010) give some indication that rating com- pression is associated with lower subsequent performance. Direct empirical evidence on the e¤ects of forced distributions is very scarce. Recently, Schle- icher et al. (2009) have experimentally investigated rater’s reaction to forced
distribution and …nd that rating decisions are perceived as more di¢ cult and less fair under a forced distribution system than in a traditional setting.
Scullen et al. (2005) conduct a simulation study and show that forced distrib- ution can increase performance in the short run as low performers are driven out of the …rm. This e¤ect, however, becomes smaller over time. Neither study examines the incentive e¤ects of forced distributions.
The paper proceeds as follows. In the next section the experimental design and procedure are described. The experimental results are summarized in section 2.3. We …rst provide evidence on the performance di¤erence between our baseline treatment and the forced distribution condition. Then, we take a closer look at rating decisions within the baseline treatment and their relation to workers’performance as well as the connection between the supervisor’s social preferences and rating behavior. Moreover, we investigate the e¤ect of past experience in a di¤erent rating setting on both, supervisor and the worker behavior. Finally, we analyze two additional experiments, one in which ratings are costly for the supervisors and one in which workers are able to sabotage each other. We discuss and conclude our results in the last section.
2.2 Experimental Design
We conduct a laboratory study investigating several di¤erent treatments. In all treatments subjects in the role of a “supervisor”evaluate the performance of other subjects in the role of “workers” who have to work on a real-e¤ort task. Supervisors bene…t from higher worker e¤orts in all treatments. For each setting we compare a baseline treatment in which supervisors are not restricted in their evaluation behavior to a forced distribution treatment.
Each treatment consists of several parts. In the following, we describe the structure of our core setting.
Ability Test
In an initial pre-round all subjects have to work on a real-e¤ort task which is also used in the main part of the experiment, i.e. all participants have to
repeatedly count the number “7” in blocks of randomly generated numbers (see …gure 2.7 for a screenshot of this task). This pre-round is independent of the main experiment and conducted to collect a measure for each subject’s ability for the task and to familiarize participants with the task (also those who are in the role of the supervisor). We have chosen the particular design of the task for several reasons: First of all, the task is tedious and requires real work e¤ort. Second, work outcomes are observable for supervisors and the experimenter, i.e. we have a precise measure of performance that can be compared between the otherwise identical treatments. Third, noise does not play a substantial role for performance. And …nally, it is possible to assess the subjects’ability and give the supervisors some experience with the task before the experiment.
To make sure everybody has correctly understood the task, an “exercise block” is presented on the computer screen prior to the pre-round. Only after all subjects have correctly solved this block, the pre-round which lasts for 2.5 minutes is started. During the pre-round each subject’s performance is measured by the number of ‘points’collected which is converted into Euro after the experiment. For each correct answer a subject receives two points, for each wrong answer it loses 0.5 points. At the end of the pre-round, a piece-rate of 10 cents per point is paid to each participant’s account. During the task subjects are also o¤ered the opportunity to use a “timeout”button which locks the screen for 20 seconds during which subjects cannot work on any blocks. Each time the timeout button is pushed, the subject receives 8 cents. This timeout button is implemented to simulate potential further opportunity costs of working. At the end of the pre-round, each participant is informed about the total number of points achieved as well as the number of correct and false answers and the resulting payo¤.7
Main Part: Performance Ratings and Bonus Payments
After the ability test, instructions for the …rst part of the experiment are distributed. Before this part of the experiment is started, participants have
7To avoid losses, the total number of points for a period were set to zero when the total for this period was negative.
to answer several test questions on the screen to make sure they have fully understood the procedures and the payo¤ calculations.8 This …rst part of the experiment consists of eight periods, each lasting for 2.5 minutes. Each participant is assigned to a group of four participants. One participant in each group has the role of the “supervisor”and the other three participants are “workers”. The group composition as well as the roles remain …xed throughout the experiment. The workers have to perform the same real- e¤ort task as in the pre-round. They can again make use of a timeout button, blocking the screen for 20 seconds for which they receive 25 cents on their private account. After each round, each worker learns her total number of points, the number of correct and false answers and the number of timeouts chosen. Moreover, each worker is also informed about the number of points and correct and false answers of the other two workers in her group. The supervisor also receives this individual performance information for each of the three workers in her group and then has to rate each worker on a rating scale of “1”to “5”, with “1”being the best and “5”the worst rating available.
Rating Bonus Worker
1 10.00e
2 7.50e
3 5.00e
4 2.50e
5 0.00e
Table 2.1: Ratings and bonus payments
Each rating is associated with a bonus payment for the worker (see table 2.1), ranging from 10efor the highest rating “1”to 0efor the worst rating of “5”. It is important to stress that in our core setting the supervisor does not personally bear the costs of the bonus payments. The reason is that in most …eld settings supervisors who evaluate the performance of employees are not residual claimants but are themselves salaried employees and, hence, higher bonus payments to subordinates do not lower their own income. We
8Participants have to calculate the payo¤s for a worker and a supervisor for an output as well as a rating they themselves could freely choose.
will later on vary this and investigate treatments in which supervisors bear costs for higher bonus payments.
The round payo¤ for the worker is the sum of her bonus payment and the payo¤ from pushing the timeout button. The payo¤ of the supervisor is solely determined by the output of the three workers in her group. For each point achieved by one of the three workers the supervisor receives 30 cents. At the end of the round, each worker is informed about her rating, the number of timeouts and her resulting payo¤. The worker does not learn about the other workers’ ratings in her group. One round is randomly determined in each part of the experiment which is payo¤-relevant (for details see “Procedures”).
Matching of Groups
To create a situation in which performance ratings are not straightfor- wardly due to ability di¤erences, we match participants into homogeneous groups. The matching procedure is based on the performance in the pre- round, i.e. all 32 subjects are individually ranked in each session based on their total number of points achieved in the pre-round. The four participants with the best ranking are assigned to a group, the four best individuals of the remaining participants to the next group etc. Within each group, the participant with the best performance is assigned the role of the supervisor.
Participants are not informed about the matching procedure to avoid strate- gic considerations.9 Subjects only know they will be grouped with three other participants. At the end of the experiment, a few additional decision games are played to elicit subjects’social preferences. After these games all participants have to …ll out a questionnaire.
Treatments
In our core setting we analyze two di¤erent treatments: In the baseline treatment (Base) supervisors are not restricted in their rating behavior. In the forced distribution setting (Fds), however, supervisors have to give one
9In one of our extensions we informed the subjects about the matching procedure and added survey questions in the end of the experiment to investigate potential e¤ects of the procedure. However, we did not …nd evidence that this a¤ected the way in which evaluations were conducted or the reactions to the evaluations.
worker a rating of “1”or “2”, one worker a rating of “3”and another worker a
“4”or “5”. This restriction is explained to all participants in the treatment.
To also analyze the e¤ects of introducing or abolishing a forced distri- bution system in a within-subject design, we split the experiment into two parts, each consisting of 8 consecutive rounds. The group matching as well as the assigned roles are kept constant across both parts. In our treatment BaseFds, for example, participants work in the baseline setting for 8 rounds (…rst part) which are followed by 8 rounds of the forced distribution set- ting (second part). To disentangle rating rule e¤ects from time and learning e¤ects we conduct two additional treatments in which the rating rule does not change across both parts of the experiment (BaseBase and FdsFds).
Therefore, we conduct four treatments in this setting (see table 2.2).
Treatment Round 1-8 Round 9-16
BaseBase Base Base
FdsFds Fds Fds
BaseFds Base Fds
FdsBase Fds Base
Table 2.2: Overview of treatments in the core setting Procedures
After participants have arrived in the laboratory, they are seated in sep- arated cabins where they receive the instructions for the pre-round of the experiment. Participants are told that they are not allowed to communicate.
In case of any question, they have to raise their hand such that one of the experimenters will come and help. The experiment starts after all partici- pants have read the instructions and all questions have been answered. After the pre-round, instructions for the …rst part of the experiment are distrib- uted. Instructions for the second part only follow after the …rst part has been completed.10
The instructions inform participants that only one of the eight rounds of each part of the experiment will be payo¤-relevant for all participants. At
10In BaseBase and FdsFds the subjects are told after the …rst part that the rules for the second part of the experiment are the same as for the …rst part.
the end of each session, a randomly selected subject is asked to twice draw one of 8 cards to determine which rounds will be paid out. The …nal payo¤
for each subject consists of the money earned during the experiment and a show-up fee of 4 e. The money is anonymously paid out in cash at the end of each session.
In total, the core setting of the experiment consists of 8 sessions with two sessions for each treatment condition. Thus, we have 64 subjects (16 independent groups) in each treatment with a total of 256 participants. It is ensured that no one has been involved in an experiment with the same real e¤ort task before. No subject participates in more than one session. On average, a session lasts for 2.5 hours and the average payo¤ amounts to 27e.
The experiment is conducted at the Cologne Laboratory for Economic Re- search. All sessions are computerized using the experimental software z-Tree (Fischbacher (2007)) and subjects are recruited with the online recruiting system ORSEE (Greiner (2004)).
2.3 Results
In this section we …rst give an overview of the performance e¤ect of the forced distribution system in our core experimental setting. We then analyze the driving forces behind the observed treatment di¤erences in more detail.
Section 2.3.4 provides an overview of spillover e¤ects observed when the sequence of both settings varies inBaseFds and FdsBase. Finally, we report the results of two additional experiment, one in which awarding bonuses is costly for the supervisors and one in which workers can sabotage each other.
2.3.1 Performance E¤ects of Forced Distribution
We start with an analysis of the …rst part. For each of the two treatment conditions (Fds and Base) we have thus 32 strictly independent group ob- servations.11
11Note thatBaseBase andBaseFds on the one hand andFdsFds andFdsBase on the other are perfectly identical in the …rst part as participants only learn the rules of the second part after the end of the …rst one.
0204060
1 2 3 4 5 1 2 3 4 5
Base Fds
Percent
Rating
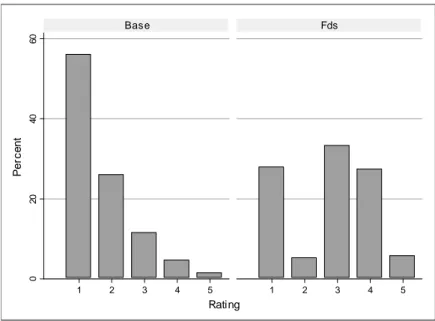
Figure 2.1: Distribution of ratings across treatments
Figure 2.1 contrasts the distribution of ratings in the …rst eight periods in Base and Fds. Evidently, supervisors in Base tend to assign very good ratings, i.e. a “1” or “2”, in the majority of cases (82%). Note that this pattern closely resembles the typical “leniency bias” often observed in orga- nizational practice. Bretz et al. (1992), for instance, describe this as follows:
“Performance appraisal systems typically have …ve levels to di¤erentiate em- ployee performance. However, even though most organizations report systems with …ve levels, generally only three levels are used. Both the desired and the actual distributions tend to be top heavy, with the top “Buckets” relatively full and the bottom buckets relatively empty. . . It is common for 60-70% of an organization’s workforce to be rated in the top two performance levels. . . . Skewed performance distributions not only exist, but are common”. As in most real-world organizations, supervisors in the experiment do not have to bear the direct costs of higher bonus payments.12 In this situation they in- deed have a tendency to assign high bonuses to their subordinates, a behavior limited by the forced distribution system. Nonetheless, within the degrees
12A setting in which higher ratings are costly for the supervisors is studied in section 2.3.5.
0.2.4.6.81Relative Frequency
20 40 60 80 100
Base Fds
Group Output
Figure 2.2: Distribution of group output across treatments
of freedom left by the system, the supervisors in Fds still follow the lenient choices and strongly prefer the “1”over the “2“ and the “4”over the “5“ as shown in the right panel of …gure 2.1.
But it is of course important to investigate the performance consequences of this rating behavior. A key hypothesis based on a simple economic rea- soning is that the return to e¤ort should be lower in the baseline treatment as compared to the forced distribution treatment. Hence, participants in the role of employees should have lower incentives to exert high e¤ort lev- els. Instead, one may argue that supervisors assign good grades on purpose, hoping to trigger positive reciprocity on the workers’ part and thereby in- creasing their motivation. As already laid out in the introduction, numerous gift-exchange experiments have provided evidence for the fair wage-e¤ort hy- pothesis, positing that higher wage payments may lead to higher e¤orts.
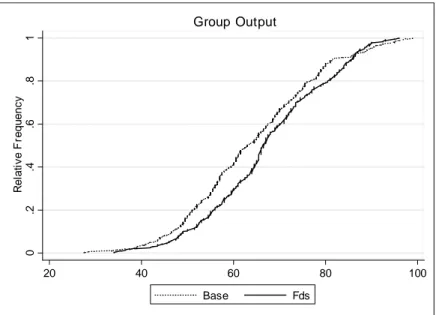
Figure 2.2 plots the distribution of group output in both treatments. The
…gure indicates that performance is indeed higher under the forced distribu- tion. Group performance increases on average by about 5% and the di¤erence raises to almost 9% when we analyze the second parts of the BaseBase and FdsFds treatments.
505560657075Group Output
0 1 2 3 4 5 6 7 8
Period
Base Fds
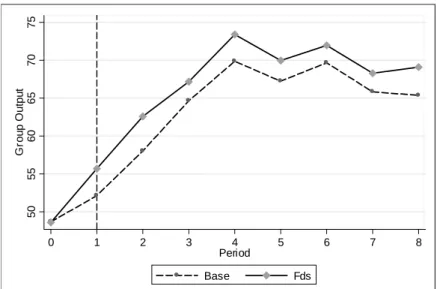
Period 0 is the pre-round.
The dashed line at period 1 indicates the beginning of the first part of the experiment.
Figure 2.3: Group output over time across treatments
Taking a closer look at the evolution of work performance over time in
…gure 2.3, we see that while performance is identical prior to the treatment intervention (in the pre-round), average performance is substantially higher across all periods of the experiment.13
We investigate the size and signi…cance of the performance e¤ect by run- ning three di¤erent regression speci…cations with either group output (the sum of individual outputs per group) or individual output as the dependent variable. Due to the matching procedure we control for the number of points achieved by the group or the individual in the pre-round (period 0).14
As a …rst, conservative econometric approach that preserves the indepen- dence of observations, we compute the group average over all eight periods and regress it on a treatment dummy and the pre-round performance using
13It is interesting to note that the qualitative shape of both graphs over time is quite similar, re‡ecting parallel e¤ects of learning and fatigue.
14Note that the matching of participants into homogeneous groups resulted in a very low standard deviation of outputs within the majority of groups. In the pre-round, the average standard deviation of worker output amounts to 0.71 output points. In only 6 out of 64 groups the standard deviation exceeds 1.5 output units.
only one data point per group.15 As the group observations are independent and the treatment intervention exogenous, the estimated coe¢ cient of the forced distribution dummy gives a clean estimate of the average treatment e¤ect. In the second speci…cation we use all group observations over time (i.e.
jointly achieved group points per period) and run random e¤ects regressions which include periods dummies to control for the general time trend observed in …gure 2.3. In a thirdalternative we use observations from all individual workers in all periods, again estimating a random e¤ects model. We report standard errors clustered on the group level to account for the fact that ob- servations from workers in the same group are not independent. The results are reported in table 2.3. In the left panel we run all three speci…cations using absolute output measures. In the right panel we report speci…cations with the log of output as dependent variable.
15Similar results are obtained when only using the outputs from period 1.
DependentVariable:OutputLogOutput Basevs.Fds(periods1-8)Basevs.Fds(periods1-8) OLSREREOLSRERE (Groups)(Individuals)(Groups)(Individuals) (1)(2)(3)(4)(5)(6) Fds3.197**3.197**1.066**0.0540**0.0540**0.0699*** (1.562)(1.551)(0.514)(0.0242)(0.0240)(0.0235) Pre-RoundGroupOutput0.534***0.534***0.530***0.00842***0.00842***0.0251*** (0.0550)(0.0546)(0.0531)(0.00087)(0.00086)(0.00245) Constant38.11***26.35***8.847***3.725***3.529***2.398*** (2.701)(2.540)(0.834)(0.0449)(0.0441)(0.0443) Observations645121,536645121,509 NumberofGroups/Subjects64641926464192 R2 /WaldChi2 0.68741.10723.900.69532.75523.67 Robuststandarderrorsinparentheses(in(3)and(6)clusteredongroup_id),***p<0.01,**p<0.05,*p<0.1 (1&3)Ordinaryleastsquaresregressiononcollapsedaveragegroupoutput(oneobservationpergroup) (2&4)Randome¤ectsregressiononperiodicgroupoutput (3&6)Randome¤ectsregressiononperiodicindividualoutput (2-3&5-6)Perioddummiesincluded Table2.3:Theimpactofforceddistributiononproductivity
Column 1 shows that the forced distribution indeed signi…cantly increases group performance by roughly three output units. This corresponds to a 5.6%
increase in group performance as displayed in model (4).16 The coe¢ cients obtained in the random e¤ects models parallel these results. Furthermore, in all speci…cations pre-round performance is strongly correlated with actual performance in the experiment. The estimate in column 1 suggests that groups that solved one block more in the pre-round on average solved half a block more in the experiment.
Investigating the treatment di¤erences with alternate productivity mea- sures, such as the number of blocks …nished per group and the number of correct and false answers (see table 2.12 in the appendix), we …nd that un- der forced distribution subjects count and solve more blocks correctly while making only slightly and insigni…cantly more mistakes.
To provide an even more conservative test without any distributional as- sumptions, we additionally apply the following non-parametric procedure:
Due to our matching mechanism, groups within a treatment are, by de…ni- tion, not drawn from the same population, but groups of the same rank with respect to the pre-round performance are directly comparable across treat- ments. We thus rank group observations in each treatment according to their pre-round performance from 1 to 32 and calculate the output di¤erence of each group with its counterfactual in the other treatment. E.g. the average group output of the 8th able group in the Fds condition is compared with the 8th able group in theBase condition. If there were no systematic output di¤erences across treatments, we would expect to see balanced output di¤er- ences between paired groups. However, in 21 out of 32 output comparisons output is higher in theFds groups. This di¤erence is statistically signi…cant in a one-sided binominal test (p= 0:055).17
In principle, our experimental design allows two explanations for why
16Note that in log speci…cation the coe¢ cient of 0:054 translates into an estimated incease of 5.6% ase0:054= 1:056.
17Applying the same test to test for di¤erences in pre-round performance we see that (i) in 6 out of 32 comparison groups output was exactly the same and (ii) of the remaining 26 output is higher for 13 groups inFds and 13 inBase. Hence, randomization performed very well such that ability is equally distributed across the two treatment groups (see also
…gure 2.3).
productivity increases under Fds. The observed treatment di¤erence in per- formance may be the result of subjects working harder, i.e. they solve more blocks in a given amount of time, or taking less timeouts. Investigating the choice of timeouts, we …nd that the timeout option was rarely chosen in the two core treatments. On average, only 0.7 timeouts per group were taken in each round. Furthermore, there is no systematic di¤erence in timeout usage across treatments.18 If we either control for the number of timeouts in the regression or exclude group observations in which timeouts were taken, the treatment e¤ect becomes stronger.
We also investigate whether the incentive e¤ect of forced distribution is stronger among low or high talented groups. Table 2.13 extends our stan- dard regression by an interaction termFdsx Pre-Round Group Output. The substantially larger and highly signi…cantFds coe¢ cient and the negative in- teraction term reveals that forced distribution is particularly e¤ective among low performing groups.19
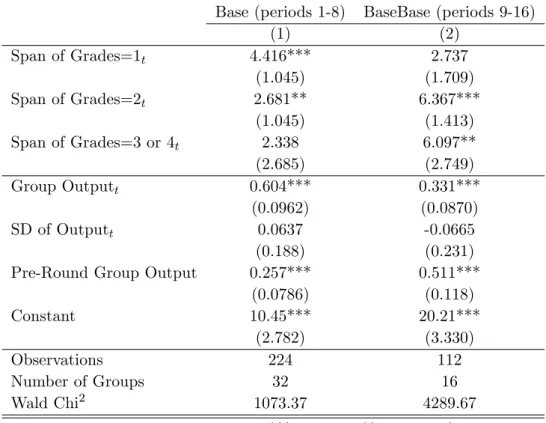
Finally, we explore the performance e¤ect of Fds in the second eight periods in the treatments BaseBase and FdsFds which allows us to check the persistence of the observed e¤ects. Applying the identical identi…cation strategy as above, we …nd rather similar results and the economic signi…cance of the e¤ect gets even stronger: The regression results displayed in table 2.14 in the appendix show that the performance di¤erence between Fds and Base amounts to 8.8% in the second part. The e¤ect is signi…cant across all regressions and also when we apply the described non-parametric procedure (p= 0:038, one-sided Binomial test).20
18In the …rst eight periods, timeouts are slightly more frequent in the Fds condition but the di¤erence is not statistically signi…cant. In the last 8 periods of the treatments BaseBase and FdsFds, timeouts are less frequently used under forced distribution. In periods 9-16 ofFds, in only 8 out of 128 group observations (period x group) at least one timeout was observed compared to 48 out of 128 in the baseline treatment. However, this di¤erence is also not signi…cant, neither in regressions, nor in non-parametric tests.
19However, the key results are qualitatively robust when we drop the four lowest groups or when we drop the 10% highest and 10% lowest performing groups.
20When only considering the BaseBase and FdsFds treatment, there is a signi…cant di¤erence in the pre-round outputs indicating that abilities are not equally distributed across treatments in this smaller sample. But as mentioned, abilities are evenly distributed when we consider the larger number of independent observations.
2.3.2 Di¤erentiation and Productivity
But why do people work harder under the forced distribution? A key con- jecture is that under the forced distribution incentives to exert e¤ort are strengthened as supervisors di¤erentiate more according to individual per- formance. We therefore analyze whether performance is rewarded di¤erently in the two treatments. In principle, supervisors can condition their grading behavior on two dimensions: they can reward absolute and relative perfor- mance. We naturally should expect that the relative rank plays a key role under the forced distribution. But even in the baseline treatment supervisors may condition their grading behavior on the employee’s relative rank in the group. However, they may do so to a smaller extent as they are not forced to di¤erentiate. In contrast, variations in absolute performance may a¤ect grading in both treatments. To investigate this, we run random e¤ects re- gressions with the bonus received in a period as dependent and the absolute output and relative rank of a worker as independent variables.21 To illustrate treatment di¤erences, we include interaction terms with a dummy variable for the forced distribution treatment.
The results are reported in table 2.4. Note that the relative rank matters in both treatments but does so to a much larger extent under forced distrib- ution as indicated by the substantially larger rank coe¢ cients in column (2) and the signi…cant interactions of rank and Fds in columns (3-4). Interest- ingly, while within-rank variation in output is rewarded in both treatments, these rewards are stronger in the baseline treatment. For a given rank, out- put and bonus are more strongly (positively) correlated than under forced distribution. This is indicated by the substantially smaller output coe¢ cient in column (2) and the signi…cant negative interaction of output and Fds in columns (3-4). But, apparently, competing for ranks generates stronger incentives in the forced distribution treatment as shown by the positive inter- action terms of ranks and Fds. The competition for ranks indeed induces a
‘tournament’among the agents. As the literature on tournaments - starting with Lazear and Rosen (1981) - has pointed out, tournament competition
21The last rank 3 is the reference group.