• Keine Ergebnisse gefunden

Electrophysiological signature of conscientiousness during task performance

N/A
N/A
Protected

Academic year: 2021

Aktie "Electrophysiological signature of conscientiousness during task performance"

Copied!
131
0
0

Wird geladen.... (Jetzt Volltext ansehen)

Volltext

(1)

conscientiousness during task performance

Inaugural-Dissertation

in der Fakultät Humanwissenschaften der Otto-Friedrich-Universität Bamberg

vorgelegt von Mike Frederic Imhof

aus

Siegen

(2)

Dekan: Universitätsprofessor Dr. Jörg Wolstein Erstgutachter: Universitätsprofessor Dr. Jascha Rüsseler Zweitgutachterin: Universitätsprofessorin Dr. Ute Schmid

URN: urn:nbn:de:bvb:473-irb-478631 DOI: https://doi.org/10.20378/irb-47863

Dieses Werk ist als freie Onlineversion über das Forschungsinfor-

mationssystem (FIS; https://fis.uni-bamberg.de) der Universität Bamberg

erreichbar. Das Werk steht unter der CCLizenz CC-BY.

(3)
(4)

Zusammenfassung

Die Forschung zur biologischen Basis der Persönlichkeit hat eine lange Tradition. Ob- wohl das populäre und weit verbreitete Fünf-Faktoren-Modell (FFM) der Persönlichkeit nicht biologisch basiert ist gibt es Hinweise darauf, dass Unterschiede in Gehirnstrukturen mit individuellen Unterschieden in Persönlichkeitsfaktoren des FFM zusammenhängen. Es gibt jedoch bisher nur wenige Untersuchungen zu Unterschieden in der aufgabenbezoge- nen Gehirnaktivität, die mit Unterschieden in Persönlichkeitsfaktoren des FFM wie bei- spielsweise der Gewissenhaftigkeit verbunden sind. Das ist überraschend, denn die Unter- suchung von Unterschieden in ereigniskorrelierten Potenzialen (EKP) im Zusammenhang mit Gewissenhaftigkeit scheint ein vielversprechender Ansatz zu sein. Das zeigen z. B.

Hinweise darauf, dass Gewissenhaftigkeit mit der Error-related negativity (ERN) zusam- menhängt.

Kognitiven Theorien zufolge sollte die Größe der ERN mit behavioralen Unterschieden zusammenhängen. Aktuelle Forschungen deuten jedoch darauf hin, dass die ERN und be- haviorale Maße zumindest teilweise unabhängig voneinander sind. Persönlichkeitseigen- schaften, psychopathologische und motivationale Faktoren scheinen Mechanismen der Generierung der ERN zu beeinflussen und so die Amplitude der ERN zu moderieren. Als Gegenstück zur ERN tritt die Correct-response negativity (CRN) nach korrekten Antwor- ten auf. Ausgehend von der Annahme, dass die CRN zumindest teilweise den gleichen kognitiven Prozess widerspiegelt, sollte auch die Amplitude der CRN durch Persönlich- keitsmerkmale und motivationale Faktoren moderiert werden.

Ich habe zwei Experimente durchgeführt, um die Auswirkungen der Gewissenhaf-

tigkeit auf das aufgabenbezogene EKP nach Fehlern und richtigen Reaktionen zu untersu-

chen. In beiden Experimenten habe ich mithilfe von einfachen Wahlreaktionsaufgaben in

unterschiedlichen Varianten die Amplituden der ERN und CRN im Zusammenhang mit

Gewissenhaftigkeit und absichtlichen Regelverletzungen untersucht. Ich beobachtete Un-

(5)

terschiede in der Amplitude der ΔERN (der Differenzamplitude von ERN und CRN) im Zusammenhang mit Gewissenhaftigkeit, die auf eine stärkere Fokussierung auf die Aufga- be und eine höhere Motivation richtig zu reagieren bei hoch gewissenhaften Personen hin- weisen könnten. Zudem beobachtete ich Unterschiede in der CRN-Amplitude, die auf ei- nen durch Gewissenhaftigkeit moderierten Responsekonflikt zurückzuführen sind. Die Ergebnisse zeigen einen Zusammenhang von Gewissenhaftigkeit und dem aufgabenbezo- genen, reaktionsbezogenen EKP.

Schließlich habe ich untersucht, ob Unterschiede im EKP als Biomarker für die Klassi- fikation von gewissenhaften Personen durch die Anwendung der linearen Diskriminanz- analyse (LDA) und der linearen Regression (LR) verwendet werden können. LDA und LR sind populäre Methoden im Bereich des maschinellen Lernens, die für die Klassifikation von single-trial und aggregierten EKP-Daten geeignet sind. Ich schlage ein Klassifikati- onsverfahren vor, das auch für die Klassifikation anderer Merkmale, die mit EKP-Daten zusammenhängen, verwendet werden kann. Sowohl LDA als auch LR, die in das Verfah- ren eingebettet sind, zeigen ihre Eignung und Nützlichkeit, indem sie die EKP-Datensätze beider Experimente neu analysieren. Die Klassifikationsperformanz wurde mittels

Kreuzvalidierung evaluiert und zeigte, dass beide Methoden erfolgreich zwischen zwei Gruppen von Individuen mit geringer und hoher Gewissenhaftigkeit unterscheiden.

Die zukünftige Forschung sollte sich auf moderierende Effekte auf die Assoziation von

Gewissenhaftigkeit und CRN und ΔERN konzentrieren.

(6)

Abstract

Research on the biological basis of personality has a long tradition. Although the popu- lar and widespread Five Factor Model (FFM) of personality is not biologically based, there is evidence that differences in brain structures are associated with individual differences in personality traits that are part of the FFM. To date, there is only sparse research on differ- ences in task-related brain activity linked with differences in FFM factors such as consci- entiousness. This is surprising because the study of differences in event-related potentials (ERPs) in the context of conscientiousness appears to be a promising approach. This is shown, for example, by evidence that conscientiousness is related to the error-related nega- tivity (ERN).

According to cognitive theories the size of the ERN should be related to variations in behavior. However, recent research indicates that the ERN and behavioral measures are at least partly unrelated. It seems evident that individual difference measures, psychopatholo- gy, and motivational factors impact mechanisms generating the ERN and therefore moder- ate the size of the ERN. The CRN is the counterpart of the ERN occurring after correct responses. Based on the assumption that the CRN is at least partly reflecting an equal cog- nitive process as the ERN, the size of the CRN should be moderated by individual differ- ence measures as well.

I conducted two experiments addressing the impact of conscientiousness on the task-

related ERP after both errors and correct responses. In both experiments, I used simple-

choice reaction tasks in different variations to investigate ERN and CRN amplitudes in

relation to conscientiousness and deliberate rule violations. I observed variations in the

ΔERN amplitude (which is the difference amplitude of ERN and CRN) related to conscien-

tiousness that might indicate a greater focus on the task and a motivational salience of cor-

rect responses. I also observed differences in the CRN amplitude that are due to response

(7)

conflict moderated by conscientiousness. The results showed an apparent association of conscientiousness and the task-related response-locked ERP.

Finally, I examined whether differences in the ERP can be used as biomarkers for the classification of conscientious individuals through the application of linear discriminant analysis (LDA) and linear regression (LR), machine learning methods popular for classifi- cation of single-trial and aggregated ERP data. I propose a classification procedure that can also be used for classification of other features related to ERP data. Both LDA and LR embedded in the procedure demonstrate their suitability and usefulness by reanalyzing the ERP datasets of both experiments. The classification performance was evaluated using cross validation and showed that both methods successfully discriminated above chance between two groups of individuals scoring low and high on a conscientiousness scale.

Future research should concentrate on moderating effects on the association of consci-

entiousness and CRN and ΔERN.

(8)

Contents

Zusammenfassung ... 4

Abstract ... 6

List of Figures ... 11

1 Introduction ... 15

1.1 The error-related negativity (ERN) ... 19

1.1.1 The ERN ... 19

1.1.2 Neuroanatomical substrates ... 19

1.1.3 Correct-response negativity ... 20

1.1.4 Theoretical approaches of the ERN ... 22

1.1.5 Association of ERN and behavior ... 26

1.1.6 ERN / CRN and individual differences ... 27

2 Performance monitoring and correct response significance in conscientious individuals ... 29

2.1 Introduction ... 29

2.2 Materials and Methods ... 31

2.2.1 Participants ... 31

2.2.2 Materials ... 31

2.2.3 Procedure ... 32

2.2.4 EEG recording and data analysis ... 34

2.3 Results ... 36

2.3.1 NEO-FFI scales ... 36

2.3.2 Behavioral data ... 38

2.3.3 ERPs ... 39

2.4 Discussion ... 45

2.4.1 Higher task engagement in conscientious individuals ... 46

2.4.2 Effects of rule violations... 49

2.4.3 Problems with the task design ... 50

(9)

2.4.4 Limitations ... 50

2.4.5 Conclusion ... 51

3 The impact of conflict on performance monitoring in conscientious individuals ... 52

3.1 Introduction ... 52

3.2 Materials and Methods ... 55

3.2.1 Participants ... 55

3.2.2 Materials ... 55

3.2.3 Procedure ... 57

3.2.4 EEG recordings and data analysis ... 60

3.3 Results ... 62

3.3.1 NEO and BIP scales ... 62

3.3.2 Behavioral data ... 63

3.3.3 ERPs ... 69

3.4 Discussion ... 78

3.4.1 Task engagement in conscientious individuals ... 79

3.4.2 Effects of rule violations... 81

3.4.3 Conclusion ... 81

4 Task-related ERPs as biomarkers for classification of conscientiousness ... 82

4.1 Introduction ... 82

4.2 Approach for classification of conscientiousness using task-related ERPs ... 85

4.2.1 Feature extraction ... 85

4.2.2 Linear classification techniques... 86

4.2.3 Logistic regression ... 89

4.3 Validation of classification models ... 90

4.3.1 Performance scoring ... 91

4.4 Implementation and Evaluation ... 95

4.4.1 Classification procedure ... 95

4.4.2 Evaluation using data from Experiment 1 ... 97

4.4.3 Evaluation using data from Experiment 2 ... 102

4.5 Discussion ... 108

4.5.1 Comparing results with former analyses ... 108

4.5.2 Proposed classification procedure ... 108

(10)

4.5.3 Limitations ... 109

4.5.4 Future improvements ... 110

4.5.5 Conclusion ... 111

5 General Discussion ... 112

5.1 Conscientiousness and task engagement ... 113

5.2 Classification of conscientiousness using task-related ERPs ... 116

5.3 Future research ... 116

5.4 Conclusion ... 117

6 Reference statement ... 118

7 References ... 119

(11)

List of Figures

Figure 1. Illustration of the error detection theory of the ERN proposed by Coles et al.

(2001) assuming a comparison process that evaluates the consistency of the representation of the actual response and the representation of the correct response. Inconsistency of both representations elicits a mismatch or error signal which is reflected by the ERN. Adapted from de Bruijn, Miedl, and Bekkering (2011). ... 23 Figure 2. Illustration of a conflict-monitoring model for the Eriksen Flanker task.

Responses are activated by corresponding stimulus processing units that correspond to the target and flanker triangles < and >. Coactivation of the mutually incompatible response units (< and >) generates the conflict. The presence of conflict is detected by the conflict- monitoring process which then signals adjustments in attention to reduce conflict in the subsequent trials. Adapted from Yeung and Nieuwenhuis (2009). ... 24 Figure 3. Illustration of the reinforcement-learning theory proposed by Holroyd and Coles (2002). A mechanism in the basal ganglia (BG) monitors the performance of a mechanism located in the anterior cingulate cortex (ACC) that maps external input into response output. An error signal is conveyed to the ACC by the midbrain dopamine system. The theory assumes that the ERN is produced by the ACC. Adapted from Holroyd and Yeung (2003). ... 26 Figure 4. Procedure of a trial. After the presentation of a blank screen (500ms), the participant is instructed by a short text (1500ms). Then the presentation of a fixation cross (500ms) follows whereafter the target stimulus is presented until the participant responds.

... 33

Figure 5. Distribution of conscientiousness scores obtained from the sample. ... 37

Figure 6. Mean error rates (A) and response times (B) for each instruction condition,

standard (STD), rule violation (RV), and rule reversal (RR). Scatter plots display the

performance as a function of conscientiousness (CS). See text for details. ... 39

Figure 7. Mean amplitudes during 20-70ms post-response interval at electrode FCz as a

function of conscientiousness for correct (CRN) and incorrect responses (ERN). The lines

resulted from regressing CRN and ERN amplitudes onto conscientiousness. ... 40

Figure 8. Mean amplitudes during 200-350ms post-response interval at electrode Cz as a

function of conscientiousness for correct (Pc) and incorrect responses (Pe). The lines

resulted from regressing Pc and Pe amplitudes onto conscientiousness. ... 41

Figure 9. Response-locked ERPs for correct responses at electrode FCz for both

conscientiousness (CS) groups separated by instruction conditions. The three panels show

the ERPs of standard (STD), rule violation (RV), and rule reversal (RR) conditions,

(12)

respectively. Color-shaded areas indicate the 95% confidence intervals for the mean ERPs.

Gray-shaded areas mark the time windows of CRN and Pc. ... 43

Figure 10. Z-transformed voltage distributions during response-locked ERP after correct

responses in a time window of 30-50ms. The upper and lower heads show distributions of

participants scoring high and low on conscientiousness (CS), respectively. The

distributions of each group are displayed separately by column for the instruction

conditions standard (STD), rule violation (RV) and rule reversal (RR). ... 43

Figure 11. Z-transformed voltage distributions during response-locked ERP after correct

responses in a time window of 200-300ms. The upper and lower heads show distributions

of participants scoring high and low on conscientiousness (CS), respectively. The

distributions of each group are displayed separately by column for the instruction

conditions standard (STD), rule violation (RV) and rule reversal (RR). ... 44

Figure 12. Procedure of a trial. The following screens were presented in the order they are

mentioned including their presentation durations in the following: blank screen (1000ms),

instruction (500ms), fixation cross (500ms), flanker stimuli (50ms) and flanker stimuli

combined with target stimulus (until response). ... 58

Figure 13. Distribution of conscientiousness t-scores obtained from sample of Experiment

2. ... 63

Figure 14. Mean error rates are displayed separately for each instruction condition,

standard (STD), rule violation (RV), and rule reversal (RR) splitted by congruency

condition (congruent, incongruent). Scatter plots overlaying each boxplot display the error

rate as a function of conscientiousness (CS), the extent of which is represented by color

intensity (high CS values are represented by low color intensity). ... 64

Figure 15. Mean response times are displayed separately for each instruction condition,

standard (STD), rule violation (RV), and rule reversal (RR) splitted by congruency

condition (congruent, incongruent). Scatter plots overlaying each boxplot display the

response time as a function of conscientiousness (CS), the extent of which is represented

by color intensity (high CS values are represented by low color intensity). ... 66

Figure 16. Mean PES in ms from standard instruction condition is displayed separately for

each congruency condition (congruent, incongruent) separated by rule group, rule violation

(RV), and rule reversal (RR). Scatter plots overlaying each boxplot display the PES as a

function of conscientiousness (CS), the extent of which is represented by color intensity

(high CS values are represented by low color intensity). ... 68

Figure 17. Response-locked ERP at electrode FCz after errors in incongruent standard

trials separated by levels of conscientiousness (CS; low, high). Shaded areas indicate the

95% confidence interval of the mean ERPs. ... 70

Figure 18. Response-locked ERP at electrode FCz following correct responses in standard

(STD) instruction condition as well as alternative instruction conditions rule violation (RV)

and rule reversal (RR) separated by levels of conscientiousness (CS; low, high) and

congruency (congruent, incongruent). For the purpose of illustration low and high

conscientiousness groups were formed according to the sample selection. ... 71

(13)

Figure 19. Z-transformed voltage distributions during response-locked ERP after correct responses in a time window of 10-40ms. The upper and lower heads show distributions of participants scoring high and low on conscientiousness (CS), respectively. The distributions of each group are displayed separately by column for the combinations of instruction conditions, i.e. standard (STD) and alternative (ALT), and congruency type, i.e.

congruent and incongruent. ... 72 Figure 20. Mean amplitude during 0-70ms post-response time interval of the response- locked ERP after correct responses at electrode FCz. The mean amplitudes of individuals scoring low (A) and high (B) on conscientiousness (CS) scale are separately depicted for instruction conditions (STD, ALT) and congruency (congruent, incongruent). Error bars indicate standard error. ... 74 Figure 21. Z-transformed voltage distributions during response-locked ERP after correct responses in a time window of 90-110ms. The upper and lower heads show distributions of participants scoring high and low on conscientiousness (CS), respectively. The distributions of each group are displayed separately by column for the combinations of instruction conditions, i.e. standard (STD) and alternative (ALT), and congruency type, i.e.

congruent and incongruent. ... 75 Figure 22. Mean amplitude during 80-150ms post-response time interval of the response- locked ERP after correct responses at electrode Cz. The mean amplitudes of individuals scoring low (A) and high (B) on conscientiousness (CS) scale are separately depicted for instruction conditions (STD, ALT) and congruency (congruent, incongruent). Error bars indicate standard error. ... 77 Figure 23. Exemplary visualization of spatio-temporal features that consist of a matrix with signed-r² values of low- minus high-CS averaged ERPs. The matrix is displayed as color coded matrix. ... 86 Figure 24. A schematical illustration of the classification procedure that was used for ERP data from Experiment 1. The experiment consisted of a choice reaction task where participants during standard (STD) condition had to respond to a circle by pressing the left key and to a square by pressing the right key. In two other conditions participants had to either violate (RV) or reverse this rule (RR). EEG was recorded throughout the experiment. In this illustration only the electrode FCz is shown (A). Other electrodes are schematically indicated by different superimposed levels. The continuous signal was split into response-locked epochs (B). The raw EEG from electrode FCz is shown over a period of 8s, the rectangles show a 800ms epoch, beginning 100ms before the response. Separate averages were then computed for the three different segment types (C). After that Pearson r-values of conscientiousness and averaged response-locked ERPs were calculated for the spatio-temporal features and were displayed as color coded matrix (D). The matrix was used to determine time windows for averaging the voltage values for each electrode (E).

The averaged spatio-temporal features were finally used for classification learning (F). .. 94

Figure 25. Visualization of the r-matrices. Pearson r-values of conscientiousness and

averaged response-locked ERPs were calculated for the spatio-temporal features and

displayed as a color coded matrix for each instruction condition (A: Standard, B: Rule

violation, C: Rule reversal) of Experiment 1. Time intervals that are indicated by a dashed

line were selected by application of a heuristic that aims to ensure having accumulated

(14)

high r-values and an approximately constant spatial pattern of r-values in each time interval. The areas that are bounded by a continuous line indicate significant r-values (p <

.05) and help to identify suitable time intervals for classification learning. ... 98 Figure 26. Performance as mean accuracy of linear discriminant analysis (LDA) with shrinkage of the covariance matrix and logistic regression (LR) for each instruction condition standard (STD), rule violation (RV) and rule reversal (RR) of Experiment 1.

Mean accuracy values are aggregated for 10 iterations of 6-fold cross validations. Error

bars indicate the standard deviation... 100

Figure 27. Performance as receiver operating characteristics (ROCs) of linear discriminant

analysis (LDA) with shrinkage of the covariance matrix and logistic regression (LR) for

each instruction condition standard (STD), rule violation (RV) and rule reversal (RR) of

Experiment 1. ROC curves are displayed and area under the curve (AUC) values are

calculated for each iteration step. ... 101

Figure 28. Visualization of the r-matrices. Pearson r-values of conscientiousness and

averaged response-locked ERPs were calculated for the spatio-temporal features and were

displayed as a color coded matrix for each combination of instruction and congruency

condition (A: Standard congruent, B: Standard incongruent, C: Alternative instruction

congruent, D: Alternative instruction incongruent) of Experiment 2 (Note: Rule violation

and rule reversal instruction condition were taken together because there were no

significant differences between both conditions). Time intervals that are indicated by a

dashed line were selected by application of a heuristic that aims at ensuring to have

accumulated high r-values and an approximately constant spatial pattern of r-values in each

time interval. The areas that are bounded by a continuous line indicate significant r-values

(p < .05) and help to identify suitable time intervals for classification learning. ... 103

Figure 29. Performance of linear discriminant analysis (LDA) with shrinkage of the

covariance matrix and logistic regression (LR) for each combination of instruction

condition (standard, STD; alternative instruction, ALT) and congruency condition

(congruent, incongruent) of Experiment 2. Mean accuracy values are aggregated for 10

iterations of 6-fold cross validations. Error bars indicate the standard deviation. ... 105

Figure 30. Performance as receiver operating characteristics (ROCs) of linear discriminant

analysis (LDA) with shrinkage of the covariance matrix and logistic regression (LR) for

each combination of instruction condition (standard, STD; alternative instruction, ALT)

and congruency condition (congruent, incongruent) of Experiment 2. ROC curves are

displayed and area under the curve (AUC) values are calculated for each iteration step. 106

(15)

1 Introduction

The notion that individual differences in personality have a physiological basis has a long tradition. Philosophers of ancient Greece supposed that personality was influenced by various fluids, so-called humors, in the body. According to the Greek physicians Hippocra- tes and Galen, there were four main humors, each contributing to the constitution of per- sonality and, depending on their distribution, emphasizing a particular pattern of personali- ty. This idea remained popular during medieval times, and even influential in modern re- search. The famous Russian psychologist and physiologist Ivan Pavlov suggested that there were four basic kinds of temperament which he believed to have observed in dogs. Alt- hough he never tried to study the temperament types in humans, he believed that there were parallels between humans and dogs and that the temperament types observed in dogs also applied to humans. In recent times, researchers have tried to study Pavlovs tempera- ment types in humans developing self-report questionnaire scales for this purpose (Strelau, Angleitner, Bantelmann, & Ruch, 1990). Their results indicated similarities between char- acteristics of Pavlov’s temperament types and characteristics associated with the four hu- mors (Ruch, 1992). However, the results are rather descriptive and do not allow indications for biological causes of individual differences.

Modern approaches try to fill this lack of understanding and focus on the biological causes of individual differences. Many researchers have focused on neurotransmitters (e.g.

Cloninger, 1987; Cloninger, Przybeck, Svrakic, & Wetzel, 1994). For instance, according

to Cloninger’s theory, high levels of dopamine are associated with high levels of novelty

seeking, high levels of serotonin are associated with low levels of harm avoidance, and

high levels of norepinephrine are associated with low levels of reward dependence. Other

influential modern approaches on biological causes of individual differences examine vari-

ous structures in the brain. Some researchers have suggested that individual differences in

personality are linked to complex interactions among different regions of the brain.

(16)

A famous approach is the arousal hypothesis of Eysenck (1967, 1990). Central to Ey- senck’s theory is the ascending reticular activating system (ARAS). According to this ap- proach, this system is located in the brain stem, where the spinal cord meets the brain it- self. It works like a filter to regulate the level of arousal in the brain and hence ensures an effective functioning of the individual. There are certain conditions that increase the arous- al, e.g. when an individual is excited by listening to an activating piece of music or concen- trating intensely on solving a difficult task. And there are other conditions under which the level of arousal is reduced, e.g. at bedtime when an individual is trying to fall asleep. Ey- senck (1967) proposed that introverts have higher levels of activity or a lower threshold of arousal in the ARAS than extraverts. Following this arousal hypothesis, it is due to physio- logical processes regulated by the ARAS that introverts react with greater responsiveness than extraverts. Because introverts experience more arousal due to higher level of ARAS activity, they should react earlier and to a greater extent than extraverts to various forms of external stimulation. In line with this perspective, studies show that introverts seek for sit- uations with low stimulation to keep their already heightened level of ARAS activity in balance. In contrast, extraverts need to increase their already low level of arousal (Beauducel, Brocke, & Leue, 2006; Claridge, Donald, & Birchall, 1981). There is evidence that supports the arousal hypothesis proposing a relationship between introver- sion/extraversion and the ARAS (Geen, 1984; for a review see Eysenck, 1990; Matthews

& Gilliland, 1999; Stelmack, 1990), including studies where the cortical arousal is meas- ured by electroencephalogram (EEG; Knyazev et al., 2002) and positron emission tomog- raphy (Johnson et al., 1999).

Another influential theory describing brain structures that are associated with individu-

al differences in personality was proposed by Gray (1972, 1990) called reinforcement sen-

sitivity theory. On an abstract level, the theory assumes two biological systems in the

brain: The first system is the Behavioral Approach System (BAS) which is responsive to

rewarding stimuli. As soon as the BAS recognizes a stimulus as potentially rewarding,

approaching behavior is activated. For example, when you hear your favorite song on the

radio, the BAS causes increased attention to the song and it may create the urge to turn up

the radio (approach motivation). The other system is the Behavioral Inhibition System

(17)

(BIS). When activated, it increases the sensitivity to punishing stimuli and regulates behav- ior for avoidance of the stimuli. For example, when confronted with an unpleasant situa- tion that you fear, the BIS causes the internal creation of a plan to avoid confronting with this situation. According to the reinforcement sensitivity theory, individuals differ in the sensitivity of their BIS or BAS system. Individuals with a reactive BIS system have a higher sensitivity to cues of punishment, frustration or novelty, and they are especially vulnerable to unpleasant emotions such as anxiety, fear or sadness. On the other hand, in- dividuals with a reactive BAS system have a higher sensitivity to cues of reward, and they are especially responsive to positive emotions. The ability to inhibit behavior decreases in individuals with a reactive BAS when approaching a stimulus. Following the reinforce- ment sensitivity theory, the BIS system determines the personality dimension anxiety whereas the BAS system is responsible for the personality dimension of impulsivity.

The models outlined above describe how individual differences in certain personality traits can be explained by biological bases. However, the models do not provide explana- tions what physiological bases may underlie individual differences in other personality traits that are part of common models of personality, e. g. the Five Factor Model (FFM;

Costa & McCrae, 1992). What also remains unachieved, is a detailed understanding of the

physiological systems and mechanisms that influence individual differences in specific

personality dimensions. In recent research on personality, biological approaches addressing

such mechanisms were most commonly investigated by taking measures of electrodermal

activity, cardiovascular reactivity and brain activity obtained from methods like electroen-

cephalogram (EEG) or functional magnetic resonance imaging (fMRI). EEG plays an im-

portant role, but investigations of associations with personality traits and individual differ-

ences in the event-related potential (ERP), which describes voltage fluctuations in the on-

going EEG that are time-locked to an event (e.g. the execution of the response or onset of

the stimuli), are relatively sparse. There is some evidence that personality traits may be

associated with individual changes in the ERP. For instance, the amplitude of P3 (which is

a component of the ERP and is related to task-relevant infrequent changes in the stimuli) is

weakly associated with individual differences in extraversion (see e.g. Beauducel et al.,

2006; Ditraglia & Polich, 1991; Polich & Martin, 1992). Extraversion is part of the FFM of

(18)

personality which received growing acceptance from a psychometric point of view in past decades. The FFM incorporates extraversion and neuroticism, which are similar to two of Eysenck’s dimensions, together with conscientiousness, openness to experience and agree- ableness (Costa & McCrae, 1992). Taking a closer look at theoretical and empirical ap- proaches, there have been very few studies examining the physiological basis of conscien- tiousness.

The present work addresses the question whether there is an electrophysiological signa- ture that is related to conscientiousness. For this purpose, I wanted to study components of the ERP that are related to task performance. These components include the error-related negativity (ERN; Falkenstein, Hohnsbein, Hoormann, & Blanke, 1990, 1991; Gehring, Coles, Meyer, & Donchin, 1990; Gehring, Goss, Coles, Meyer, & Donchin, 1993) accom- panying errors and the correct-response negativity (CRN; Falkenstein, Hoormann, Christ,

& Hohnsbein, 2000; Ford, 1999; Vidal, Hasbroucq, Grapperon, & Bonnet, 2000) accom- panying correct responses in the performance of choice-reaction tasks. It is of particular interest to observe conscientious individuals in situations where they are forced to do something they would not do under common circumstances, e.g. when they are forced to violate rules they have internalized previously. Rule violations have been shown to evoke a higher response conflict in individuals (Jusyte et al., 2017; Pfister, Wirth, Schwarz, Stein- hauser, & Kunde, 2016; Wirth, Pfister, Foerster, Huestegge, & Kunde, 2016).

The present thesis first introduces the ERN and CRN and significant ERP components

that are related to them. It then continues with two studies trying to observe individual dif-

ferences in the ERP that might be associated with conscientiousness. The first study tries to

examine whether conscientiousness is a correlate of ERN and CRN or both. The second

study was aimed to reproduce results from the first study and take a closer look at the indi-

vidual differences in the ERP associated with conscientiousness. Finally, I try to detect a

signature of conscientiousness in the data recorded from both studies applying established

methods of machine learning, linear discriminant analysis and logistic regression.

(19)

1.1 The error-related negativity (ERN)

This section describes the the ERN/CRN and related ERP-components. Recent theoret- ical approaches that have been proposed to explain the ERN are reviewed. The section closes with a description of what is already known about variations in the ERN/CRN and factors that cause them.

1.1.1 The ERN

The ERN (Gehring et al., 1990; Gehring et al., 1993) which is also referred to as error negativity (Ne; Falkenstein et al., 1990, 1991) is a response-locked negative deflection of the ERP that can be observed after the commission of an error. It occurs within 100ms fol- lowing erroneous responses and its scalp distribution is maximal at midline frontocentral scalp locations. It is assumed to represent the activity of a generic and modality independ- ent response monitoring system as it is observed across stimulus (e.g. Falkenstein et al., 1991; Gehring et al., 1993) and response modalities (e.g. Holroyd, Dien, & Coles, 1998) and also across different levels of task difficulty (e.g. Falkenstein et al., 2000). The ERN is followed by the error positivity (Pe), a positive deflection that is usually peaking around 150-350ms after response onset at parietal scalp locations (Falkenstein et al., 1991; Over- beek, Nieuwenhuis, & Ridderinkhof, 2005). It is believed to reflect error awareness (Stein- hauser & Yeung, 2010) or confidence about response correctness (Boldt & Yeung, 2015).

1.1.2 Neuroanatomical substrates

The ERN is suggested to originate in the anterior cingulate cortex (ACC). This assump-

tion is derived from application of different techniques like source localization (Dehaene,

Posner, & Tucker, 1994; Holroyd et al., 1998; Pizzagalli, Peccoralo, Davidson, & Cohen,

2006; Rüsseler, Kuhlicke, & Münte, 2003), magnetoencephalography (Miltner et al.,

2003), time-frequency analyses (Luu, Tucker, & Makeig, 2004; Trujillo & Allen, 2007),

and intracerebral recording (Brázdil, Roman, Daniel, & Rektor, 2005). With its intercon-

nections to limbic and prefrontal areas, the ACC responds to cognitive conflict and affec-

tive aversive information (Bush, Luu, & Posner, 2000).

(20)

Activation of the ACC is observed in situations involving response conflict, negative feedback, pain, and error. Therefore, the ERN is thought to reflect a functional interaction of cognitive and affective processes during detection of errors (Hajcak & Foti, 2008;

Hajcak, Moser, Yeung, & Simons, 2005; Hajcak, Nieuwenhuis, Ridderinkhof, & Simons, 2005; Luu, Collins, & Tucker, 2000; Luu, Flaisch, & Tucker, 2000; Luu, Tucker, Derry- berry, Reed, & Poulsen, 2003). There are two functional subdivisions in the ACC, both of which might generate the ERN. The dorsal and rostral subdivisions have been linked to cognitive and affective processes, respectively (Bush et al., 2000). Studies using fMRI and source localization have indicated that the ERN is generated by the dorsal ACC supporting the notion that the ERN reflects more cognitive processes, while other studies have found the rostral ACC to be the principal generator of the ERN supporting the notion that the ERN is linked to affective processes (Ridderinkhof, Ullsperger, Crone, & Nieuwenhuis, 2004; Taylor, Stern, & Gehring, 2007).

There is evidence that lateral prefrontal cortex also critically contributes to error moni- toring processes (Carter et al., 1998; Gehring & Knight, 2000; Turken & Swick, 2008;

Ullsperger & Cramon, 2006). The ability to process errors is associated with balancing of internal representations of task instructions and goals which is depending on structures such as the PFC (Weinberg, Riesel, & Hajcak, 2012).

There are dopaminergic neuron innervations in the ACC (Allman, Hakeem, Erwin, Nimchinsky, & Hof, 2001). The views that dopamine is related to reward are consistent with theoretical accounts suggesting that the ERN displays dopaminergic disinhibition of ACC neurons when the outcome of actions is evaluated as worse than predicted (Holroyd

& Coles, 2002).

1.1.3 Correct-response negativity

Correct responses often trigger a negativity that has an equal latency in the response-

locked waveform as the ERN but with a smaller amplitude (Falkenstein et al., 2000; Ford,

1999; Vidal et al., 2000). Both components have a similar topography (Luu, Flaisch et al.,

2000; Vidal et al., 2000) and presumably the same source in the ACC (Roger, Bénar, Vi-

(21)

dal, Hasbroucq, & Burle, 2010). Their waveforms are strikingly similar, particularly in individual subject data (Swick & Turken, 2002). The component is called correct-response negativity (CRN; Ford, 1999). Of note, ERN is much larger on error trials than CRN on correct trials.

It has also been shown that partial errors (i.e. when subjects initiated an incorrect re- sponse but self-corrected before errors were committed or correct responses that are per- ceived as errors by the participant) can generate a component that is equal to the ERN in terms of its amplitude (Burle, Roger, Allain, Vidal, & Hasbroucq, 2008; Carbonnell & Fal- kenstein, 2006; Gehring et al., 1993; Scheffers, Coles, Bernstein, Gehring, & Donchin, 1996). On a flanker task where e.g. stimuli consist of arrows, incongruent stimuli (i.e. tar- get arrow points to a different direction than the surrounding arrows, e.g. “<<><<”; task:

respond to the central stimulus: > right key, < left key) elicit a larger CRN than congruent stimuli (i.e. central and surrounding arrows pointing to the same direction, e.g. “<<<<<”;

Bartholow et al., 2005). CRN is largest when the presented trial type was different than expected (i.e. when an incongruent trial appeared while a congruent trial was expected).

This observation showed that changes in CRN amplitude from trial to trial not only reflect response conflict but also strategic conflict. According to control models (Kerns et al., 2004; Ridderinkhof et al., 2004) either type of conflict is sufficient to elicit a signal from the ACC to the prefrontal cortex (PFC) indicating that an increase in attention is required.

Trials directly preceding errors had a characteristic positivity just following the CRN.

This error-preceding positivity (EPP) can be interpreted as disengagement of the ACC from the response monitoring process (Ridderinkhof, Nieuwenhuis, & Bashore, 2003).

It has been observed that an inverse relationship between the probability of committing an error and the magnitude of the CRN exists (Allain, Carbonnell, Falkenstein, Burle, &

Vidal, 2004). Larger CRN amplitudes may have a preventive function against errors and the magnitude of CRN may indicate the extent of engagement of monitoring on correct trials (Simons, 2010).

Due to their similarities some authors assume that ERN and CRN are not distinct com-

ponents but reflect an identical cognitive control process during response monitoring that is

(22)

specifically enhanced on error trials (Burle et al., 2008; Meckler et al., 2011; Suchan, Jo- kisch, Skotara, & Daum, 2007). However, there is also evidence that ERN and CRN are distinct, i.e. reflecting different processes (Vocat, Pourtois, & Vuilleumier, 2008;

Yordanova, Falkenstein, Hohnsbein, & Kolev, 2004). Another perspective is that both components reflect the combined activity of two underlying processes each reflecting dif- ferent aspects of performance monitoring (Endrass, Klawohn, Gruetzmann, Ischebeck, &

Kathmann, 2012).

1.1.4 Theoretical approaches of the ERN

Several theories explaining the functional significance of the ERN have been proposed.

Three of them are described in this chapter: Error detection theory, conflict monitoring theory and reinforcement learning theory.

1.1.4.1 Error detection theory

As one of the earliest approaches, error detection theory assumes a comparator system that constantly evaluates the mental representations of the correct and the actual response.

According to this theory the ERN is elicited in case of a mismatch between both represen- tations (e.g. Bernstein, Scheffers, & Coles, 1995; Coles, Scheffers, & Holroyd, 2001;

Falkenstein et al., 1991) and corrective or compensating actions are initiated. The compari- son process is illustrated in Figure 1. Errors are caused by impulsive responses due to in- complete stimulus processing. The approach was challenged by observations of the CRN in absence of an error or an obvious response conflict (Vidal, Burle, Bonnet, Grapperon, &

Hasbroucq, 2003) leading to an adaptation of the error detection theory in which ERN and

CRN reflect the comparison process itself rather than its outcome. In this process, the ERN

indicates the comparison process in combination with an additional error signal which may

be unique to error trials (Falkenstein et al., 2000).

(23)

Figure 1. Illustration of the error detection theory of the ERN proposed by Coles et al. (2001) as- suming a comparison process that evaluates the consistency of the representation of the actual re- sponse and the representation of the correct response. Inconsistency of both representations elicits a mismatch or error signal which is reflected by the ERN. Adapted from de Bruijn, Miedl, and Bek- kering (2011).

1.1.4.2 Conflict monitoring theory

An alternative explanation of the occurrence of the ERN is provided by conflict moni- toring theory. It accounts for the computational implausible fact that if there was a com- parator successfully checking whether the response was correct or not, it had to have the information about the correct response representation. Thus, the comparator would have access to information outside of the response monitoring system. The question then arises why the correct response was not executed, if this system had information about the in- tended (correct) response. The conflict monitoring approach assumes a response conflict (a concurrent activation of multiple competing responses) that is triggered by typical choice tasks and signals the need for increased control (Botvinick, Braver, Barch, Carter, & Co- hen, 2001; Carter et al., 1998; Yeung, Botvinick, & Cohen, 2004) and gives rise to the ERN. Response conflict can also be observed on a behavioral level when participants often correct their errors, although they were not instructed to do so (Fiehler, Ullsperger, &

Cramon, 2005).

The time course of the ERN amplitude and its sensitivity to several experimental ma-

nipulations were simulated by models based on the conflict monitoring theory (Yeung et

al., 2004). Conflict models were also used to simulate performance in a wide variety of

tasks (Botvinick et al., 2001). These computational models of the conflict monitoring ap-

proach (see Figure 2) use parallel distributed processing networks to model response selec-

tion. According to these models, response conflict is defined as the Hopfield energy of the

response units. In a simple two-choice task, this energy is calculated as twice the product

(24)

of the activation of two response units, weighted by the strength of the inhibitory connec- tions among responses (e.g. Botvinick et al., 2001; Yeung et al., 2004).

The conflict-monitoring approach hypothesizes that the conflict is monitored by the ACC (Carter & van Veen, 2007; Yeung et al., 2004). When the ACC detects increased conflict, projections to prefrontal cortex signals the need for adjustments in cognitive con- trol (Botvinick et al., 2001; Carter et al., 1998; Yeung et al., 2004). There is evidence that dorsolateral prefrontal cortex activity on subsequent trials and post-error slowing is associ- ated with ACC activity following errors (Kerns et al., 2004; van Veen & Carter, 2006). In addition, data from neuroimaging studies indicated ACC activity on both error trials and correct trials with incongruent stimuli eliciting high levels of response conflict (Botvinick, Nystrom, Fissell, Carter, & Cohen, 1999; Carter et al., 1998; MacDonald, Cohen, Stenger,

& Carter, 2000).

Figure 2. Illustration of a conflict-monitoring model for the Eriksen Flanker task. Responses are

activated by corresponding stimulus processing units that correspond to the target and flanker tri-

angles < and >. Coactivation of the mutually incompatible response units (< and >) generates the

conflict. The presence of conflict is detected by the conflict-monitoring process which then signals

adjustments in attention to reduce conflict in the subsequent trials. Adapted from Yeung and Nieu-

wenhuis (2009).

(25)

However, there are some studies that question the conflict monitoring approach. Car- bonnell and Falkenstein (2006), for instance, measured no difference in the size of the ERN magnitude when comparing a correct response with a previous more forceful error in one case and a previous less forceful error in the other. Similarly, Masaki and colleagues (2007) found no difference in the ERN amplitude between two trial types, although they measured a greater conflict in the more difficult one using electromyography. A study of Burle and coworkers (2008) was based on simulations establishing the amount of response conflict during two conditions where the ERN amplitudes are compared. According to their simulations there is less response conflict when the interval between an error and the error correction is long than when both responses occur close together. However, the au- thors observed a contrasting pattern consisting of a smaller ERN amplitude when the inter- val between error and correction was short than when it was long.

1.1.4.3 Reinforcement learning theory

According to reinforcement learning theory (RL-ERN) an error signal is produced by monitoring mechanisms and is triggered when events occur that violate the expectations.

These expectations associated with a response are formed by prior reinforcements. In an

early learning phase errors may occur because the system has not yet learnt the stimulus-

response-consequence (S-R-C) contingencies. In this stage, the system needs external

feedback to evaluate its performance (i.e. determine whether it is good or bad). After S-R-

C associations are strengthened, errors can be detected as soon as a response occurs and

without help by external feedback. The location of this monitoring mechanism assumingly

is in the basal ganglia (see Figure 3). An error signal is conveyed to the ACC by the mid-

brain dopamine system. In the ACC the signal is used to increase task performance by in-

fluencing how control over the motor system is allocated to different competing systems in

the brain (Holroyd & Coles, 2002; Holroyd, Yeung, Coles, & Cohen, 2005).

(26)

Figure 3. Illustration of the reinforcement-learning theory proposed by Holroyd and Coles (2002).

A mechanism in the basal ganglia (BG) monitors the performance of a mechanism located in the anterior cingulate cortex (ACC) that maps external input into response output. An error signal is conveyed to the ACC by the midbrain dopamine system. The theory assumes that the ERN is pro- duced by the ACC. Adapted from Holroyd and Yeung (2003).

1.1.5 Association of ERN and behavior

According to RL-ERN as well as conflict monitoring accounts, variation in the ampli- tude of the ERN is associated with current behavior and the ERN itself serves to form sub- sequent behavior. Adaptive responses to errors, like post-error slowing, are behavioral ad- justments to improve task performance (Holroyd et al., 2005; Holroyd & Coles, 2002).

Post-error slowing is assumed to reflect an increase in response caution in order to increase the probability of correct response in a subsequent trial at the expense of response speed.

However, the relationship between variation in the ERN and behavioral measures still re-

mains unclear because multiple instances exist in which variation in the ERN occurs alt-

hough behavioral differences are absent (for a review see Weinberg et al., 2012). While the

mechanisms responsible for the generation of the ERN appear to be similar across individ-

uals, there is evidence that the ERN amplitude is moderated by situational, motivational

and affective processes, as well as more stable traits that differ inter-individually. There is

substantial evidence that the functional significance of variation in the ERN is related to

dispositional characteristics (Weinberg et al., 2012). Neither RL-ERN nor conflict moni-

(27)

toring theories adequately explain the individual differences that have been observed in the ERN.

1.1.6 ERN / CRN and individual differences

The ERN amplitude seems to be affected by motivational salience. It is enhanced when error significance is emphasized, either through task instructions that stress accuracy over speed (Falkenstein et al., 2000; Gehring et al., 1993), external performance evaluation (Hajcak, Moser et al., 2005; Kim, Iwaki, Uno, & Fujita, 2005), or incentives (Chiu &

Deldin, 2007; Endrass et al., 2010; Ganushchak & Schiller, 2008; Hajcak, Moser et al., 2005; Pailing & Segalowitz, 2004; Riesel, Weinberg, Endrass, Kathmann, & Hajcak, 2012).

Amplitude of the ERN also appears to be increased in individuals who experience er- rors as more aversive than other individuals. A recent meta-analysis suggests that a larger ERN is related to anxiety, specifically apprehension/worry, while a larger CRN is not reli- ably associated with anxiety (Moser, Moran, Schroder, Donnellan, & Yeung, 2013). En- hanced ERN amplitude has been also observed in individuals with obsessive-compulsive disorder (OCD; e. g. Endrass et al., 2010; Endrass, Klawohn, Schuster, & Kathmann, 2008;

Gehring, Himle, & Nisenson, 2000; Johannes et al., 2001; Riesel, Endrass, Kaufmann, &

Kathmann, 2011; Ruchsow et al., 2005). ERN is also positively related to symptom severi- ty in OCD patients (Gehring et al., 2000). Healthy individuals scoring high in emotionality and negative affect (e.g. anxiety and fear; Luu, Collins et al., 2000) or with increased scores on the Behavioral Inhibition System scale are also characterized by enhanced ERN amplitudes (Boksem, Tops, Wester, Meijman, & Lorist, 2006). During tasks that penalize error responses, reduced ERN amplitudes are associated with low scores on trait socializa- tion (Dikman & Allen, 2000) indicating a smaller sensitivity to punishment.

ERN amplitude has also been shown to vary with personality dispositions. Motivation-

al manipulations that impact ERN amplitude may be moderated by personality traits (Pail-

ing & Segalowitz, 2004). As an example, Olvet and Hajcak (2011) observed that the im-

pact of sad mood on ERN amplitude is moderated by neuroticism.

(28)

In a recent review, Weinberg et al. (2012) assumed that a reduced ERN, related to ex- ternalizing traits and psychopathology, may reflect motivational disengagement, disinhibi- tion, and decreased conscientiousness. Furthermore, enhanced ERN may reflect character- istics that are common to anxiety disorders such as perfectionism, concern over errors, negative affect and increased intolerance of uncertainty. These characteristics may have a strengthening effect on error significance. Poorer performance and smaller ERN may therefore both be caused by task disengagement and motivational deficits, whereas larger ERNs maybe linked to increased motivational significance of errors.

To date, the relationship of individual differences and CRN amplitude has not been ex- plored in detail. There is evidence that ERN and CRN amplitudes are larger in participants with obsessive-compulsive characteristics (Hajcak & Simons, 2002) and bilinguals (Kałamała, Drożdżowicz, Szewczyk, Marzecová, & Wodniecka, 2018) indicating differ- ences in task strategy and higher task engagement.

Additionally, while there is a huge body of research concerned with the relationship of

psychopathology and other individual differences with ERN, there are only a few studies

examining the role of personality traits, especially conscientiousness, in the generation of

the ERN amplitude. Hill, Samuel, and Foti (2016) found that at low levels of conscien-

tiousness, negative urgency (i.e. impulsivity in connection with negative affect) had a posi-

tive impact on the magnitude of the ERN. Pailing and Segalowitz (2004) observed that

individuals higher on conscientiousness were characterized by smaller motivation-related

changes in the ERN across monetary incentives.

(29)

2 Performance monitoring and correct response significance in conscientious individuals

2.1 Introduction

In Experiment 1, I wanted to examine whether conscientiousness is related to an in- creased motivational salience of an error and whether individuals scoring high on a consci- entiousness scale display a stronger task engagement than individuals with low levels of conscientiousness. Increased motivational salience is associated with enhanced ERN and accompanied with increased error significance and stronger task engagement (Weinberg et al., 2012). Individuals scoring high on conscientiousness may thus have a larger ERN or even a larger CRN amplitude.

Furthermore, I wanted to investigate the relationship of rule violations and medial- frontal response-locked ERPs. The ERN appears to elicit after slips during unwilled ac- tions but not after mistakes during willed actions (Stemmer, Witzke, & Schönle, 2001).

However, violating a rule may evoke a higher response conflict in individuals (Jusyte et

al., 2017; Pfister, Wirth, Schwarz, Steinhauser et al., 2016; Wirth et al., 2016) and stronger

response conflict is associated with a larger magnitude of ERN and CRN (Bartholow et al.,

2005). According to conflict monitoring accounts, violating a rule could be reflected by

variations in the magnitude of ERN and CRN. I wanted to determine whether there is an

enhanced CRN when violating a rule compared to rule compliant behavior. Especially par-

ticipants with high levels of conscientiousness may have a higher response conflict when

they are forced to violate a rule and may thus have an even more enhanced CRN during

rule violations.

(30)

In the present study, a choice reaction task establishing a rule with clear S-R contin- gency was designed. Participants had to respond to a circle by pressing the left key, to a square by pressing the right key. In two other conditions participants had to either violate or reverse this rule. It is particularly significant that the S-R mapping was the same in both alternative conditions. The only way to follow the instructions and violate the rule was doing the opposite as in the standard condition, i.e. pressing the left key when a square occurred, pressing the right key when a circle appeared. The alternative conditions allowed me to compare rule-consistent with rule-violation behavior. Importantly, both alternative conditions required the same response. If there was a behavioral or electrophysiological effect of rule violations it should have an impact on the difference in response times and error rates and the response-locked medial-frontal ERP. To examine the relationship of conscientiousness with response monitoring, the conscientiousness scale of the NEO Five Factor Inventory was administered (NEO-FFI; Borkenau & Ostendorf, 2008) to the sam- ple.

I expected generally prolonged RTs and higher error rates for rule violations compared

to rule-compliant behavior. The medial-frontal response-locked ERP during rule violations

in both erroneous and correct responses presumably show an accentuated negativity in a

time window of 0-100ms (corresponding to ERN and CRN) compared to the rule-based

conditions. Additionally, I expected participants scoring high on the conscientiousness

scale being faster in responses and committing fewer errors reflecting higher task engage-

ment and greater concern over errors. At the same time, participants with high conscien-

tiousness values were assumed to show prolonged post-error slowing. I also assumed that

individual differences in the medial-frontal response-locked ERP after erroneous and cor-

rect responses were associated with conscientiousness. More specifically, ERN and CRN

measured at frontocentral electrodes were hypothesized to be more pronounced in individ-

uals with high levels of conscientiousness.

(31)

2.2 Materials and Methods

2.2.1 Participants

46 participants (42 females, 2 left-handed) between the ages of 18 and 47 years (M = 22.6, SD = 8.5), mainly undergraduate university students were recruited and re- ceived 2.5-hr course credit. All participants reported that they were free of neurological disorders and had normal or corrected-to-normal visual ability. One participant had to be excluded from EEG analysis due to current use of psychoactive medication. I had to ex- clude another 18 participants (39%) from all analyses due to commission of too few errors (<5) in either of both alternative instruction conditions RV and RR (see below). This mas- sive shrinkage of the sample may have been due to a rather low level of task difficulty while at the same time the absolute number of trials in some conditions was low (120). All participants were naive concerning the hypotheses underlying the experiment and had signed a consent form prior to participation in the study. The participants were informed that they could withdraw from the study at any time without penalty or loss of privilege.

2.2.2 Materials

2.2.2.1 Questionnaires

The NEO-FFI (Borkenau & Ostendorf, 2008, original version by Costa & McCrae, 1992) was used. It is a shorter version of the Revised NEO Personality Inventory (NEO-PI- R; Costa & McCrae, 1992) with 60 items derived from the original 240 items. The five domains assessed with 12 items each by the NEO-FFI are conscientiousness, extraversion, agreeableness, neuroticism, and openness. Each item is rated on a 5-point scale.

2.2.2.2 Stimuli and Apparatus

Stimuli were displayed on a 24” screen with a resolution of 1600 x 900 pixels and par-

ticipants had an average viewing distance of 65 cm to screen. A button box (Cedrus RB-

830, San Pedro, CA) served as response device. Stimuli consisted of a green circle with a

diameter of 28 mm or a green square that measured 28 x 28 mm. This corresponds to a

display size of 2.5° of visual angle for the stimuli and 9.0° x 3.0° of visual angle for in-

(32)

structions. There was one button each for left and right responses. Participants were asked to respond bimanually and to use the index finger of each hand to press the buttons. The randomized presentation of stimuli and instructions was controlled by Presentation Version 16 (Neurobehavioral Systems, Inc., Albany, CA). The correct response was determined by the target stimulus and one of three instructions. Participants were instructed to respond in accordance with the overall rule that required to press the left button when the stimulus was a circle and to press the right button when the stimulus was a square.

2.2.3 Procedure

The trial procedure is illustrated in Figure 4. Trials started with a blank screen (500ms), followed by the presentation of an instruction (1500ms) according to one of the three con- ditions (see below). After that, a fixation cross was presented (500ms) and the target stimu- lus (circle or square) followed. The target remained on screen until a response was given.

Possible response types were pressing the left or the right button to the target that was ei-

ther a circle or a square.

(33)

Figure 4. Procedure of a trial. After the presentation of a blank screen (500ms), the participant is instructed by a short text (1500ms). Then the presentation of a fixation cross (500ms) follows whereafter the target stimulus is presented until the participant responds.

The experimental conditions were administered as follows. Depending on the condi- tion, instruction and correct answers were:

- Standard (STD): “Mind the rules” (German “Beachte die Regeln”), circle – left, square – right

- Rule violation (RV): “Commit an error” (German “Mache einen Fehler”), circle – right, square – left

- Rule reversal (RR): “Reverse the rules” (German “Vertausche die Regeln”), circle – right, square – left

The experiment consisted of 30 blocks of 20 trials each (600 trials in total). The stand- ard condition included 60% of the trials whereas the other two tasks comprised 20% each.

All trials were presented in a randomized order across the experiment. The visual stimuli (circles and squares, 300 each) were equally distributed over all conditions. The experi-

Mind the rule

+ 500 ms

blank screen

1500 ms instruction

500 ms fixation

Until response

stimulus

(34)

mental manipulation was implemented in terms of different instructions across trials. Be- fore the experiment started, participants had to practice the mapping rules in a training phase of 20 trials. During the experiment, participants determined the length of breaks be- tween blocks themselves.

2.2.4 EEG recording and data analysis

EEG was recorded by means of an EasyCap (EASYCAP GmbH, Germany) equipped with sintered Ag-AgCl-electrodes. For the recording I used electrodes F1, F2 C3, C4, CP1, CP2, CP5, CP6, Cz, F3, F4, F7, F8, FC5, FC6, FCz, Fz, O1, O2, P3, P4, P7, P8, Pz, T7, T8, TP10, TP9 placed according to the 10-20-system of electrode placement (Jasper, 1958). In addition, two electrodes were placed above the left and right mastoid. The elec- trode AFz was used as ground and an electrode on the nose tip as reference. However, only recorded data from electrodes FCz and Pz were used for statistical analysis as the compo- nents of interest showed a clear amplitude maximum at these positions. The EEG signal was amplified by a BrainAmp amplifier (Brain Products GmbH, Germany) with a sam- pling rate of 250 Hz and 16 bit/channel. Using a band-pass filter of 0.01 Hz to 30 Hz the signal was filtered to eliminate skin conductance and muscle activity interference. Addi- tionally, a notch filter with 50 Hz was used. All impedances were maintained below 10 kΩ during the entire recording procedure. After the experiment, EEG data were further pre- pared in BrainVision Analyzer 2.0.1 (Brain Products GmbH, Germany). Only trials with responses between 200ms and 1500ms after stimulus presentation were considered for analysis. Before ERP data analysis, all trials containing eye-movement artifacts (“blinks”) were corrected using a blind component separation (Joyce, Gorodnitsky, & Kutas, 2004), which has been shown to be superior to other artifact correction procedures (Kierkels, van Boxtel, & Vogten, 2006).

For purpose of data analysis we averaged waveforms with a 100ms pre-response base-

line to 600ms post-response. A baseline correction was applied to the 100ms pre-response

interval. Epochs with voltage steps of 20 μV/4ms or differences of 300 μV after independ-

ent component analysis (ICA) correction in an interval of 150ms on each channel were

rejected from further data analysis.

(35)

I analyzed the error-related components ERN and Pe and the component CRN which is the counterpart of ERN elicited by correct responses. The ERN/CRN is observed as the maximum amplitude of the negative deflection within the first 100ms after (incorrect) re- sponse onset over fronto-central electrodes along the midline (electrodes Fz and FCz). The ERN/CRN was measured in response-locked ERP averages. The Pe follows the ERN and is a positive deflection, usually peaking around 150-350ms after response onset. Its maxi- mum amplitude is observed over centro-parietal electrodes along the midline (electrodes Cz and Pz). Depending on the electrophysiological properties of the present ERP dataset, I defined the ERN/CRN as the mean amplitude during 20-70ms post-response interval at electrode FCz. The Pe/Pc was calculated as the mean amplitude during 200-350ms interval following response onset at electrode Cz. Table 1 show mean trial numbers that were in- cluded in the analysis.

Table 1. Mean number of trials for each combination of instruction condition and response type that were included in statistical analyses.

Correct Error

Condition Mean Min Max Mean Min Max

Standard 337.18 298 356 10.62 5 39

Rule violation 107.89 95 118 7.19 5 29

Rule reversal 106.86 88 116 8.00 5 32

For all response time (RT) analyses, data was corrected for outliers by removing trials with RTs that deviated more than 2.5 SDs from the mean RT of each participant and condi- tion.

Typically, RTs after erroneous responses are slower compared to RTs after correct re- sponses (post-error slowing). I defined the measure of post-error slowing (PES) as follows:

PES = RT Correct(STD)Correct(STD) – RT Error(STD)Correct(STD)

I assessed effects of rule condition (STD vs. RV vs. RR), conscientiousness (continu-

ous) and accuracy (error vs. correct) as well as their interactions on response-locked ERPs

via linear mixed-effects regression using the lme4 package in R (Version 3.5.1; Bates,

(36)

Mächler, Bolker, & Walker, 2014). In addition, I analyzed effects of rule condition (STD vs. RV vs. RR) and conscientiousness (continuous) including their interactions on the be- havioral measures error rate and RT also by means of linear mixed-effects regression. Lin- ear mixed-effects regression provides several important advantages over traditional meth- ods such as repeated-measures ANOVA; it allows including conscientiousness as a contin- uous variable and rule condition as repeated-measures variable. I obtained p values for all linear mixed-effects models using the anova function of the lmerTest package (Kuz- netsova, Brockhoff, & Christensen, 2017) with a Kenward-Roger approximation of de- grees of freedom. As random effects, I defined intercepts for subjects, as well as by-subject random slopes for the effect of conscientiousness and rule condition. Furthermore, mean values of PES were analyzed via linear regression with regressing PES onto conscientious- ness.

2.3 Results

2.3.1 NEO-FFI scales

Sufficient ranges in conscientiousness (Min = 22, Max = 48, MD = 36, M = 35.47, SD

= 6.90) obtained from the sample with possible ranges of 0 to 48 were achieved. Figure 5 shows the distribution of conscientiousness scores. Descriptive statistics and internal con- sistency values are provided in Table 2, intercorrelations among the personality scales in Table 3. A negative relationship between openness and conscientiousness, r = -.32 (p <

.05) is the only significant relationship among the measured personality scales.

(37)

Figure 5. Distribution of conscientiousness scores obtained from the sample.

Table 2. Descriptive statistics (Mean, SD) and internal consistency (cronbach’s alpha) for person- ality traits measured by NEO-FFI.

Personality scale M (SD) α

Neuroticism 22.49 (7.57) .88

Extraversion 28.82 (5.45) .73

Openess 32.98 (6.42) .81

Agreeableness 34.16 (6.43) .84

Conscientiousness 35.47 (6.90) .86

Abbildung

Figure 3. Illustration of the reinforcement-learning theory proposed by Holroyd and Coles (2002)
Table 1.  Mean number of trials for each combination of instruction condition and response type  that were included in statistical analyses
Table 2. Descriptive statistics (Mean, SD) and internal consistency (cronbach’s alpha) for person- person-ality traits measured by NEO-FFI
Table 3. Intercorrelations among personality traits measured by NEO-FFI.  Personality scale  EV  ON  AA  CS  Neuroticism (NT)  -.20  .09  -.24  .01  Extraversion (EV)   -  .05  0.23  0.07  Openness (ON)  -  -0.01  -0.32*  Agreeableness (AA)  -  -0.12  Cons
+7

Referenzen

ÄHNLICHE DOKUMENTE

Because no temperature data when samples were taken from bottles are recorded, it was assumed that the density of samples is 1022.156 kg/m3 (which assume the temperature for 28

This paper reports preliminary results from measurements of frozen ice samples, the achievable signal intensities, standard deviations and calibration graphs as well as the

Both trait impulsivity scales, functional and dysfunctional, have significant negative correlations with high school student grade point averages, except for Sciences GPA

[r]

Guangdong Meteorological Observation Data Center, Guangzhou, China.. Funding information was missing in the

With this and the fact that users only exchange ratings made by themselves, we conclude that if u a exchanges ratings while consuming items, the local set of rating tuples

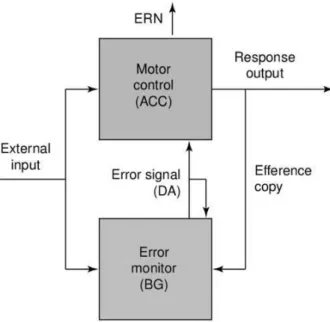
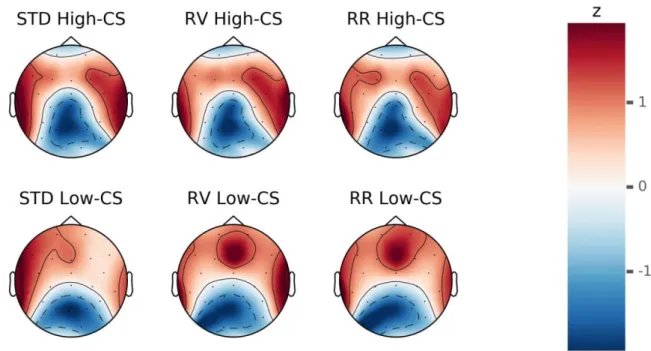
Besides this effect of task type on P300 amplitude, both Novelty P3 and P300 amplitudes were sensitive to matrix size such that larger matrices (and hence

Eldar Khan, the usurper Shamkhal, the Usmi and Sorkhey of the Qazi-Qomuq gathered in Qazanesh with the intention to attack Khass Bulat Khan, the Shamkhal, 106 but they were