Encoding of Coordinating Information in a Network of Coupled Oscillators
I n a u g u r a l - D i s s e r t a t i o n zur
Erlangung des Doktorgrades
der Mathematisch-Naturwissenschaftlichen Fakultät der Universität zu Köln
vorgelegt von
Anna Caren Schneider
aus Herne
Köln
März 2017
Berichterstatter/in: Dr. Carmen Wellmann Prof. Dr. Ansgar Büschges
Tag der mündlichen Prüfung: 03. Mai 2017
Index
Zusammenfassung ...vii
Abstract ... ix
1 Introduction... 1
1.1 The Crayfish Swimmeret System ... 2
1.2 The Coordinating Circuit ... 4
1.3 Activation and Modulation of the Swimmeret System ... 7
Coordination of the Swimmeret System at Different Excitation Levels ... 7
1.4 Aim of Study ... 9
2 Materials and Methods ... 11
2.1 Dissection ... 11
2.2 Electrophysiological Setup ... 11
2.3 Electrophysiological Protocols ... 13
2.4 Analysis ... 15
Statistics and Data Presentation ... 17
2.5 Histology ... 17
2.6 Microscopy ... 18
2.7 MALDI-TOF Mass Spectrometry ... 18
3 Results ... 20
PART I: Cellular Properties... 20
3.1 Isolating Neurons ... 20
3.2 Different Mechanisms Shaped ASC
Eand DSC bursts ... 22
Hysteresis in Coordinating Neurons ... 26
Network Effect Masked Rebound Properties ... 28
3.3 Setting the Excitation Level with Carbachol and EdCl ... 29
Effect on Membrane Potential ... 32
Effect on Tuning Curves ... 35
Effect on Input Resistance ... 37
PART II: Neurotransmitters ... 41
3.4 Antibody Labeling Against Serotonin ... 41
3.5 MALDI-TOF Mass Spectrometry ... 44
4 Discussion ... 47
4.1 Isolating Neurons ... 47
4.2 Burst Shaping Mechanisms ... 48
Index
Burst Shaping in ASC
E... 48
Burst Shaping in DSC ... 51
Post-inhibitory Rebound in ASC
Eand DSC ... 52
Burst Shaping in Other Neurons and Systems ... 53
Burst Shaping: Conclusions ... 54
4.3 Hysteresis of Coordinating Neurons ... 56
Spike-Frequency Adaptation ... 56
Intraburst Hysteresis ... 57
Interburst Hysteresis ... 59
Hysteresis: Conclusions ... 60
4.4 Effect of Carbachol and EdCl on the Swimmeret System’s Excitation Level ... 61
No Dose-Dependent Effect on Burst Strength ... 61
Dose-Dependent Effect on Period ... 63
Excitation Level: Conclusions ... 64
Differences in the Number of ASC
Eand DSC Spikes ... 65
4.5 Encoding Coordinating Information at Different Excitation Levels ... 66
Changes in Membrane Potential ... 66
Shift of Tuning Curves ... 68
Differential Effect on Input Resistance ... 70
Encoding Coordinating Information: Conclusions ... 72
4.6 Transmitters of Coordinating Neurons ... 73
Intracellular Staining and Immunohistochemistry ... 73
MALDI-TOF Mass Spectrometry ... 74
4.7 Comparison to Coordination in Other Systems ... 75
5 Conclusions and Outlook... 79
Bibliography ... 83
Abbreviations ... 95
Appendix ... 96
Acknowledgements ... 110
Eigentständigkeitserklärung ... 111
Zusammenfassung
Bewegung von Tieren erfolgt meist durch zyklische Bewegungen des Körpers oder der Gliedmaßen. Diese Bewegungen werden von neuronalen Netzwerken gesteuert, die durch zentrale Mustergeneratoren (CPG) angetrieben werden. In der Regel wird jedes Körpersegment, jede Extremität oder sogar jedes Gelenk durch einen eigenen CPG gesteuert. Um zielgerichtetes Verhalten auszuführen, müssen die verschiedenen CPGs koordiniert werden.
Das Netzwerk zur Bewegungskontrolle der Schwimmbeine eignet sich als Modell um die Koordination dezentralisierter CPGs zu untersuchen. Die Schwimmbeine sind vier paarige abdominale Pleopoden. Neben dem Schwimmen werden sie benutzt, um die Körperposition zu halten oder Eier zu belüften. Jedes der Schwimmbeine bewegt sich in alternierender Retraktion (PS), die den Antrieb erzeugt, und Protraktion (RS), die das Schwimmbein zurück in die Ausgangsstellung bringt. Die beiden Schwimmbeine desselben Segments bewegen sich in Phase. Die vier ipsilateralen Schwimmbeinpaare bewegen sich in einer metachronalen Welle. Das posteriore Paar beginnt jeden Bewegungszyklus. Die anterioren Paare folgen dem jeweils posterioren Paar mit einem Phasenversatz von ungefähr 25%.
Dieser Phasenversatz ist unabhängig von der Periodendauer eines Schwimmzyklus.
Auf neuronaler Ebene wird jedes Schwimmbein von einem eigenen Netzwerk im jeweiligen abdominalen Hemiganglion kontrolliert. Der CPG besteht aus Inhibitoren des PS (IPS) und Inhibitoren des RS (IRS), die sich gegenseitig inhibieren. Weiterhin inhibieren sie jeweils die PS und RS Motoneurone, was zur alternierenden Protraktion und Retraktion eines Schwimmbeins führt. In jedem Hemiganglion sind drei weitere Neurone notwendig und hinreichend für den spezifischen Phasenversatz zwischen den Segmenten. Das Ascending Coordinating Neuron (ASC
E) erhält denselben synaptischen Eingang vom CPG wie die PS Motoneurone. Es codiert Timing, Dauer und Stärke jedes PS und leitet die Information als Aktionspotentialburst zu den anterioren Ganglien. Das Descending Coordinating Neuron (DSC) erhält denselben synaptischen Eingang vom CPG wie die RS Motoneurone. Es codiert Timing, Dauer und Stärke jedes RS und leitet die Information als Aktionspotentialburst zu den posterioren Ganglien. Das Kommissurale Interneuron 1 (ComInt 1) erhält die koordinierenden Informationen der anterioren und posterioren Ganglien und integriert sie über eine elektrische Synapse in eins der IRS Neurone.
Die isolierte abdominale Ganglienkette generiert dieselbe (fiktive) motorische Aktivität
wie das intakte Tier. Sie kann für mehrere Stunden in Ringer gehalten werden, um die
Zusammenfassung
Burststärke wird durch die Anzahl an Aktionspotentialen (AP) in jedem ASC
Eund DSC Burst codiert. Wenn sich die Burststärke spontan ändert, folgt die Anzahl der APs in einem linearen Zusammenhang. Cholinerge Agonisten, wie z.B. Carbachol, können die mittlere absolute Burststärke konzentrationsabhängig zu hohen oder niedrigen Werten verschieben, indem sie die Erregung des Systems ändern. In diesem Fall wird die absolute Burststärke nicht mehr linear von den koordinierenden Neuronen codiert. Dieses paradoxe Ergebnis kann durch die Adaptive Encoding Hypothese erklärt werden: Das koordinierende Netzwerk besteht aus aufeinander abgestimmten Encodern (ASC
Eund DSC) und Decoder (ComInt 1), und das Erregungslevel gleicht die neuronalen Eigenschaften zum Codieren und Decodieren an. Daher kann die gleiche Anzahl an APs einen absoluten starken Burst bei einem hohen oder einen absoluten schwachen Burst bei einem niedrigen Erregungslevel bedeuten. ComInt 1 interpretiert die Anzahl an ankommenden APs im Kontext der Erregung um die Burststärke zu decodieren.
Ein Ziel dieser Studie war es, in elektrophysiologischen Experimenten das mögliche adaptive Codieren durch koordinierende Neurone zu untersuchen. Das zeigte, dass der Erregungslevel sowohl das ganze Netzwerk als auch die einzelnen koordinierenden Neurone beeinflusste. Wenn die koordinierenden Neurone chemisch isoliert waren, steigerte Carbachol ihre Erregbarkeit durch Depolarisation des Membranpotentials, Steigerung des Eingangswiderstands und Verringern der AP Schwelle. Gleichzeitig führte diese gesteigerte Erregung dazu, dass weniger APs als Antwort auf einen Stimulus generiert werden konnten, wahrscheinlich durch die Inaktivierung von Natriumkanälen. Im synaptisch verbundenen Netzwerk wurden die koordinierenden Neurone stärker durch den CPG inhibiert, wenn die Erregung des Systems gesteigert wurde. Diese ausgleichenden Mechanismen zur Steigerung und Verringerung der neuronalen Erregbarkeit ermöglichten es den koordinierenden Neuronen sich dem Umfang der auftretenden Burststärken bei jedem Erregungslevel anzupassen, so dass die relativen Burststärken codiert wurden.
Das zweite Ziel dieser Arbeit war es, die neuronalen Transmitter von ASC
Eund DSC an
der Synapse zu ComInt 1 zu identifizieren. Obwohl die Konnektivität des Netzwerks zur
Bewegungskontrolle der Schwimmbeine sehr gut untersucht ist, ist das Wissen über die
vorhandenen Transmitter gering. Mit immunohistochemischen Versuchen konnte Serotonin
als Transmitter ausgeschlossen werden, weil koordinierende Neurone nicht mit serotonin-
immunoreaktiven Neuronen kolokalisiert waren. Durch MALDI-TOF Massenspektrometrie
wurde Acetylcholin als wahrscheinlicher Transmitter identifiziert.
Abstract
Animal locomotion is driven by cyclic movements of the body or body appendages.
These movements are under the control of neural networks that are driven by central pattern generators (CPG). Usually, each body segment, appendage, or even individual joints of an appendage, is driven by its own CPG. In order to produce meaningful behavior, CPGs need to be coordinated.
The crayfish swimmeret system is a model for investigating the coordination of distributed CPGs. Swimmerets are four pairs of limbs that are located on the animal’s abdomen. They are used for forward swimming, controlling body posture or ventilating eggs. Each swimmeret moves in cycles of alternating power-strokes (PS), which generate the driving force, and return-strokes (RS), which bring the limb back to its protracted resting position. The swimmerets on one body segment move in phase. Along the abdomen, the swimmeret pairs are coordinated in a metachronal wave. The most posterior pair starts each cycle. Each anterior pair follows its posterior pair with a phase lag of approximately 25%. This phase lag is independent of the cycle period.
On the neuronal level, each swimmeret is controlled by its own microcircuit that is located in the body segment’s hemiganglion. The CPG consist of two reciprocally inhibiting pools of Inhibitors of PS (IPS) and inhibitors of RS (IRS). They inhibit the pools of PS and RS motor neurons, driving the alternating PS-RS activity of the limb. Three neurons per hemiganglion are necessary and sufficient for the 25% phase lag between segments. The Ascending Coordinating Neuron (ASC
E) receives the same input from the CPG as the PS motor neurons. It encodes timing, duration, and strength of each PS and sends this information as burst of spikes to the anterior ganglia. The Descending Coordinating Neuron (DSC) receives the same input from the CPG as the RS motor neurons. It encodes timing, duration, and strength of each RS and sends this information as burst of spikes to the posterior ganglia. Coordinating information is received by the Commissural Interneuron 1 (ComInt 1), which integrates it via an electrical synapse into one of the IRS neurons.
The isolated abdominal ganglia chain reliably produces the same motor output as in the intact animal, i.e. fictive swimming. It can be kept in a Petri dish covered with saline for several hours to investigate the neural activity by intra- and extracellular recordings. Motor burst strength is encoded by the number of spikes per ASC
Eand DSC burst. If burst strength varies spontaneously, the coordinating neurons accurately track these changes linearly.
Cholinergic agonists, e.g. carbachol, can balance the mean absolute burst strength towards
high or low values, depending on concentration, i.e. change the system’s excitation level. In
Abstract
coordinating neurons. This paradox result can be explained by the Adaptive Encoding Hypothesis: The coordinating circuit consists of matched encoders (ASC
Eand DSC) and decoder (ComInt 1), and the excitation level tunes their encoding and decoding properties.
Hence, the same number of coordinating spikes can encode an absolute strong burst at a high excitation level and absolute weak burst at a low excitation level. ComInt 1 interprets the arriving number of spikes in the context of excitation to decode the burst strength.
One aim of this study was to investigate the putative adaptive encoding of the coordinating neurons in electrophysiological experiments. This revealed that the excitation level influenced both the whole system and the individual coordinating neurons. When chemically isolated, carbachol increased the coordinating neurons’ excitability by depolarizing their membrane potential, increasing input resistance, and lowering spike threshold. Concomitantly, this increased excitability diminished the amount of spikes generated as response to stimulation, presumably caused by sodium channel inactivation. In the synaptically connected network, the coordinating neurons received stronger inhibition from the CPG when the system’s excitation increased. These mechanisms allowed the coordinating neurons to adapt to the range of burst strengths at any given excitation level by encoding relative burst strengths.
The second aim of this study was to identify the transmitters that the coordinating
neurons use at the synapse to ComInt 1. Although the connectivity of the swimmeret
system is well understood, knowledge about the transmitters of the individual neurons is
sparse. Immunohistochemical experiments ruled out serotonin as transmitter because
coordinating neurons were not co-localized with serotonin-immunoreactive positive
neurons. MALDI-TOF mass spectrometry suggested acetylcholine as presumable
transmitter.
1 Introduction
One of the fundamental goals in neuroscience is to explain how nervous systems generate behavior. More than 100 years ago, Brown (1911) concluded from his experiments on spinalized and deafferented cats that sections of the spinal cord are able to produce alternating motor activity by alternating activation of motor neurons. Nowadays, neural oscillators to govern rhythmic behavioral output are found in all investigated animals. To name just a few, those identified in locomotion drive leech swimming (Kristan and Calabrese, 1976), insect walking (Pearson and Iles, 1970), locust flying (Wilson, 1961), dragonfly flying (Simmons, 1977), lamprey swimming (Cohen and Wallén, 1980), or mouse walking (Smith and Feldman, 1987). Non-locomotor CPGs are for example governing leech heartbeat (Thompson and Stent, 1976a, 1976b), or breathing in the mammalian preBötzinger complex (Smith et al., 1991). On the cognitive side, oscillations have been linked for example to perception, as in honeybee odor discrimination (Stopfer et al., 1997), or memory, as seen in human hippocampal theta oscillations (Backus et al., 2016).
Perhaps the most thoroughly investigated neural oscillators are the central pattern generators (CPGs) involved in locomotion. A CPG’s most distinguishing feature is its ability to generate rhythmic recurrent activity even in the absence of sensory input or other external timing cues. One way to achieve this rhythmicity is by singular pacemaker neurons that are oscillating on their own because of the interplay of their ionic conductances.
Examples of pacemaker neurons are AB in the stomatogastric nervous system (STNS) of crustaceans (Miller and Selverston, 1982) or R15 in Aplysia (Alving, 1968). Another way for rhythmogenesis is via the interconnection of neurons in a network, which do not necessarily have pacemaker properties. Such examples are seen in the swim networks in leech (reviewed in Brodfuehrer et al., 1995) or Tritonia (Getting et al., 1980). In networks that produce oscillations, the most commonly found motif in invertebrates is reciprocal inhibition of two neurons, or two neuronal populations, to produce alternating activity.
Body segments, limbs, or limb joints are under the control of individual CPGs. For
example in the crayfish swimmeret system each swimmeret is controlled by its own CPG
(Murchison et al., 1993). In the stick insect, even each individual leg joint is driven by its
own CPG (Büschges et al., 1995). In these examples, only the precise execution of limb
movements allows for goal-directed locomotion. In addition, interacting rhythms can
operate on different time scales, e.g. pyloric and gastric mill rhythm in the STNS (Bartos et
al., 1999) or swimming and breathing in lamprey (Gariépy et al., 2012). Recently, it has been
Introduction
cortical and subcortical brain oscillations (Zelano et al., 2016). Hence, in order to produce a meaningful (motor) output, CPGs have to be coordinated.
In most systems, it is still not well understood how the individual oscillators are coordinated. Several examples exist for the varying importance of coordination through sensory feedback on the one hand, or central mechanisms, like direct interaction of CPGs or via coordinating interneurons and pathways, on the other hand. Examples demonstrating the different weighting and interplay of those mechanisms are for example insect walking (Borgmann et al., 2009; Berendes et al., 2016) or leech swimming (Yu et al., 1999). One system in which the central coordinating mechanism is understood on a cellular level is the crayfish swimmeret system. This was one of the first preparations in which fictive locomotion in the isolated central nervous system (CNS) was demonstrated (Hughes and Wiersma, 1960). Here, coordinating circuits consisting of identified neurons coordinate the CPGs (Namba and Mulloney, 1999; Tschuluun et al., 2001; Mulloney et al., 2006;
Smarandache et al., 2009). Therefore, the swimmeret system can serve as a model to understand the coupling of distributed neural oscillators because the relatively small number of necessary and sufficient neurons to generate and coordinate the swimmeret motor output is identified. Since the coordination is independent of sensory feedback (Ikeda and Wiersma, 1964) it can be studied in the isolated CNS, allowing easy access for multiple recording electrodes.
1.1 The Crayfish Swimmeret System
The swimmerets are four pairs of limbs on the crayfish’s abdomen that can be activated during a wide range of behaviors. They are used for propelling the animal forward during swimming, burrowing, egg ventilation in females (Huxley, 1880), supporting walking (Cattaert and Clarac, 1983), or righting of the body if rolled along the longitudinal axis (Davis, 1969; Neil and Miyan, 1986). Each swimmeret is active in alternating power-stroke (PS; generating the driving force) and return-stroke (RS) movements. The two swimmerets of each segment move in phase and all pairs of swimmerets move in a metachronal wave from posterior to anterior with a phase lag of approximately 25% between segments (Hughes and Wiersma, 1960; Ikeda and Wiersma, 1964). This phase lag is independent of swimming frequency (Braun and Mulloney, 1993; Mulloney, 1997) and optimized for fluid- mechanical efficiency (Zhang et al., 2014).
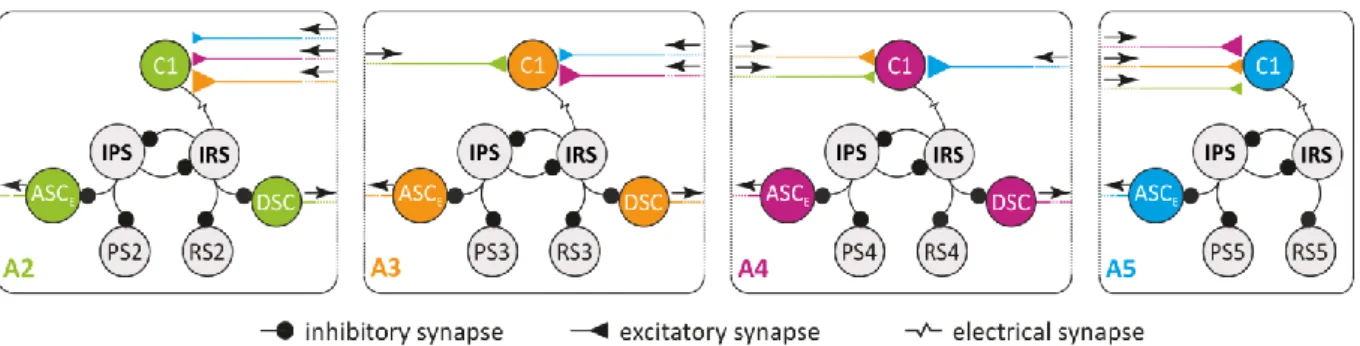
Each hemiganglion in the abdominal ganglia (A) chain A2 to A5 contains a microcircuit
(Figure 1) that controls the respective swimmeret (Murchison et al., 1993). The
microcircuit’s neurons synapse in the Lateral Neuropil (LN) of their home ganglion (Sherff
and Mulloney, 1997; Mulloney and Hall, 2003; Smarandache-Wellmann et al., 2013). The approximately 70 motor neurons project through the first nerve root (N1). The anterior branch carries axons from RS motor neurons (MN), the Return-Stroke Exciters (RSE) and Return-Stroke Inhibitors (RSI). The posterior branch carries axons from PS MNs, the Power- Stroke Exciters (PSE) and Power-Stroke Inhibitors (PSI) (Mulloney and Hall, 2000). Non- spiking Inhibitors of the Power-Stroke (IPS; three types) and Inhibitors of the Return-Stroke (IRS; two types) form the pattern-generating kernel. They inhibit the pools of PS and RS MNs, leading to alternating RS and PS of the swimmeret (Paul and Mulloney, 1985a, 1985b;
Mulloney, 2003; Smarandache-Wellmann et al., 2013).
Figure 1: Connectivity diagram of four coupled local microcircuits controlling the ipsilateral swimmerets. A2, A3, A4, A5:
Abdominal ganglion 2, 3, 4, 5; ASCE: Ascending Coordinating Neuron (early); C1: Commissural Interneuron 1; DSC:
Descending Coordinating Neuron; IPS: Inhibitor of Power-Stroke; IRS: Inhibitor of Return-Stroke; PS: Power-stroke; RS:
Return-stroke. Size of the excitatory connections corresponds to synaptic strength. Modified after Smarandache- Wellmann and Grätsch 2014.
The Ascending Coordinating Neuron (ASC
E) and Descending Coordinating Neuron (DSC) are necessary and sufficient to coordinate the microcircuits across segments and maintain the 25% phase lag (Namba and Mulloney, 1999; Tschuluun et al., 2001). ASC
Eand DSC encode information about timing, duration, and strength of their microcircuit’s PS and RS bursts, respectively (Mulloney et al., 2006). ASC
Esends this information to anterior ganglia, DSC to posterior ganglia (Namba and Mulloney, 1999). Their activity is driven by the same non-spiking pattern generating neurons (IPS and IRS) that also drive MN activity (Smarandache-Wellmann and Grätsch, 2014).
Coordinating information from the other ganglia’s ASC
Es and DSCs arrives with a
gradient of synaptic strength at the non-spiking Commissural Interneuron 1 (ComInt 1, in
figures abbreviated with C1) (Smarandache et al., 2009). ComInt 1 receives the coordinating
information at the midline of its home ganglion (Mulloney and Hall, 2003). This neuron
decodes the coordinating information and integrates it into the pattern-generating kernel
via an electrical synapse to one of the two IRS (Smarandache-Wellmann et al., 2014).
Introduction
1.2 The Coordinating Circuit
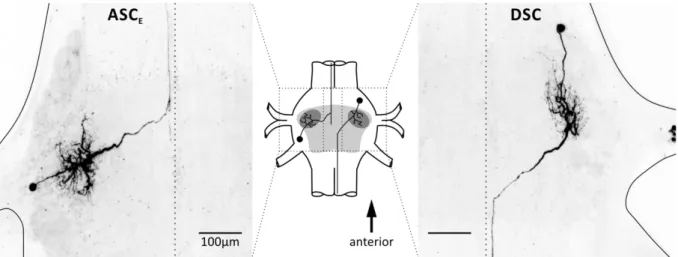
One presynaptic ASC
Eand DSC of their home module and one postsynaptic ComInt 1 in a target module form the coordinating circuit. ASC
Eis present in every ganglion from A2 to A5 (Figure 2). Its soma is located ventrally and posterior to N1 in the pool of PS motor neurons. Dendrites branch in the LN, the primary neurite traverses in the anterior Minuscule Tract (MnT) dorsally towards the midline and projects anterior along the midline (Namba and Mulloney, 1999; Mulloney and Hall, 2003). The anterior termination site of ASC
Eis unknown; it presumably reaches further than the fifth thoracic ganglion (Tschuluun et al., 2001). DSC is present in A2 to A4 (Figure 2). Its soma is located ventrally and anterior to N1 in the pool of RS motor neurons. Dendrites branch in the LN, the primary neurite traverses in the posterior MnT dorsally towards the midline and projects posterior along the midline to A6 (Namba and Mulloney, 1999; Tschuluun et al., 2001; Mulloney and Hall, 2003).
Coordinating neurons synapse at the midline of each abdominal target ganglion with en passent synapses onto one of the bilaterally symmetrical ComInt 1 (Mulloney and Hall, 2003). Hence, input to the coordinating neurons affects timing and strength of their target’s motor output (Namba and Mulloney, 1999; Jones et al., 2003; Mulloney and Hall, 2007a).
Figure 2: Morphology of ASCE and DSC. Schematic shows location of the neurons in a ganglion with the core region containing the neuropils shaded in light grey and the lateral neuropil in dark grey. Lines indicate ganglion outline and midline.
ASC
Eis active in phase with the PS of its home ganglion and sends coordinating information to the anterior ganglia (Figure 3 A). Extracellular recordings may contain activity from two neurons (ASC
Eand ASC
L) and is therefore labeled ASC, but only ASC
Ecoordinates the oscillators (Mulloney et al., 2006). Depolarization of ASC
Eresults in an
increase of the anterior ipsilateral PS bursts strength; hyperpolarization results in a decrease
(Figure 3 B).
Figure 3: Extracellular and intracellular recordings of ASCE’s and DSC’s activity and their influence on the ongoing rhythm.
A: ASC is active in phase with the PS of its home ganglion; DSC is active in antiphase with the PS of its home ganglion.
Asterisks mark ASCL spikes. B: Hyperpolarization of ASCE decreased the anterior PS burst strength; depolarization increased the anterior PS burst strength. Asterisks mark ASCL spikes. C: Hyperpolarization of DSC decreased the posterior PS burst strength; depolarization increased the posterior PS burst strength. ASC: Ascending Coordinating Neurons (this trace may contain spikes of two ascending coordinating neurons: ASCE and ASCL (asterisks), see text for description);
ASCE: Ascending Coordinating Neuron, early; DSC: Descending Coordinating Neuron; PS: Power-stroke; 2, 3, 4, 5: Number of the recorded abdominal ganglion. Recordings in C by Swantje Grätsch.
Introduction
DSC is active in antiphase with the PS of its home ganglion and sends coordinating information to the posterior ganglia (Figure 3 A). Depolarization of DSC results in an increase of the posterior ipsilateral PS burst strength; hyperpolarization results in a decrease (Figure 3 C). Generally, DSC stimulation seems to have a weaker effect on its target ganglion than ASC
Estimulation (Namba and Mulloney, 1999). Furthermore, posterior coordinating neurons fire more spikes per burst in longer bursts and at a higher frequency than anterior ones (Mulloney et al., 2006).
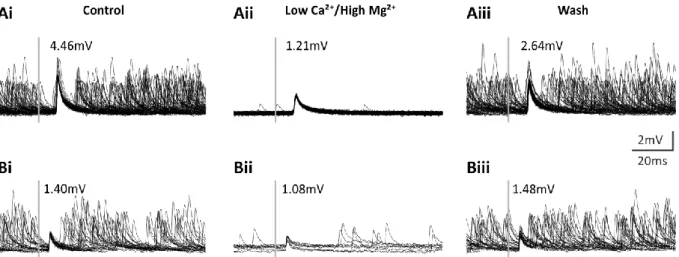
Figure 4: Multisweeps of ComInt 1 in normal saline (i and iii) and LowCa2+ saline (ii). A: Triggered on ASCE spike. B:
Triggered on DSC spike. Grey bar indicates time of trigger. Voltages are amplitudes of the average waveform. Recordings by Carmen Wellmann.
It has been shown that the excitatory connections of coordinating neurons to ComInt 1
have a gradient of synaptic strength (Mulloney and Hall, 2003; Smarandache et al., 2009). In
preliminary experiments to determine if these synapses are chemical or electrical,
ComInt 1’s EPSP amplitude was measured in normal saline and low Ca
2+/ high Mg
2+saline,
which blocks transmission at chemical synapses. Average EPSP amplitude was reduced in 4
of 4 experiments and recovered after washing with normal saline (Figure 4). This was
similar for EPSPs elicited by ASC
Eand DSC. Since transmitter release via vesicle fusion is
directly dependent on intracellular Ca
2+concentration (reviewed in Zucker, 1993; Südhof,
2012) this indicated a mainly chemical connection between the neurons with the possibility
of an electrical component. Because of the EPSP’s short rise times, we hypothesized that the
coordinating neurons use low molecular weight transmitters like glutamate or GABA. Bath
application of glutamate and GABA antagonists did not change EPSP shape, excluding them
as transmitters (pers. comm. Henriette Seichter).
1.3 Activation and Modulation of the Swimmeret System
In the early experiments on the swimmeret system, interganglionic fiber bundles containing excitatory ‘command neurons’ were tonically stimulated to induce rhythmic activity from quiescent preparations (Hughes and Wiersma, 1960; Wiersma and Ikeda, 1964).
Atwood and Wiersma (1967) found out that swimmeret rhythm frequency depended on the command neurons’ stimulation frequency. In addition, Davis and Kennedy (1972a) demonstrated that the simultaneous stimulation of two command neurons led to stronger PS bursts than stimulation of single command neurons.
Three of five excitatory command neurons release proctolin when activated (Acevedo et al., 1994). Similarly, bath application of proctolin is also activating the swimmeret system and modulating its activity in a dose-dependent manner (Mulloney et al., 1987). In the same study, the authors report that they elicited rhythmic activity by application of the muscarinic agonist pilocarpine as well. Later, Braun and Mulloney (1993) extended these findings by demonstrating that pilocarpine can also modulate the activity in a dose- dependent manner. Furthermore, they described that nicotine does not induce rhythmic activity but can modulate ongoing activity. This dose-dependent modulation covers wider frequency ranges than proctolin or pilocarpine. The cholinergic agonist carbachol combines the effect of pilocarpine and nicotine. Bath application activates the swimmeret system and higher doses increase burst strength and shorten cycle periods (Braun and Mulloney, 1993, 1995; Mulloney, 1997; Mulloney and Hall, 2007b).
Braun and Mulloney (1993) concluded that separate pathways exist for activation and modulation of the swimmeret system because cholinergic antagonists do not interrupt the proctolin-induced rhythm. Hence, one pathway is activated by proctolin, the other by cholinergic agonists. The cholinergic pathway can be further subdivided in one predominantly activating (muscarinic) and one predominantly modulating (nicotinic) pathway. Even if the period of the motor output changes, the phase lag between segments remains stable (Mulloney et al., 2006).
Coordination of the Swimmeret System at Different Excitation Levels
The activity of coordinating neurons in the swimmeret system of Procambarus clarkii
was first observed by Hughes and Wiersma (1960) who speculated that they could transmit
an efference copy of the motor output from their home ganglion to other ganglia. This was
corroborated by experiments from Stein (1971), who could delimit coordinating activity
from the activity of command neurons, and by Mulloney (1997), who uncoupled swimmeret
Introduction
(1999) identified the individual coordinating neurons in Pacifastacus leniusculus on the cellular level. They noted that if PS frequency increases because of increased excitation, the spike frequency of ASC
Eand DSC would increase as well. In addition, the instantaneous spike frequency within a burst decreases over time. On a cycle-to-cycle basis, the beginning of a coordinating neuron’s burst signals the beginning of a PS or RS, respectively. The burst duration correlates to the duration of PS or RS activity, and the number of spikes correlates to PS or RS burst strength (Figure 5 A) (Mulloney et al., 2006). Apparently, DSC’s fidelity is lower than ASC
E’s. Smarandache-Wellmann and Grätsch (2014) could finally demonstrate that the coordinating neurons are indeed directly driven by the CPG, reinforcing the efference copy hypothesis.
Braun and Mulloney (1995) conducted split-bath experiments in which the anterior and posterior parts of the abdominal ganglia chain were independently excited to different levels by selective application of pilocarpine or carbachol. They found out that the active phase of anterior PS is advanced, and duty cycle shortened in the posterior PS, if the anterior ganglia are at a high excitation level. Anterior PS is delayed if anterior ganglia are at a low excitation level relative to the posterior ganglia. Mulloney and Hall (2007b) extended these
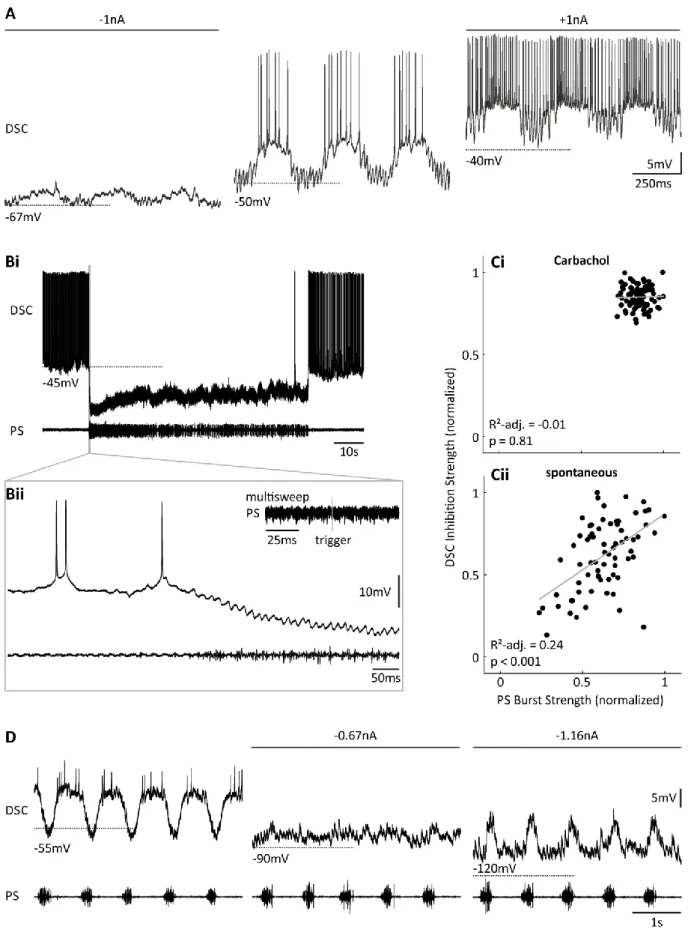
Figure 5: Adaptive encoding of coordinating neurons. A: Correlation between the numbers of coordinating neurons’ spikes per burst and spontaneously varying normalized burst strength of their home ganglion’s PS. Modified after Mulloney et al., 2006. B: This correlation is no longer evident if the excitation level is set with different concentrations of carbachol. Modified after Mulloney and Hall, 2007b.
CL: Confidence limits; r: Regression coefficient; SD: Standard deviation.
findings in further split-bath experiments. They observed that PS burst strength is higher in those ganglia that are bathed in high carbachol concentrations compared to application of low concentrations. Based on the results from Mulloney et al. (2006) they expected these stronger bursts to be encoded by more spikes in the coordinating neurons. Surprisingly this was not the case: Spike number did not correlate with the chemically induced change in burst strength (Figure 5 B).
These seemingly paradox results could be explained by the Adaptive Encoding Hypothesis. The encoders and decoder (ASC
E, DSC, and ComInt 1) are matched to each other (Mulloney et al., 2006), meaning that ComInt 1 interprets the number of arriving coordinating spikes in the context of excitation. The excitation level itself tunes the encoding and decoding properties of the encoders and decoder, so that large differences in burst strength are encoded in a narrow fixed range of spikes by adapting the spike range to the mean burst strength. ComInt 1 is able to match the same number of spikes to different burst strengths, depending on the system’s excitation (pers. comm. Carmen Wellmann).
1.4 Aim of Study
One aim of this study was to characterize cellular properties of the coordinating neurons, especially those that allow the precise encoding of coordinating information at different excitation levels, in order to test the Adaptive Encoding Hypothesis. My working hypothesis was that different excitation levels acted on two stages: Influencing the network itself, which in turn affected ASC
Eand DSC, and influencing the coordinating neurons directly, changing their excitability.
To set the system to different excitation levels I exploited the nicotinic pathway. It is known so far that the swimmeret system can be activated by stimulating command neurons (Wiersma and Ikeda, 1964), via a proctolinergic pathway, or via a muscarinic pathway (Braun and Mulloney, 1993). But the modulation of the system’s output can be achieved effectively with nicotinic agonists in a dose-dependent manner (Mulloney, 1997; Mulloney et al., 1997).
Most of the knowledge about ASC
Eand DSC is derived from extracellular recordings.
While this is a non-invasive method of recording that causes no or only little damage to
neurons, it is only possible to monitor a neuron’s output. I used intracellular recordings to
gain insights about the neurons’ synaptic input and intrinsic properties, such as changes in
membrane potential, input/output functions, and changes in conductances based on
different excitation levels with the network intact or the neurons chemically isolated.
Introduction
Just knowing the connectivity and characteristics of single neurons in a network is not enough to predict the output of such a network (reviewed in Harris-Warrick, 2011). Some networks are not functional without the presence of neuromodulators. Either they are not active at all or the activity is not coordinated. It has been demonstrated very clearly in the STNS that even if the network is active all kinds of neuromodulators can alter the motor output by influencing the efficacy of synaptic connections or change ionic conductances in single neurons (Flamm and Harris-Warrick, 1986a, 1986b; Johnson and Harris-Warrick, 1990). The same neuromodulator can activate distinct intracellular pathways in individual neurons, or different neuromodulators can converge onto the same intracellular pathway (Swensen and Marder, 2000).
In the swimmeret system, only little is known about the transmitters the neurons use.
Because ComInt 1 receives information from two different types of coordinating neurons I
asked which transmitters they used. As the transmitters are presumably of low molecular
weight, and GABA and glutamate have already been excluded, I hypothesized them to be
most likely serotonin (5-HT) or acetylcholine (ACh). To test this, I used
immunohistochemistry and mass spectrometry.
2 Materials and Methods
All experiments were carried out in adult crayfish (Pacifastacus leniusculus, D
ANA, 1852) of both sexes. 421 crayfish were used in this study. Animals were fished from the Wupper at Müngstener Bückenpark, Solingen, by a local fisherman. They were kept in freshwater tanks at 14°C – 18°C until sacrificing. Once a week they were fed with carrots and monthly with additional shrimp pellets. Successful electrophysiological experiments were obtained from 40 animals, successful antibody labeling from 17 animals, and successful mass spectrometry from 11 animals.
2.1 Dissection
All experiments were conducted in the isolated abdominal nerve cord. The detailed dissection procedure is described in Seichter et al. (2014). Briefly, crayfish were anesthetized in ice for 20 minutes. Claws and uropods were removed for exsanguination with 50ml ice- cold crayfish saline (concentrations in mM: 195 NaCl, 5.4 KCl, 13.5 CaCl
2, 2.6 MgCl
2; buffered with 10mM Tris base and 4.7mM maleic acid at pH 7.4). After decapitation and cutting off the peraeopods, the sternal plate with the abdominal ganglia chain was removed.
The ganglia chain from thoracic ganglion 4 (T4) to the last abdominal ganglion (A6) was dissected from the plate and pinned out dorsal side up in a small chamber in a Sylgard- coated (Dow Corning, Midland, MI, USA) Petri dish. The chamber in the Sylgard enabled faster wash-in and –out of substances because of the reduced volume. Special care was taken with the N1s from A2 to A5 because they were used to record extracellularly the fictive swimming pattern. All ganglia were desheathed dorsally with fine scissors to facilitate uptake of chemicals and electrode penetration.
2.2 Electrophysiological Setup
All experiments were carried out at room temperature (18°C – 21°C). In all experiments, I extracellularly recorded fictive motor and coordinating neuron activity, and intracellularly recorded from ASC
Eor DSC (Figure 6 A).
I used custom-made differential stainless steel pin electrodes to record from the posterior
N1 branches of A2 – A5, carrying PS motor neuron (MN) axons. The nerve was wrapped
around the recording electrode and insulated with petroleum jelly, or nerve and recording
electrode were placed in the same petroleum jelly wells. The reference electrode was placed
Materials and Methods
which was connected to two 4-channel differential amplifiers (MA102, Electronics Lab, University of Cologne, Germany), thus allowing up to eight simultaneous extracellular recordings. Signals were band-pass filtered between 100Hz and 3kHz, and amplified 1000- fold.
I extracellularly recorded from coordinating neurons with suction electrodes (MWE- F15B, Warner Instruments, Hamden, CT, USA) mounted on a micromanipulator (M-3333, Narishige, Tokyo, Japan). Pipettes were pulled on a P-87 micropipette puller (Sutter Instruments, Novato, CA, USA) from borosilicate capillaries (O.D. 1.5mm, I.D. 0.86mm, Sutter) and broken down to a tip diameter slightly larger than the diameter of the Lateral Giant Axon (LG). For ASC recordings, I placed them dorsal to the LG on the anterior Minuscule Tract (MnT), for DSC recordings dorsal to the LG on the posterior MnT. Signals were preamplified 50-fold (MA103, Electronics Lab) and sent to the two differential amplifiers with the same settings as for pin electrode recordings.
I impaled ASC
Eor DSC at the primary neurite in the area of its dendritic arborization in the LN (Figure 6 B). As those neurons are not visible in the ganglion, the following criteria had to be fulfilled for identification:
1. Membrane potential (V
m) oscillation in phase with PS (ASC
E) or in anti-phase (DSC).
2. Corresponding spikes on intra- and extracellular recordings.
3. Current injection modulated burst strength of the neuron’s target ganglion.
Identity was confirmed afterwards by the dye-filled neuron’s morphology.
Sharp intracellular electrodes (30MΩ – 40MΩ) were pulled from borosilicate capillaries
with filament (O.D. 1.0mm, I.D. 0.5mm, Sutter) on a P-1000 micropipette puller (Sutter) and
filled with 1% dextran Texas Red (dTR; Molecular Probes, Eugene, OR, USA) in 1M KAc +
0.1M KCl. The electrode was mounted on a micromanipulator (MM-3, Narishige) connected
to a fine micromanipulator (Huxley Wall type MP-85, Sutter). To increase the chance of
impaling ASC
E, I oriented the micromanipulator perpendicular to the ipsilateral ASC
E’s
primary neurite (Figure 6 C). To impale DSC, I oriented the micromanipulator perpendicular
to the contralateral DSC’s primary neurite (Figure 6 C). The intracellular electrode was
connected to an amplifier (SEC-05X, npi, Tamm, Germany), which was used in
discontinuous current clamp mode (1/4 duty cycle, 5kHz current filter) with switching
frequencies between 28kHz to 32kHz. I also used this amplifier for constant current
injections to hold V
mat a desired potential.
Signals were digitized with either A/D converter Micro1401-3 with Expansion ACD12 (CED, Cambridge, UK) or Digidata 1440A (Molecular Devices, Sunnyvale, CA, USA) and recorded with Spike2 (CED) or Clampex (Molecular Devices), respectively. All signals were digitized at 10kHz, except extracellular recordings using Spike2, which were digitized at 5kHz. Depending on the setup, a stimulator (MS 501, Electronics Lab) was used to trigger execution of a stimulus protocol (with Spike2), or directly delivered the stimuli via the intracellular amplifier (with Clampex).
Saline and chemicals were delivered via a gravity-fed perfusion system and removed with a vacuum pump. Flow rate was 0.5-1ml/min when searching for neurons and 4-5ml/min during the experiments. Wash-in and wash-out was considered complete after 40ml (approx. 10min) because V
mhad reached steady state by then. Initial wash-in of LowCa
2+saline was at least 20min.
2.3 Electrophysiological Protocols
I conducted the experiments with the network either intact or the neurons chemically isolated. In the intact network I set the excitation level with different carbachol
Figure 6: Experimental setup to record the Ascending (ASCE) and Descending Coordinating Neuron (DSC). A:
Isolated abdominal ganglia chain in a Petri dish with pin electrodes to record power-stroke (PS) activity. B: Close- up of one hemiganglion with one suction electrode placed on the anterior MnT above the Lateral Giant Axon (LG) to extracellularly record ASC, and the intracellular electrode to record ASCE in the Lateral Neuropil (LN). C: Schematics showing the location of extracellular suction electrodes (extra) and intracellular electrodes (intra) to record the coordinating neurons in one hemiganglion. Shaded area: LN; dashed line: LG; A2- A5: Abdominal Ganglion 2-5; N1: Nerve 1; N2: Nerve 2;
PS: Power-stroke; RS: Return-stroke.
Materials and Methods
Biotechnology, Dallas, TX, USA) concentrations (in µM: 50, 75, 100) in saline containing 50nM crustacean cardioactive peptide (CCAP; Bachem, Bubendorf, Switzerland).
Carbachol is a cholinergic agonist, acting both on muscarinic and nicotinic receptors.
Therefore, it can both activate the swimmeret system and modulate its excitation level. The thereby induced fictive swimming is characterized by similar frequencies as reported for the intact crayfish swimmeret beating (Braun and Mulloney, 1993). EdCl is an acetylcholine esterase inhibitor and does not activate the swimmeret system on its own. Therefore, I used a combination of CCAP to activate the system (Mulloney et al., 1997) and different EdCl concentrations to modulate the output. Braun and Mulloney (1993) have shown that application of an ACh-esterase inhibitor increases burst frequency similar to application of carbachol. To chemically isolate the neurons, I used Low Ca
2+/High Mg
2+saline (LowCa
2+saline; in mM: 118.0 NaCl, 5.4 KCl, 52.0 MgCl
2, 2.4 CaCl
2, or 195.0 NaCl, 5.4 KCl, 16.4 MgCl
2, 0.6 CaCl
2) to block transmitter release at all chemical synapses (Tschuluun et al., 2001). In the synaptically isolated neurons, I set the excitation level with the above mentioned carbachol concentrations. Occasionally, I added low concentrations of tetrodotoxin (TTX;
BioTrend, Cologne, Germany) to block any residual spike-driven modulations (TTX in µM:
0.1 – 0.5 without carbachol, 0.1 with carbachol). All experiments were conducted at the three different excitation levels mentioned above. Even with run-down of the preparations, recordings with good quality could be obtained for two hours.
When stimulus protocols were executed, the neurons were held at the same trough potential (most hyperpolarized membrane potential during an oscillatory cycle), usually sub-threshold at -55mV to -75mV. To measure input resistances (R
in), at least 100 brief hyperpolarizing currents (-1nA, 50ms – 100ms) were delivered every 5sec at each chemical concentration. R
inwas measured in both intact network and isolated conditions.
To reveal history effects, isolated neurons were held at -55mV and stimulated with paired triangular ramps every 10s (Figure 7). Ramps differed in amplitude (in nA: 0.5, 0.75, 0.1) and duration (in ms: 250, 500, 1000), giving 3 x 3 combinations for ramp stimuli. Except for two experiments, the ramps had 1/2 duty cycle. In two experiments the 1s ramps had 2/3 duty cycle. Periods and durations of ramp stimuli were in the same range as the observed motor
Figure 7: Schematic of paired ramp stimulus.
Isolated neurons were stimulated with two consecutive ramps of three different amplitudes and three different durations. One stimulus sweep lasted ten seconds.
output (Mulloney et al., 2006). Ramp stimulation experiments were done in collaboration with T. Michael Wright (Mulloney Lab, UC Davis). V-I curves were obtained by injecting de- and hyperpolarizing currents (in nA: ±0.5, ±0.75, ±1) for at least 10 cycles. After the experiment, the neurons were filled with dTR for at least 10min and up to 2h (+1nA at 2Hz, 250ms pulse duration). Stained neurons were processed immediately if the axon and soma were clearly visible. If not, ganglia were kept at 4°C until dye diffusion was sufficient.
2.4 Analysis
I only analyzed experiments in which ASC
Eor DSC were the only stained neurons and measurements were completed at two excitation levels minimum. Data were analyzed semi- automatically using Spike2 scripts or MATLAB (versions R2014b and R2016a, MathWorks, Natick, MA, USA). If voltage traces with different sampling frequencies (5kHz and 10kHz, see 2.2) were analyzed in MATLAB, I had to upscale the lower sampled data by duplicating each value. This may result in an error of 0.2ms in event detection that is negligible for this study and preferable over down sampling intracellular recordings. The following parameters were evaluated:
Membrane potential (V
m)
As oscillating neurons do not have a ‘resting potential’ I used the trough potential at the most hyperpolarized value during a cycle instead (Figure 8 A).
Spikes per burst
Number of ASC
Eor DSC spikes during one burst.
Burst duration
Duration between a burst’s first and last spike (Figure 8 A).
Cycle period
Duration between the beginning of a reference burst and the beginning of the consecutive burst (Figure 8 A).
Phase
First, I measured the latency from the beginning of a cycle to the occurrence of an event during that cycle. Second, I calculated phase by dividing the latency of an event (e.g.
stimulus beginning, Figure 8 A) by cycle period.
Input resistance (R
in)
Using Ohm’s law, I calculated R
inby dividing V
mdeflection by the injected current. R
inwas calculated with respect to the phase of the stimulus.
Materials and Methods
Burst strength
During PS or RS bursts up to 30 MNs can be active at the same time (Mulloney, 1997;
Mulloney and Hall, 2000), resulting in overlapping spikes in the extracellular recording (Figure 8 Bi). Burst strength is an approximation for unit amplitude and unit frequency:
Higher activity of larger units results in a higher burst strength than lower activity of smaller units (Mulloney, 2005). Extracellular recordings were rectified by squaring the voltages and smoothed (Figure 8 Bii). The smoothing kernel was a Gaussian window (width = 1001) that was vertically shifted to zero and normalized to unity gain at DC. The area under the smoothed curve above noise threshold between burst beginning and burst end was calculated. Burst strength was calculated by dividing the area by burst duration.
Because absolute burst strength depends on the signal-to-noise ratio of the recording, absolute values cannot be compared between experiments and were thus normalized to the maximum burst strength in each experiment across excitation levels. The bursts immediately before, after, and during stimulations were excluded from the dataset because coordinating neurons can influence the motor output of their home ganglion (Mulloney and Hall, 2007a).
Inhibition strength
DSC inhibition strength during PS was calculated analog to burst strength (Figure 8 Biii).
The voltage trace was offset to the average voltage of the burst’s first spike’s afterhyperpolarization (‘threshold’ in Figure 8 Biii). The area’s absolute value of the intracellular voltage trace between DSC burst end and burst begin below threshold was
Figure 8: Evaluated parameters for intra- and extracellular recordings. A: Parameters measured in the raw recordings. B: Measurement of PS burst strength and DSC inhibition strength. Shaded areas indicate calculated areas. Bi: Raw PS recording. Bii: Rectified (squared) and smoothed PS. Red line is threshold. Biii: Raw DSC recording. Red line is threshold. DSC: Descending Coordinating Neuron, PS: Power-stroke.
calculated and divided by the interburst interval to get inhibition strength. Thus, not only the graded inhibition is taken into account but also the amount and amplitude of the inhibitory postsynaptic potentials (IPSP) in the interburst.
Statistics and Data Presentation
I used non-parametric tests in MATLAB for statistical analyses. Two data sets were compared with a rank-sum test if unpaired or Wilcoxon signed rank test if paired. Multiple data sets were compared with the Kruskal-Wallis test with Tukey’s post-test for multiple comparisons. Significance level was α = 0.05.
Linear regressions and their adjusted regression coefficients (R
2- adj.) were calculated with MATLAB’s built in linear model fit (fitlm). Nonlinear regression lines were calculated with MATLAB’s built in polynomial curve fit (polyfit). Usually, median values are given in the text. Otherwise, means are notated with ± standard deviation.
All figures were prepared in MATLAB and Corel Draw X (Corel Corporation, Ottawa, Canada). Dot-density plots were created with Molly Rossow’s Dot-Density-Plot script for MATLAB (Rossow, 2013).
In most figures, plots from one individual experiment illustrate representative results.
The respective plots for all analyzed experiments are located as ‘Supplementary Figures’ in the Appendix. “N” denotes the number of animals used for an experiment, “n” denotes the measurements per animal.
2.5 Histology
After intracellular staining with fluorescent dyes, samples were protected from light in the following steps. I fixed whole ganglia with stained neurons for 2h in either Roti®- Histofix 4% (Carl Roth, Karlsruhe, Germany), 4% paraformaldehyde (Serva, Heidelberg, Germany) + 1.25% glutaraldehyde (Serva; not usable for antibody staining) in 0.1M phosphate buffered saline (PBS), or 4% paraformaldehyde + 0.5% glacial acetic acid in PBS.
Afterwards, ganglia were rinsed 3x10min in PBS. If the fixative contained glutaraldehyde, autofluorescence was reduced by 10min incubation in 0.25% sodium borohydride in PBS with subsequent 3x10min washing in PBS.
For antibody staining, ganglia were first washed 3x10min in PBST-NGS (PBS with 1%
Triton-X-100, 5% normal goat serum (Vector Laboratories, Burlingame, CA, USA), 0.1%
NaAc). Second, they were incubated 36h in 1:400 rabbit anti-serotonin whole serum (Sigma-
Aldrich, Munich, Germany) in PBST-NGS on a rotator at 4°C. Afterwards, ganglia were
Materials and Methods
rabbit conjugated to Alexa Fluor 488 (abcam, Cambridge, UK) in PBST-NGS. Ganglia were then washed 4x1h in PBS.
All ganglia were dehydrated in an ascending ethanol series (10min each: 30%, 50%, 70%, 90%, 96%, 2x100%) and mounted in methyl salicylate (Carl Roth) on microscope slides with a cavity.
2.6 Microscopy
Overview scans for neuron identification were obtained on a fluorescence microscope (BX61, Olympus, Hamburg, Germany). For 5-HT labeled neurons, I used a confocal microscope (LSM 500 Meta, Zeiss, Oberkochen, Germany) with 10x magnification for overview and 40x magnification (oil) for details in the axonal region. dTR excitation wavelength was 543nm, Alexa Fluor 488 excitation wavelength was 488nm, filtered by a primary dichroic beamsplitter (HFT 488/543). Emission of dTR was filtered by a 650nm long pass filter, emission of Alexa Fluor 488 by a 505-530nm band pass filter.
Scans were done in 5µm-10µm z-stacks at 10x magnification and 2µm z-stacks at 40x magnification. Maximum intensity projections were made with either Helicon Focus (Helicon Soft Ltd., Kharkov, Ukraine) or Zen 2011 black edition (Zeiss). Brightness and contrast were adjusted for each channel separately with Photoshop CS5 (Adobe Systems, San José, CA, USA).
2.7 MALDI-TOF Mass Spectrometry
This part of the study was done in collaboration with Susanne Neupert (University of Cologne). MALDI (Matrix-Assisted Laser Desorption/Ionization)-TOF (Time of Flight) mass spectrometry (MS) is a soft ionization technique used in mass spectrometry, allowing the analysis of biomolecules, such as proteins, peptides, lipids, and sugar, as well as large organic molecules such as polymers and other macromolecules. In total, three steps characterize the methodology of MALDI. In a first step, a suitable matrix is mixed to a sample onto a metal plate. Second, laser pulses are applied to the embedded sample mixture, triggering ablation and desorption of the matrix and embedded biomolecules. In a final step, the molecules are ionized by being protonated or deprotonated. During the TOF step, the ions are separated depending on the mass-to-charge ratio. Larger ionized molecules need more time to reach the detector than smaller ones.
Ganglia as well as the single cells were covered in Lymnaea saline (in mM: 46 NaCl, 4.0
KCl, 7.5 CaCl
2at pH 7.4) containing 33% glycerol to stabilize the fluorescent dye. Stained
somata of ASC
E, DSC, or motor neurons (control) were cleanly pulled out from the ganglion
with a glass capillary under a stereo fluorescence microscope (V12 Lumar, Carl Zeiss AG, Göttingen), and transferred to a stainless steel sample plate for MALDI-TOF MS analysis.
After air-drying the samples at room temperature, 20nl - 30nl of α-cyano-4- hydroxycinnamic acid (CHCA) as matrix was applied using a glass capillary. An UltrafleXtreme TOF/TOF mass spectrometer (Bruker Daltonics, Bremen, Germany) was used to acquire mass spectra in positive ion mode. Settings were optimized for mass ranges of 0 – 300Da. MS/MS was performed with LIFT technology by an acceleration set at 1 kV.
The number of laser shots used to obtain a spectrum varied from 1000 to 5000 depending on signal quality. Acetylcholine was verified using MS/MS fragmentation pattern and compared using fragmentation data provided by Scripps METLIN Center of Metabolomics (https://metlin.scripps.edu/index.php). Data were processed with FlexAnalysis (version 3.4, Bruker).
A principal component analysis (PCA) was performed on the mass spectra peaks from the individual neurons. With this method, extensive or high-dimensional datasets can be readily visualized by converting possibly correlated variables into new, linear uncorrelated variables (the principal components). This can reduce the dimensionality of a dataset and enhance differences across data. In our analysis, we projected the spectral data for the three classes of neurons into a three-dimensional subspace of the first three principal components. This allowed for a visual discrimination of coordinating and motor neurons.
Single-cell MALDI-MS with subsequent PCA for example allows discrimination of
metabolitic heterogeneity in unicellular organisms (Amantonico et al., 2010) or
identification of three subspecies in the Mycobacterium abscessus complex (Kehrmann et al.,
2016).
Results
3 Results
In this study, I investigated the coordination of distributed neural oscillators. Two neurons in each hemiganglion of the crayfish swimmeret system serve this task. Both encode the activity state of their own module and send the information as bursts of spikes to the other ganglia where it is integrated and relayed to the CPG (Mulloney et al., 2006;
Smarandache et al., 2009; Smarandache-Wellmann et al., 2014). The aims of this thesis were to unravel the cellular properties of ASC
Eand DSC that allow the precise encoding of activity at different excitation levels, and to identify their transmitters at the synapse to ComInt 1. Because the general features how each ASC
Eand DSC encodes information about its home ganglion’s activity state are similar (Mulloney et al., 2006), and I observed no obvious differences for coordinating neurons from different ganglia, I assumed that tuning mechanisms are homolog across ganglia and did not differentiate between segments.
PART I: Cellular Properties
ASC
Eand DSC encode information about timing, duration, and strength of their home ganglion’s motor output as bursts of spikes (Mulloney et al., 2006). If PS burst strength varies spontaneously, ASC
Etracks this changes linearly by producing more spikes at higher PS burst strengths (Smarandache-Wellmann et al., 2014). Less is known about DSCs ability to track changes in burst strength. Paul and Mulloney (1986) report only a loose correlation between the amount of DSC spikes and PS and RS, respectively.
The focus of this chapter is on characterizing the electrophysiological properties of the coordinating neurons. I investigated the mechanisms shaping the bursts and the encoding of motor activity at different excitation levels. Subsequently, I asked which of these properties arise from the network activity and which are intrinsic to ASC
Eand DSC.
Mulloney et al. (2006) stated that ASC
Etracks PS bursts. The authors also found correlations between DSC activity with both PS and RS. I never obtained RS recordings with a good enough signal-noise ratio for analysis; therefore, I also correlated DSC activity to PS.
3.1 Isolating Neurons
With bath application of chemicals, it remains elusive whether observed changes in neuronal activity and properties are a direct effect, or mediated by the network, or both.
Therefore, I did my experiments in the intact (i.e. synaptically connected) network and in
neurons chemically isolated with LowCa
2+saline. When I applied LowCa
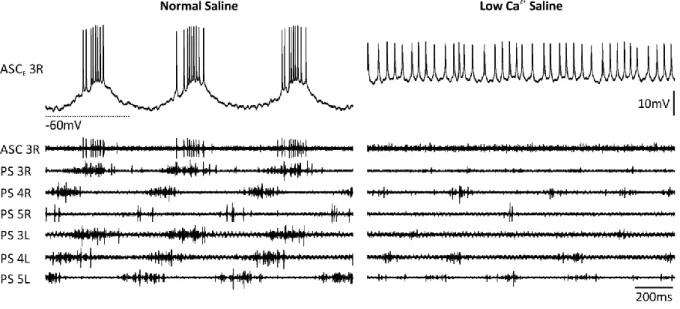
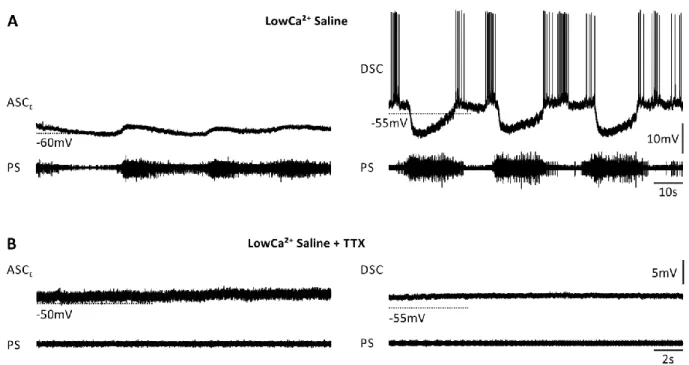
2+saline to suppress transmitter release, PS became tonically active with sporadic synchronized motor bursts (Figure 9). Coordinating neurons became tonically active in half of the experiments.
Spike amplitude was reduced, most likely by sodium channel inactivation, because the membrane potential (V
m) depolarized compared to trough potential in normal saline.
Figure 9: Activity of PS and ASCE when the network was intact (left) or chemically isolated (right). Preparations became tonically active after application of LowCa2+ saline. Spike amplitude was reduced due to sodium channel inactivation.
In some isolation experiments, PS MNs occasionally synchronized to erratic PS bursts that correlated with V
mmodulation in the coordinating neurons (Figure 10 A, 8 ASC
Eexperiments, 2 DSC experiments). This indicated an incomplete isolation or block of transmitter release. Because of the overall tonic activity, I assumed that the CPG was silenced or at least locked. With the addition of TTX to the LowCa
2+saline spiking was blocked and I never observed V
mmodulations in the coordinating neurons (Figure 13 B).
In the following, I demonstrate that the response of the coordinating neurons to changes
in excitation is different in the intact network compared to synaptic isolation, and that the
network effect masked the direct effect of carbachol. Because of the similar effects of
carbachol and EdCl on the motor output and the coordinating neurons, I combined those
results when discussing the intact network in the following unless noted otherwise. For the
same reasons I combined the results from LowCa
2+saline with and without TTX.
PART I: Cellular Properties
Figure 10: Recordings of the isolated coordinating neurons ASCE and DSC, and power-stroke (PS) activity in their home ganglion in LowCa2+ saline without (A) and with (B) TTX. Without TTX, the membrane potential of the coordinating neurons was modulated in phase with the PS.
3.2 Different Mechanisms Shaped ASC
Eand DSC bursts
ASC
Eand DSC are morphological mirror images (Figure 2). Their V
moscillates phase- locked with PS and RS, respectively, and they fire bursts of spikes during their depolarized state. I used preparations that switched between an active and quiescent state to gain insight on the coordinating neurons’ behavior during these transitions (Figure 11).
During the quiescent state, ASC
Ewas hyperpolarized and not spiking (Figure 11 A).
Immediately before PS activity started, ASC
Edepolarized. On top of this depolarization, V
moscillated with bursts of spikes during peak oscillation in phase with PS. Very weak PS bursts were accompanied by V
moscillations without spikes. After PS activity ceased, ASC
E’s V
mhyperpolarized to its resting level (13 of 19 experiments). In the five remaining experiments resting level equaled trough potential. No tonic depolarization was obvious during the transition to the active state, and no hyperpolarization during the transition to the quiescent state.
In contrast, DSC was tonically firing if motor activity was quiescent (Figure 11 B). When the system is active, DSC oscillates in antiphase to the PS (Namba and Mulloney, 1999).
Oscillations seemed to be mediated by strong inhibitory synaptic input during each PS burst
(12 of 12 experiments). In this interburst interval, prominent postsynaptic potentials (PSPs)
appeared in DSC but not ASC
E(Figure 11 insets). Inhibition during weak PS bursts did not
hyperpolarize DSC as much as during strong PS bursts (Figure 11 B; see also Figure 13 C).
Figure 11: Activity of coordinating neurons in systems switching between active and quiescent states. A: Intracellular recording of ASCE and respective PS. Inset shows one ASCE cycle indicated by the grey box. B: Intracellular recording of DSC and respective PS. Inset shows one DSC cycle indicated by the grey box.
Figure 12: Shaping of ASCE bursts. A: Intracellular ASCE recording with hyperpolarizing (left), no, or depolarizing (right) current injection. B: Hyperpolarizing ASCE reduced oscillation amplitude.