Using microarray technology to find novel genes involved in somitogenesis
I n a u g u r a l - D i s s e r t a t i o n
zur
Erlangung des Doktorgrades
der Mathematisch-Naturwissenschaftlichen Fakultät
der Universität zu Köln
vorgelegt von
Carmen Czepe
aus Laufen
Köln, 2005
Berichterstatter:
Prof. Dr. D. Tautz Prof. Dr. W. Werr
Tag der mündlichen Prüfung:
1. Dezember 2005
Table of contents:
Table of contents: ……….. 1
Summary:……… 4
Zusammenfassung:……….. 5
1. Introduction:……… 7
1.1. Somitogenesis………..7
1.2. Aim of this thesis……….10
1.3. Microarray technology……….10
2. Material and Methods: ………13
2.1. Materials: ………13
2.1.1. Chemicals, kits and enzymes………. 13
2.1.2. Equipment……… 15
2.1.3. Animals ………16
2.1.4. Hormones………. 17
2.1.5. Primers………. 17
2.1.6. Solutions……….. 19
2.2. Methods:………. 22
2.2.1. Preparation of embryos ………22
2.2.1.1. Fish……… 22
2.2.1.2. Mice……….. 22
2.2.2. Mixed embryogenesis stage cDNA-Library……… 23
2.2.2.1. Picking of colonies……… 23
2.2.2.2. Automated colony PCR in 96 well format……… 24
2.2.2.3. PCR-product purification in 96 well format………. 24
2.2.2.4. Rearraying of purified PCR products……….. 24
2.2.3. Sigma Genosys mouse oligo library and zebrafish library………. 25
2.2.4. PCR and in vitro transcription of the Lambda-Control genes for the cDNA chip………. 26
2.2.5. Printing on Microarray slides……….. 27
2.2.6. SYBR green II staining ………27
2.2.7. Labelling using the Fairplay-kit (Stratagene)……….. 28
2.2.8. Labelling using the Cyscribe-labelling kit………... 29
2.2.9. Hybridisation on microarray slides……….. 30
2.2.10. Scanning of microarray slides ………31
2.2.11. Preparation of DIG labelled Antisense probes………... 31
2.2.12. in situ Hybridisation ………... 32
2.2.12.1. Rehydration of embryos………. 32
2.2.12.2. Heat treatment of zebrafish embryos……….. 32
2.2.12.3. in situ Hybridisation using the hybridisation machine………. 32
2.2.12.4. Staining reaction with BM purple………... 33
2.2.12.5. Photographing of stained embryos………..33
2.2.13. DNA-Sequencing with the ABI- Sequencer……….. 33
2.2.14. mRNA Isolation using the µMACs-Kit………. 33
2.2.15. 1
stsynthesis……… 34
3. Results:……… 35
3.1. General remarks on the different approaches………. 35
3.2. Establishment of microarray-technology………... 35
3.2.1. Printing……….35
3.2.2. Labelling and Hybridisation……… 36
3.2.3. First results using the mixed embryogenesis stages cDNA library…………. 36
3.3. Mouse oligo library………. 38
3.4. Zebrafish oligo library……….41
3.4.1. General comments………41
3.4.2. Des/notch1………43
3.4.3. aei/deltaD………. 44
3.4.4. bea/deltaC……… 45
3.4.5. Su(H)……… 46
3.4.6. Validation……… 47
3.4.6.1. General remarks……… 47
3.4.6.2. Category I: Down-regulation in the PSM………. 47
3.4.6.2.1. Mesogenin……….. 47
3.4.6.2.2. zfdIII………48
3.4.6.3. Category II: Down-regulation in the PSM and other regions………49
3.4.6.3.1. Her6………49
3.4.6.3.2. mta………. 50
3.4.6.3.3. ztsg………. 50
3.4.6.4. Category III: Down-regulation in other regions of the embryo……… 51
3.4.6.4.1. D249……….. 51
3.4.6.4.2. ziro5………51
3.4.6.5. Category IV: Up-regulation in the PSM………53
3.4.6.5.1. Cx43.4……… 53
3.4.6.6. Category V: Up-regulation in other regions of the embryo……….. 53
3.4.6.6.1. Similar to MMP1A………. 53
3.4.6.6.2. p38a………... 54
3.4.6.6.3. ziro7………... 54
3.4.6.7. Category VI: The regulation pattern could not be verified………... 55
3.4.6.7.1. Hsp90beta……….. 55
3.4.6.7.2. Pbx4………... 57
4. Discussion………... 58
4.1. Microarray………...58
4.1.1. Experimental design and sampling……….. 58
4.1.1.1 Sampling……… 58
4.1.1.2. Experimental design………. 59
4.1.2. Normalization……….. 60
4.1.3. Statistics and choosing of candidates……….. 60
4.2. Genes found using microarray technology, which might play a role in somitogenesis: ………61
4.2.1. General notes on candidates……….61
4.2.2. Zebrafish microarrays……….. 61
4.2.2.1. cDNA Microarray………. 61
4.2.2.2 zebrafish oligo microarrays………63
4.2.2.3. Genes found in microarrays using zebrafish embryos, which have not been validated and comparison of genes found……….. 66
4.2.3 Mouse oligo library………... 68
5. References:……….. 70
Acknowledgements:……… 79
Erklärung:……… 80
Curriculum vitae:……… 81
Summary:
During the development of vertebrates the body is subdivided into repeated units, the somites. They are generated from the presomitic mesoderm (PSM) and are flanking the notochord on both sides. For this coordinated process components of the Delta- Notch signalling pathway are important.
Novel genes involved in somitogenesis were searched using microarray-technology.
This technique had to be established in the lab and this was done using a cDNA library, which was prepared from embryos of mixed embryogenesis stages. The basic protocols were established like printing, labelling and hybridisation. The usage of spiked in controls was established as well. The controls were genes from the bacteriophage lambda.
Later the cDNA library was used to compare the expression of wt and fss embryos.
The fss mutant is linked to the gene Tbx24, which is no component of the Delta-Notch pathway, but belongs to the fused somite type mutants.
To compare the other fused somite type embryos against wt the zebrafish oligo library from Sigma-Genosys was used. The other mutants are des, bea and aei. These mutants are defective in components of the Delta-Notch pathway, des in notch1a, bea in deltaC and aei in deltaD.
As these components are involved in the starting of the cascade and because of this some rescue mechanisms might occur the mediator of the pathway Su(H) was used as well. For this gene morpholino knock down embryos were produced.
The PSM consists of several compartments, namely a posterior, an intermediate and an anterior compartment. The PSM of the zebrafish was not dissected in these parts, as it is very small. The PSM of the mouse is bigger and therefore it was cut in an anterior and a posterior part, where the anterior part contains the intermediate and the anterior compartment. For this approach the mouse oligo library from Sigma-Genosys was used.
The candidate genes found in these screens had to be validated by another method.
The in situ hybridisation was chosen, as this allows the localisation of the expression
and validation. For the mouse PSM screen this method was not used. Here the
literature was scanned to find the expression pattern of the genes found. Doing this
validated two candidates from this approach.
The genes found in the zebrafish screens were validated using the in situ hybridisation. Genes with an interesting expression pattern will be further characterised, i.e. their functional role in somitogenesis will be elucidated.
Zusammenfassung:
Während der Entwicklung der Vertebraten wird der Körper in sich wiederholende Einheiten unterteilt, die sogenannten Somiten. Diese werden von dem präsomitischen paraxialen Mesoderm (PSM) gebildet und flankieren das Notochord zu beiden Seiten.
Für den koordinierten Ablauf dieses Prozesses ist die Expression von Komponenten des Delta-Notch- Signaltransduktionsweges wichtig.
Um neue Gene, die eine Rolle in der Somitogenese zu finden, wurde die Mikroarraytechnologie verwendet, die allerdings zunaechst noch etalbiert werden musste. Dafür wurde eine cDNA Bank verwendet, die aus Embryonen in verschiedenen Entwicklungsstadien hergestellt wurde. Die grundlegenden Protokolle, wie Printen, Markieren und Hybridisierung, wurden mit dieser Bank etabliert. Die Verwendung von zugegebenen Kontrollen wurde ebenfalls eingeführt. Diese Kontrollen waren Gene des Bakteriophagen Lambda.
Danach wurde diese Bank verwendet um die Expression zwischen wt und fss Embryonen zu vergleichen. Die fss-Mutante ist in dem Gen Tbx24 defekt. Dieses Gen gehört nicht zum Delta-Notch Signalweg, aber zu den fused somite type Mutanten.
Die Zebrafisch oligo Bank von Sigma-Genosys wurde für den Vergleich der fused somite type Mutanten mit den Wildtypembryonen herangezogen. Die Mutanten die noch zu dieser Klasse gehören sind des, bea und aei. Diese Mutanten haben Defekte in Komponenten des Delta-Notch Signalweges, des in notch1a, bea in deltaC und aei in deltaD.
Da diese Komponenten am Beginn der Kaskade stehen und da es deshalb sehr wahrscheinlich ist das andere Teile der Kaskade einspringen könnten, wurde der Mediator des Signalweges, Su(H) ebenfalls verwendet. Für dieses Gen wurden Morpholino knock down Embryos erzeugt.
Das PSM besteht aus mehreren Teilen, nämlich dem posterioren, dem intermediären
und dem anterioren Kompartment. Das PSM des Zebrafisches wurde nicht in diese
Teile zerschnitten, da es sehr klein ist. Das PSM der Maus ist grösser und deshalb
wurde es hier in einen anterioren und einen posterioren Anteil geteilt, wobei der
anteriore Teil das anteriore und das intermediäre Kompartment umfasste. Für diesen Ansatz wurde die Maus Oligo Bank von Sigma-Genosys verwendet.
Die Kandidatengene die in diesen Versuchen gefunden wurden, muβten noch durch eine andere Methode überprüft werden. Die in situ Hybridisierung wurde ausgewählt, da sie zusätzlich zur Validierung auch eine Lokalisierung der Expression erlaubt. Für den Maus-PSM Screen wurde diese Methode allerdings nicht verwendet. In diesem Fall wurde in der Literatur nach Expressionsmustern der gefundenen Gene gesucht.
Zwei Kandidaten wurden auf diese Art und Weise überprüft.
Die Gene, die in den Zebrafischversuchen entdeckt wurden, wurden durch die in situ
Hybridisierung validiert. Gene, die ein interessantes Expressionsmuster zeigen
werden weiter charakterisiert, das heiβt ihre funktionelle Rolle in der Somitogenese
wird untersucht werden.
1. Introduction:
1.1. Somitogenesis:
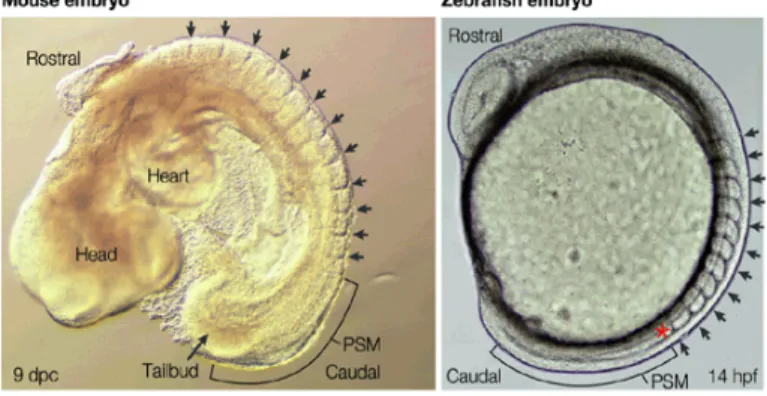
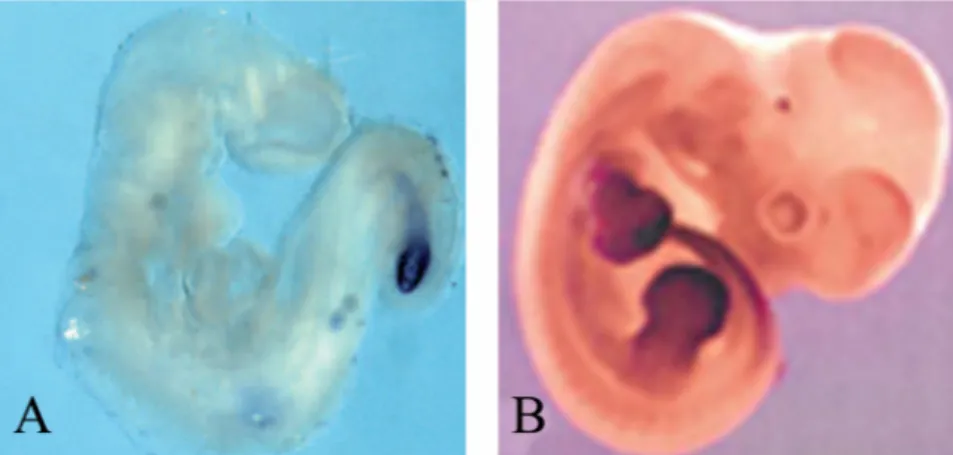
Somites are a feature shared by all vertebrates. They are formed during
embryogenesis in an ordered manner from anterior to the posterior, are flanking the notochord on both sides and are generated from the presomitic mesoderm (PSM) (Fig.
1). Three phases can be distinguished in somitogenesis: first, prepatterning of the PSM and establishment of the rostro-caudal polarity of the future somites, second, the formation of the somite border and third, the differentiation of the somites to generate the muscle, vertebrae, intravertebral disks and ribs of the trunk and tail (Maroto and Pourquiè, 2001).
Figure 1: The left picture shows a mouse embryo and the right a zebrafishembryo during omitogenesis. The black arrows point to somite borders and the brackets demarcate the PSM (presomitic mesoderm), from which new somites are generated.
(This picture was taken from Saga and Takeda, 2001).
Three classical models try to explain the periodicity of somite formation, namely Meinhardt’s model, cell cycle model and the clock- and wavefront model.
Meinhardt’s model postulates that prior to the formation of each somite the cells in the presomitic mesoderm undergo several rounds of oscillation between two alternate stages corresponding to the prospective anterior and posterior compartment of the somite (Meinhard, 1986).
The cell cycle model tries to link the cell cycle to somitogenesis. Evidence for this
comes from chicken embryos, which were heat-shocked and showed several
segmentation abnormalities that are repeated along the AP (anterior-posterior) axis
with a regular interval of six to seven somites (Primett et al., 1988). It takes
approximately 10 hours in the chicken to form this number of somites and this time- interval is needed to complete one cell cycle in the PSM (Primett et al., 1989).
Therefore it was concluded that the cell cycle is the internal clock, which drives somitogenesis, but this theory has not been verified by further experiments.
Nevertheless there is some linkage between somitogenesis and cell cycle, as Kawahara et al., 2004 suggest. They knocked down GADD45beta, which is involved in cell cycle control. The embryos displayed a disorganized cyclic expression of her1 and of segmented expression of MyoD.
Cooke and Zeeman formulated the clock and wavefront model in 1976. Here two phenomena are needed for periodic somite formation. First, there must be an intrinsic clock driving oscillations of presomitic cells between a permissive and a non- permissive state. This is similar to the Meinhard’s model, but they (Cooke and Zeeman, 1976) also postulated the existence of a wavefront travelling along the body- axis, which establishes a gradient of differentiation. Somite boundaries are formed, when oscillating cells of the PSM are reached by the wavefront. This model is most concurrent with the experimental data.
First molecular evidence for the existence of an oscillator was found in chicken (Palmeirim et al., 1997). It was detected that hairy 1, a basic Helix-Loop-Helix (bHLH) transcriptional repressor showed different patterns of expression in the PSM, although the chicken embryos used, were at the same developmental stage. Dynamic expression patterns were found to be repeated every 90 minutes, which is the time to form one pair of somites in the chick.
This oscillation was also detected to be an independent property of the PSM cells and not due to cell migration or a diffusible signal. Cells of the PSM undergo several rounds of oscillations before they become a somite.
Most of these cycling genes belong to the Hairy/Enhancer-of-Split (Hes) family which are targets of the Delta-Notch pathway as for example hairy1 and hairy2 in the chicken (Palmeirim et al., 1997), hes1 and hes7 in the mouse (Jouve et al., 2000;
Bessho et al., 2001) and her1 and her7 in the zebrafish (Holley et al., 2000; Oates and Ho, 2002).
As Delta-Notch signalling plays an important role in somitogenesis it is interesting to
see, which phenotypes are displayed by the mutants. Three mutants of the so-called
fused somite type are defect in the Notch pathway, namely des (notch1a), aei (deltaD)
(van Eeden et al., 1996) and bea(DeltaC) (personal communication Holley). These
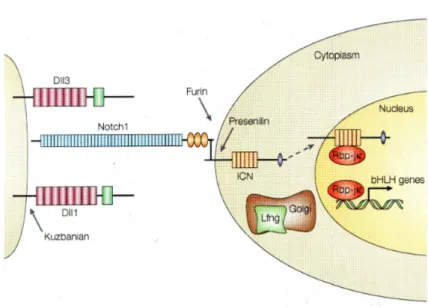
mutants form several anterior somites and then cease somitogenesis. Therefore embryos of these mutants were chosen for the microrarray experiments described in this thesis. As the genes for which these mutants are defective are at the beginning of the signalling cascade and therefore “rescue and redundancy effects” are very likely to occur, the mediator of the Delta-Notch pathway, Suppressor of Hairless (Su(H)) (Sieger et al., 2003) was used as well (Fig. 2). As no mutant for this gene has been generated so far, the morpholino knockdown embryos were used (kindly provided by Dirk Sieger).
Figure 2: Scheme of the Delta-Notch pathway: The receptor Notch (Notch1) binds it ligand Delta (Dll1 or 3). The binding leads to cleavage (Furin and Presenilin) of the Intracellular Notch domain (ICN), which translocalises to the nucleus. In the nucleus the ICN binds Su(H) (Rbp-jк) and activates the target genes. If Su(H) is not bound to the ICN it acts as repressor.
This picture was taken from Sada andTakeda, 2001.
There is another mutant belonging to the fused somite type, namely fused somites (fss) (van Eeden et al., 1996). The mutant embryos form no somites at all. The fss mutant was linked to the gene Tbx24 (Nikaido et al., 2002), which is expressed in the intermediate and anterior PSM, but excluded in the posterior. This expression pattern might suggest that this gene plays a role in the wavefront, but the key-player of this part of somitogenesis seems to be Fgf8. It forms a gradient in the PSM were the concentration of Fgf8 is highest in the posterior part (Dubrulle et al., 2001). As Fgf8 is a growth factor and part of the FGF/MAPK (mitogen-activated protein kinase) signalling cascade it is perhaps needed to keep the cells in the posterior and intermediate compartment of the PSM in an undetermined or undifferentiated state.
After the concentration falls under a certain threshold in the anterior PSM the cells are
able to form the epithelia of the somites (Sawada et al., 2001).
1.2. Aim of this thesis:
Microarray technology was used to identify genes involved in the different somitogenesis events in zebrafish by comparing the expression in wildtype (wt) embryos with expression in different mutants belonging to the fused somite type class (van Eden et al., 1996) and Su(H)- morpholino knock down embryos (Sieger et al., 2003) that show defects in somite formation.
As experiments showed that there are several different compartments in the PSM it seemed worth to try to dissect it in at least a posterior and an anterior part. The zebrafish embryo is very small and the PSM even smaller, therefore it seemed worthwhile to do an experiment in the mouse, which has a bigger PSM. Here the PSM was cut in the two parts and those were hybridised on a chip. The border between anterior and posterior PSM was the umbilical chord, which was a good morphological feature and coincides with the expression of some genes, f.e. notch1 (Calceran et al., 2004) at E9.5.
The candidates found in the screens were validated using in situ hybridisations.
Genes, which show a promising expression pattern are suitable for a further characterisation, i.e. their functional role in somite formation will be elucidated.
Before the microrarray technology could be used for finding new somitogenesis genes it was necessary to be establish it.
1.3. Microarray technology:
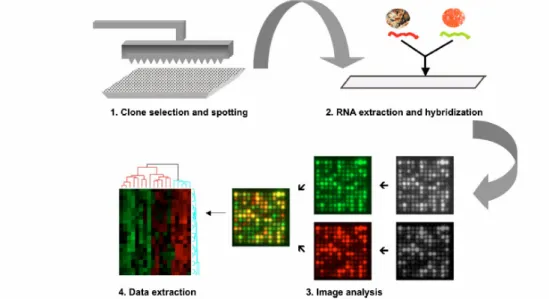
This technology allows the comparison of gene expression between two or more states. This can be diseased and healthy, treated or untreated with chemicals or as used in this thesis between wildtype and mutant animals (Fig. 3).
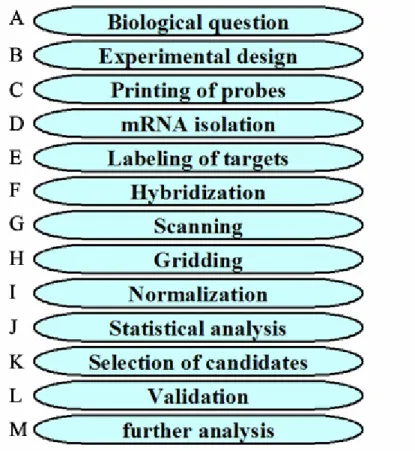
A typical microarray experiment consists of several steps (Fig. 4). The beginning is
the biological question (Fig. 4A). In this case it is to find genes, which are involved in
somitogenesis (see 1.1). Parallel to this question and the designing of adequate
experiments (Churchill, 2002; Yang at Speed, 2002) (Fig. 4B) the microarray
technology had to be established in the laboratory, i.e. how to print the probes and in
which printing buffer (Fig.4C). Another important feature was the production of the
labelled targets. This means, which RNA extraction should be used, total RNA or
poly A
+enriched and before this, the tissue used for RNA extraction had to be chosen
(Fig. 4D). Intuitively one might suggest to use the presomitic region of the embryo, but as the zebrafish embryo is very small and a high amount of RNA is needed, we choose to use the entire embryo for RNA extraction. But in the case of the mouse microarray experiment we used parts of the PSM for RNA preparations. After this the right protocol for labelling the targets had to be established (Fig. 4E) and of course the hybridisation of the labelled targets to the printed probes as well (Fig. 4F). As mentioned above it is also very critical to design the experiments in a way that the most usage can be expected from the generated data. A keystone is the balance between technical and biological replicates (Yang and Speed, 2002). Technical replicates use the same labelled targets. Variances in these replicates stem for example from differences of the printed slides, differences during RNA isolation, labelling and so on. Biological replicates on the other hand use different samples. Here biological variance plays a role. This stems from individual differences of the fish (embryos and also parent fish), health state, water quality and so on. Another consideration should be, if the experimental design truly answers the biological question (Churchill, 2002).
Following analogon should show what is meant with this. If for example, the difference between male and female fish should be investigated, one should be certain that one does not have old and young fish in the sample because then the differences of age will also fall in the pool of differences. This elucidates why thinking of sampling is very important.
Figure 3: Flowchart of a microarray experiment: The clones, oligos or cDNAs (referred to as probes) are spotted on a coated glass surface (slide). RNAs are extracted from two different tissues. The RNA is transcribed into cDNAs and labelled with two different fluorphores (dyes). These labelled targets are hybridised to the slide. During scanning two different images, for each dye one are created and then analysed.
(Weeraratna et. al, 2004)
Scanning follows the hybridisation (Fig.4G) and gridding converts this scanned images into columns of numbers referring to the measured intensities and background values (Fig. 4H). Normalisation eliminates differences stemming from differences in dye efficiency (coupling to the cDNA, produced from the RNA) (Fig. 4I) (Yang et al., 2002; Quackenbush, 2002;Park et al., 2003). After this, statistic methods had to be chosen (Fig. 4J), which allow to differentiate between true expression differences and variable differences coming from random events. They should be easy to use and suit the special requirements of the biological question (Leung and Cavaliere, 2003). As we are interested in differently expressed genes it might seem valid to set a certain threshold of up- or downregulation for a given gene and this is it what we did in the beginning of the experiments, later, experience showed that it would be better to compare expression changes to housekeeping genes and/or genes, which were known to be differently expressed (Chaudhuri, 2005).
Figure 4: Steps in a microarray experiment.
2. Materials and Methods:
2.1. Materials:
2.1.1 Chemicals, kits and enzymes:
µMACs Kit (Miltenyi)
Fairplay labelling Kit (Stratagene) Cyscribe labelling Kit (Amersham) SYBR Green II (Molecular probes) Ethanol (Merck)
Diethyl Pyrocarbonate (DEPC) (Sigma) NaOH (Fluka)
HCl
LiCl (Sigma) Oligo dT primer
Reverse transcription buffer (Promega) Reverse transcriptase (Promega) 10x transcription buffer (Roche) dNTPs (Sigma)
NTPs (Roche)
DIG RNA labelling mix (Roche) SP6 RNA polymerase (Roche) T7 RNA polymerase (Roche) DNaseI (Roche)
Glycogen (Ambion) BM Purple (Roche) RNase Inhibitor (Roche)
Anti DIG AP Fab fragments (Roche) Na
2HPO
4*2H
2O (Merck)
Na
2SO
4*10H
2O (Merck) KH
2PO
4(Sigma)
NaCl (Merck)
MgCl
2(Sigma)
Sodiumcitrate (Sigma) KCl (Sigma)
Tween-20 (Merck) Sodium Acetate (Fluka)
Cy3 reactive dye (Amersham Pharmacia) Cy5 reactive dye (Amersham Pharmacia) Alexa 555 (Molecular Probes)
Alexa 647 (Molecular Probes) Sodium bicarbonate (Sigma) Formamide
Boehringer Block (Roche) Yeast RNA (Sigma) Heparin
3-(Cyclohexylamino)-propan-1-sulfonacid (Chaps) (Sigma) Paraformaldehyde
Triethanolamine (Sigma)
BSA (Bovine serum albumin) (Sigma) Levamisol
DMSO (Sigma) Ethidium bromide Iso-propanol (Merck) Methanol (Merck)
Taq DNA polymerase (selfmade) 10x PCR Buffer (selfmade) Taq DNA polymerase (Ampliqon) 10x PCR buffer (Ampliqon) Bruce Apple cDNA library Lambda Phage DNA (Sigma) Sigma Genosys mouse oligo library Sigma Genosys zebrafish oligo library
Control oligos: lambda genes Q, N and G (Sigma) LB Broth Base (Gibco BRL)
LB Agar (Gibco BRL)
SOLR cells (Stratagene)
Virkon
Ampicillin (Sigma) Kanamycin (Sigma) EDTA (Sigma)
PCR purification kit (Quiagen)
Rapid PCR purification and Gel extraction system (Biocat) Phenol/Chloroform (Roth)
Chloroform (Roth) Tris-base (Merck) Ultra Pure H
2O Glycerol (Roth)
2.1.2 Equipment:
Tubes 1.5 and 2ml (Eppendorf) PCR tubes (Mβb)
Incubator for fish Incubator for bacteria Bacterial shaker Incubators
12 well dishes (Nunc) pH meter
Gel chambers
Power supply (Biorad) Microscopic slides (Roth) Stereomicroscope (Zeiss) In situ machine (Intavis) Heating blocks (Eppendorf )
Mastercycler personal (Eppendorf) DNA Engine Tetrad (MJ Research) Centrifuge (Eppendorf)
Centrifuge 5810 (Eppendorf)
Pipettes (Gilson): P2, P20, P200, P1000
Pasteur-pipettes glass (KMF)
Pasteur-pipettes plastic (KMF) Forceps (Inox no. 11)
Aspiratory tube assembly for microcapillary pipettes (Sigma) glasscapillaries
Reusable columns GAPSI slides (Corning) GAPSII slides (Corning) Elipsa slides (Eppendorf) Schott H slides (Schott)
Gene Tac G3 (Genomic solution): Spotter and picker Gene Tac Hybridization (Genomic solution)
Gene Tac LS IV (Genomic solution): Laserscanner Multiprobe II Robotic liquid handling system (Packard) Hybridisation chambers (Corning)
Coverslips (Corning) Lifterslips (Eerie) Slide-rack (Roth) Glass dishes (Roth)
96 well culture plate (Nunc) 96 well plate (Brand, ABgene) 96 well filter plate (Nunc) 384 microarray plates (ABgene) airpore tape (Deelux)
PCR plate tapes (Brand)
Robotic tips (Mβb, Neptun): 20, 200, 1000µl conductive and nonconductive Spectrometer (Eppendorf)
2.1.3. Animals:
Fish (Danio rerio):
Wildtype fish were obtained from animal store “Schlepps”
Mice wildtype strain:
FVB/N (Charles River Laboratories)
2.1.4. Hormones:
Pregnant mare serum (PMS)
Human gonadotropic hormone (HGC)
2.1.5. Primers:
Table 1: Primer used
Name Accession-no Sequence Lambda control genes
Q-forward M38285
TAT TTA GGT GAC ACT ATA GGG CGC ATG AGA CTC GAA AGC GTA GCQ-reverse
(T)18 CAT GCT GCT AAC GTG TGA CCG CAT TCN-forward V00637
TAT TTA GGT GAC ACT ATA GTG GAC TGA ATT AGT TGC CAG CTA TGN-reverse
(T)18 TGG CGG TGT TGA CAG AAA TAC CACTG
G-forward X00166
TAT TTA GGT GAC ACT ATA GGA TCA GCC AAA CGT CTC TTC AGG CCG-reverse
(T)18 GGT GTT AGA TAT TTA TCC CT TGC GGTPrimer used for amplification of fragments of cDNA library
T3-forward
AAT TAA CCC TCA CTA AAG GGT7-reverse
TAA TAC GAC TCA CTA TAG GGPrimers for candidates of « Des » chip
(forward primers include T3 sequence, reverse primer include T7 sequence)
Cx43.4 forward L46801
AAT TAA CCC TCA CTA AAG GGT CGA GGA CTG AGA CGCx43.4 reverse
TAA TAC GAC TCA CTA TAG GGC GGT CAA TGT CTC GCD249 forward AB055680
AAT TAA CCC TCA CTA AAG GGA ACA AGC ACG GAG TGD249 reverse
TAA TAC GAC TCA CTA TAG GGT GTC TCA GGT GCA GCHer6 forward X97333
AAT TAA CCC TCA CTA AAG GGA ACA GAC TGT GAC ATName Accession-no Sequence
Her6 reverse
TAA TAC GAC TCA CTA TAG GGC CTC GGAGTC TAC CA
Hsp90 forward AF068772
AAT TAA CCC TCA CTA AAG GGA CCA AGA TGC CTG AAHsp90 reverse
TAA TAC GAC TCA CTA TAG GGG AAG AGC GCG GAA CTMesogenin forward
AJ309314
AAT TAA CCC TCA CTA AAG GGA GGA CAG GTC ATT TGMesogenin reverse
TAA TAC GAC TCA CTA TAG GGT GCC GGA TAA CTC TT
Mta forward AF097875
AAT TAA CCC TCA CTA AAG GGG GAC AGT GTC TAC TAMta reverse
TAA TAC GAC TCA CTA TAG GGC TCC AGC AGG AAG AAP38a forward AB030897
AAT TAA CCC TCA CTA AAG GGA GAC TAG GAG CTG CGP38a reverse
TAA TAC GAC TCA CTA TAG GGA TTC CTC TTG GGC ATPbx4 forward AF162696
AAT TAA CCC TCA CTA AAG GGG CTT GGG AAC AAA CCPbx4 reverse
TAA TAC GAC TCA CTA TAG GGC GGT TGA CCG AGC GAMMP1A forward
BI867183
AAT TAA CCC TCA CTA AAG GGG CTT GAT TCA AAA TTMMP1A reverse
TAA TAC GAC TCA CTA TAG GGG TGC GAT TCT GGG AT
ZfdIII forward BG304258
AAT TAA CCC TCA CTA AAG GGG TTA GTT CCT GTC CGZfdIII reverse
TAA TAC GAC TCA CTA TAG GGC GCA CAT TTC CCA GCZiro5 forward AY017309
AAT TAA CCC TCA CTA AAG GGA CTC AAG TGA GAA GCZiro5 reverse
TAA TAC GAC TCA CTA TAG GGG AGA ATG AAT AAC AGZiro7 forward AF398433
AAT TAA CCC TCA CTA AAG GGA AAC TTC TTC ATG GAZiro7 reverse
TAA TAC GAC TCA CTA TAG GGT CTG TTA TGC AAA CAName Accession-no Sequence
Ztsg1 forward AF332096
AAT TAA CCC TCA CTA AAG GGG ATG GGG TCT TCA TCZtsg reverse
TAA TAC GAC TCA CTA TAG GGG TCC AGCAGA AAC AC
2.1.6. Solutions:
DEPC-H
2O:
0.5ml DEPC was added to 1l H
2O. The solution was left overnight at room temperature. Later the DEPC was inactivated by autoclaving.
20 x SSC :
175.3g NaCl and 88.2g Sodiumcitrat were dissolved in 1l H
2O. The pH was adjusted to 4.7. Finally the solution was autoclaved.
20 x PBS:
160g NaCl, 6g KCl, 23g Na
2HPO
4and 4.8g KH
2PO
4were dissolved in 1l DEPC H
2O.
The pH was adjusted to 7.5 and the solution was autoclaved.
1xPBS:
20x PBS was diluted to 1x.
4% PFA:
40g paraformaldehyde powder was dissolved in 1l 1xPBS. The solution was heated until it became clear. Then it was aliquoted.
Tris-HCl:
121.1g Tris-base was dissolved in H
2O. The pH was adjusted by adding HCl.
5M NaCl:
292g NaCl was dissolved in 1l DEPC H
2O. The solution was autoclaved.
0.5M MgCl
2:
101.7g MgCl
2were dissolved in 1l DEPC H
2O. The solution was autoclaved.
50x TAE-buffer:
For 1l 242.2g Tris and 57.1g Acetanhydrid were dissolved in water. 100ml 0.5M EDTA pH 8 were added and the solution was filled up with water.
For electophoresis the buffer was diluted to 1x TAE.
Agarose-gel loading buffer:
15% Ficoll was dissolved in 45ml H
2O. One drop of Bromphenol (0.25%) and Xylene Blue (0.25%) were added. The bluejuice was aliquoted in 1.5ml Eppendorf tubes.
Sephadex G50:
10g of the sephadex were suspended in 150 ml water and autoclaved. The sephadex was stored at 4°C
Printing buffer (Schott H and Elipsa slides):
To approximately 800 ml of water 1.78g of Na
2HPO
4*2H
2O (100mM) was added. To this 10g of Na
2SO
4*10H
2O (10%) was also added. Mixing was done until the solution became clear. Then the solution was adjusted to pH 9. Finally water was added to get 1 l of 1x printing buffer.
Hybridisation and washing solutions (GAPSI and II slides):
The hybridisation solution contains 3xSSC, 0.3%SDS and 200ng/µl yeast tRNA.
Medium stringency buffer: 2xSSC and 0.1%SDS High stringency buffer: 0.1xSSC and 0.05% SDS
Hybridisation and washing solutions (Elipsa):
The Pre-hybridisation-solution was 3xSSC, 0.3%SDS, 1%BSA
The Hybridisation-solution was the same as the Pre-hybridisation-solution except for the lack of BSA (3x SSC, 0.3%SDS).
Washing solution 1: 2xSSC, 0.1 SDS Washing solution 2: 0.1xSSC, 0.1%SDS Washing solution 3: 0.1xSSC
Hybridisation and washing solutions (Schott H):
Blocking solution: 50mM Ethanolamine was dissolved in 50mM borate buffer. The
solution was adjusted to pH 9.0.
Hybridisation solution: 2xSSC, 0.1% SDS Washing solution 1: 2xSSC, 0.1% SDS Washing solution 2: 0,1xSSC, 0.1% SDS Washing solution 3: 0.1xSSC
Binding solution (PCR-product purification):
5.4 M Guanidinium-Hydrochlorid was dissolved in 20mM Tris-HCl, pH 7.5; 5mM EDTA; 50% Ethanol
1 x PBST:
20x PBS was diluted to 1x and 0.1% Tween-20 added.
2 x SSCT:
20 x SSC was diluted to 2x SSC and Tween-20 was added to a final concentration of 0.1%.
0,2 x SSCT:
20 x SSC was diluted to 0.2x SSC and Tween-20 was added to a final concentration of 0.1%.
Hybridisation-solution:
25ml Formamide, 12.5ml 20x SSC, 0.5g Boehringer Block, 500µl Heparin (10mg/ml), 500µl Denhard’s, 500µl 10% Tween-20, 500µl Chaps and 500µl 0.5M EDTA were mixed and brought to the final volume of 50ml.
0.1M Triethanolamine (TEA):
0.93g TEA was dissolved in 50ml DEPC H
2O and the pH adjusted to pH 7.8.
Blocking solution I (in situ Hybridisation):
0.1 g BSA was dissolved in 50 ml 1xPBST.
Blocking solution II (in situ Hybridisation):
20ml Blocking solution I was mixed with heat-inactivated sheep serum (5%)
Alkaline Phosphates (AP)-buffer:
5ml 1M Tris, 5ml 0.5 M MgCl
2, 1ml 5M NaCl, 500µl 10% Tween and 250µl 1M Levamisol were mixed and brought to final volume of 50ml.
TE-buffer:
10mM Tris-Cl and 1mM EDTA (pH 8)
2.2. Methods:
2.2.1: Preparation of embryos:
2.2.1.1: Fish:
Fish were mated in separate small plastic boxes filled with water. On the bottom of the box were small glass balls to prevent eating of the eggs by the adult fish. One female fish was mated to one or two male fish. Mating started in the next morning after the light-cycle began.
Two hours later the eggs were collected. The fish were grown overnight in a 22°C incubator. The fish grew to 10 somite stage. Then the fish were either used for RNA extraction (described below) or dechorionised and fixed in 4% PFA overnight at 4°C.
After fixing the fish were dehydrated in MeOH (5min in 33% MeOH in PBST, 5min in 66% MeOH in PBST and 5min in 100% MeOH). The embryos were stored in 100% MeOH at -20°C until use for in situ hybridisation.
2.2.1.2: Mice:
To increase the number of embryos, female mice were superovulated. For this purpose FVB/N mice between four to six weeks were injected with PSM at midday.
48h later HCG was injected as well. Then the mice were mated. At E9.5 the females were killed. Noon after the day the vaginal plug was observed is considered as E0.5.
The embryos were dissected out of the embryonic membranes in ice-cold PBS. Then in a first step the PSM below the umbilical chord was cut off and put into RNA later.
After this the PSM above the umbilical and below the first somitic border was
removed and put into another tube containing RNA later. The RNA of these two
samples was extracted as described below.
2.2.2 Mixed embryogenesis stage cDNA -Library:
This library was kindly provided by Bruce Appel. It was created using the Stratagene ZAP-cDNA synthesis kit using 12-20 somite stage embryos. PCRs, Purification and Rearraying were done together with Dr. Martin Gajewski, Eva Schetter and Vladimir Simovic.
Mass excision was done following the instruction of the kit. The phagmids were transformed into SOLR cells and the bacteria were streaked out on LB Agar plates (described in Stratagene instruction manual: cDNA Synthesis Kit, ZAP-cDNA Synthesis Kit, and ZAP-cDNA Gigapack III Gold Cloning Kit).
2.2.2.1: Picking of colonies:
Colonies were picked using the Gene Tac Picker tool. 96 well culture plates were filled with LB medium containing Ampicillin. The plates were loaded into the picker together with the colonies on the LB-amp agar plates. The picking device was also equipped with washing baths allowing the washing and sterilisation of the 48 pin picking head before, during and after the picking process. The picking tool was first washed in 50% EtOH and Virkon. Then the tool moved to the ultrasonic bath containing water and was washed for 5 seconds. Afterwards the tool was washed in 70% EtOH for 5 seconds. Finally the tool was sterilised with heat for five seconds. To allow cooling down of the pins the head rested for 5 seconds before the next picking step.
The automated vision system (CCD camera and frame grabber card) could detect colonies after setting the parameters: size, circularity, grey range and kernel size. It was necessary to set this parameter carefully because otherwise merged colonies or air bubbles in the agar would have been picked. The picked colonies were transferred to the 96 well culture plates. After picking the plates were sealed with air pore tape and incubated o.n. on the shacker (300rpm) at 37°C.
2.2.2.2: Automated colony PCR in 96 well format:
From one 96 culture well plate two identical 96 colony PCRs in 96 well plates were made.
The mastermix (1U Taq-polymerase, 1.5 mM Magnesium buffer, 1x Taq buffer,
200µM dNTPs, 200nM T3 forward primer, 200nM T7 reverse primer) was filled into
a container and put into the machine on a cooling socket. The empty 96 well plates were also put on cooled holds. The 96 culture well plate was loaded in the machine, too. 200µl conductive tips were used by the machine to pipette the mastermix into the 96 well plates (95µl per well). Afterwards 5µl bacterial suspension was pipetted to the mastermix. As two PCR plates were produced the total volume of bacterial suspension, which was pipetted was 10µl. To the remaining bacteria 100µl of 60%
Glycerol was added and stored at -20°C.
The PCR in the 96 well plates was done in a tetrad-thermocycler. Reaction profile:
95°C for 2minutes, 35 cycles: 95°C for 30 seconds, 55°C for 45 seconds, 72°C for 2 minutes and a final extension of 72°C for 5minutes. The PCRs were checked on a 1%
Agarose Gel.
2.2.2.3: PCR-product purification in 96 well format:
The protocol used for PCR product purification was established by Dr. Martin Gajewski and was also done with the pipetting-robot. A 96-well filter plate was mounted on a vaccum manifold. The PCR products of both produced plates were transferred together with the Binding solution into the 96-well filter plate. Then vacuum was applied. 700µl wash solution washed the bound DNA. After this again vaccum was applied, this time longer to allow the entire removal of washing solution.
With 50µl water (warmed to 60°C) in each well the DNA was eluted and collected in a fresh 96-well plate. The elution was checked on a 1% agarose gel.
2.2.2.4: Rearraying of purified PCR products:
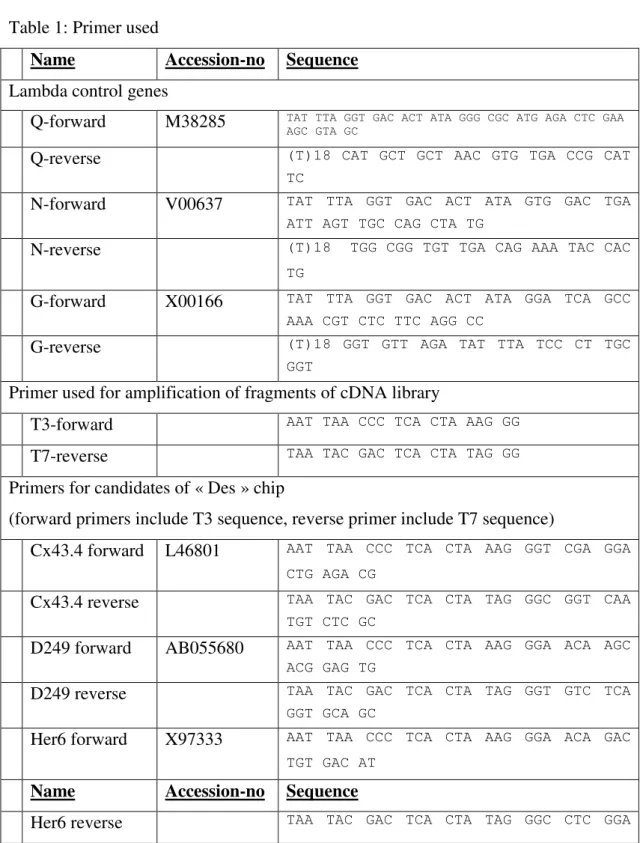
This step was done using the pipetting-robot. Four 96 well plates containing purified PCR products were rearrayed into a 384 well plate. To do this 10 µl were pipetted out of each well and transferred to the 384 plate containing 10µl DMSO (printing buffer).
The scheme of rearraying can be seen in Fig. 5.
Positions 1-96 refer to plate 1, 97-192 to plate 2, 193-288 to plate 3 and 289-384 to plate 4. Tables were created to allow an easy reference to the original 96 well plate.
2.2.3 Sigma Genosys mouse oligo library and zebrafish library:
Both libraries were delivered in 384 well format. The oligos were lyophilised and each well contained 0.5nmole. The oligos are 65-mers with a 5’-C6 amino modification, helping in covalent binding of the oligo to the slide coating substrate.
One oligo has been designed for each gene. Control oligos were present in the library
and were housekeeping genes, i.e. beta-actin. The oligos were dissolved in the
Printing buffer to a final concentration of 20µM and a daughter-plate-set was created, which was used for printing.
Mouse oligo library: This library consisted of 22 228 oligos, including 231 control oligos. Dissolvation and creating of daughter plates was done together with Chriz Voolstra.
Zebrafish oligo library: This library was made up of 16 399 oligos, including 171 controls.
Figure 5: Scheme of rearraying. Four 96 well plates were rearrayed into one 384 well plate. The PCRs of plate 1 are in postions 1-96; of plate2 in 97-192; of plate 3 in 193-288 and of plate 4 in 289-384.
2.2.4. PCR and in vitro transcription of the Lambda-Control genes for the cDNA-chip
Out of Lambda DNA three control genes were amplified, namely Q, N and Gama cI (G).
The mastermix contained 1x PCR buffer, 2.5mM MgCl
2, 5% DMSO, 200nM forward
primer, 200nM reverse primer, 1U Taq polymerase, 1µl lambda phage DNA. The
primers
had an overhang carrying the SP6 polymerase sequence.
Reaction profile: 94°C for 15 minutes, 40 circles: 94°C for 30 seconds, 55°C for 30 seconds and 72°C for 45 seconds and a final extension of 72°C for 2min.
The PCR products were purified using the Quiagen PCR purification kit. In the case of the Gene G more than one band was obtained. The product band was cut out and gel extracted using the Gel extraction kit.
For all genes one reamplification was done. This product was purified, too.
The purified product was Phenol- Chloroform extracted: One volume of Phenol/Chloroform was added and the tube was vortexted and afterwards centrifuged at maximum speed for 7 minutes. The upper phase (containing the DNA) was transferred to a new tube and mixed with one volume of Chloroform and again centrifuged. Again the upper phase was pipetted into a new tube. The DNA was precipitated by adding 1/20 volume 5M NaCl and 2.5 Volumes Ethanol at -20°C for 1 hour. After this time the tube was centrifuged at maximum speed for 20 minutes and the supernatant was discarded. The pellet was washed once with 70% Ethanol in DEPC-H
2O and afterwards dried completely. The pellet was dissolved in 20µl TE- buffer and the concentration was measured. 200-400ng were used for transcription together with 2µl 10x transcription buffer, 2µl 10mM NTPs, 1µl RNase-Inhibitorand 20U SP6 RNA Polymerase. The final volume of the reaction was 20µl. The reaction was incubated at 37°C for 3hours. To destroy the template DNA 1µl DNase was added after the transcription and incubated for 15 minutes at 37°C. After this the reaction was stopped by adding 1µl 0.2M EDTA. To get rid of the DNase the sample was again Phenol-Chloroform extracted and precipitated as described above. This time the pellet was dissolved in 20µl DEPC-H
2O. The transcription was checked on a 1.5% Agarose-gel.
2.2.5. Printing on Microarray slides:
General:
Slides, which were stored at 4°C (Elipsa) or –20°C (Schott H) were put to room temperature 15 minutes prior to printing. The 384 plates were also allowed to warm to room temperature and afterwards spun down at 240g for 3 minutes. Slides and plates were put into the spotter. An antistatic brush was used to remove dust from the slides.
The sonic bath was filled with water as well as one of the washing-station. The second
washing-station was filled with 50% Ethanol. The washing protocol was 3 seconds
washing in sonic bath, 3 seconds in water with brushing, 3 seconds washing in 50%
EtOH, 3 seconds heater and 5 seconds air-dry.
After spotting the slides were left for 10 minutes in the spotter to allow drying.
GAPSI and II: On this slide the PCR-products from the Bruce Appel cDNA were printed. As controls, Q and GFP DNA was printed on each sub-grid. As printing buffer 50% DMSO was used. To covalently attach the DNA to the chip surface the slides were incubated for 2 hours at 80°C.
Elipsa: On this type of slide the mouse oligo library was printed. Four slides were necessary to print the entire library. Three different controls were spotted on the chips.
The Q oligo was printed on each subgrid and served additionally as a landmark. The oligos N and G were just printed into each subgrid on slide2 and 4. 100mM Sodium Phosphate Buffer was used for printing. Spotting on this type of slides was done together with Chriz Voolstra. Post-processing was done as described for the GAPS- slides.
Schott H: On this slide the zebrafish oligo library was printed. Two slides were needed to print the entire library. The control Q was again in each subgrid. The controls N and G could only be seen on slide2. The same printing buffer as for Elipsa slides were used. Post-printing incubation was done in a humidity chamber (wet towels in a box) for 2 hours at room temperature. Finally the slides were dried, by leaving them overnight in a closed box.
2.2.6. SYBR green II staining:
After printing the success of the spotting process, i.e. spot morphology and spot size, could be checked. One slide of each printing run was incubated in a 10 000 fold dilution of SYBR green II stain in 0.5x TBE buffer for 3minutes. Afterwards the slides were washed four times in 0.5x TBE buffer. Finally the slides were dried by centrifugation and scanned in the Microarray Scanner at 560nm.
2.2.7. Labelling using the Fairplay-kit (Stratagene):
The RNAs (approximately 1µg per sample) in precipitation was spun down (maximum speed for 20minutes). Then the pellet was washed with 70% Ethanol and dried completely at room temperature.
cDNA synthesis:
The dried RNA was dissolved in 8.5µl DEPC-H
2O. Control RNAs were added in following amounts: To the vial containing the RNA, which was later labelled with the green fluorphor 1µl Q, 0.5µl N and 2µl G were added. To the other vial 1 µl Q, 2µl N and 0.5µl G were added.
To obtain a complete redissolvation, the RNAs were heated for 15 minutes at 37°C.
Afterwards the RNAs were cooled down on ice and spun down. 2µl 10x Stratascript reaction buffer, 1µl 20x dNTP mix, 1.5µl 0.1DTT, 0.5ul Rnase Block (40U/µl) and 1µl Stratascript reverse transcriptase (50U/µl) were added to each tube. Incubation was done at 48°. After 25minutes 1µl of Stratascript reverse transcriptase was added again and the tubes were incubated for additional 35 minutes.
10µl 1M NaOH were added to the reactions and incubated at 70°C for 10 minutes to hydrolyse the RNA. After this the reactions were slowly cooled down to room temperature. The cDNA-solutions were neutralized by adding 10µl 1M HCl. The cDNA was purified by precipitation (4µl 3M Sodium Acetate, 1µl Glycogen and 100 µl Ethanol). Precipitation was done overnight at -20°C. The reactions were spun down at maximum speed for 15 minutes. After washing the pellet with 70% Ethanol, it was dried completely.
Fluorescent Dye Coupling :
Using Amersham Pharmacia dyes :
The pellets were dissolved in 10µl 2x Coupling Buffer. 45µl DMSO was added to one Cy3 and one Cy5 reactive dye package. After vortexing the dyes were spun briefly. 10 µl of the dissolved dye were added to the cDNA sample. In darkness the tubes were incubated for 30 minutes at room temperature.
Using Alexa Dyes :
The pellets were dissolved in 5µl nuclease free H
2O and incubated at 42°C for 5 minutes. Then 3µl of labelling buffer (Sodium bicarbonate buffer) were added.
2µl of DMSO were added to each vial of Alexa Dyes (555 and 647). The 8µl of amine-modified DNA were added to the dye. In darkness the tubes were incubated for 1 hour at room temperature. Finally 10µl H
2O were added to the reaction.
Purification:
Again a precipitation step was performed (2µl 3M sodium acetate and 50µl 100%
ethanol) at -20°C for at least 30 minutes. The fluorescent DNA was spun down at
maximum speed for 15 minutes and washed with 70% Ethanol. The dried pellet was dissolved in 20µl deonized H
2O.
850µl sephadex were added to reusable columns. The column was placed into a 2ml tube and spun at 300xg for 1 minute. The flow-through was discarded and the spin column placed in a new 1.5ml tube. On the center of the column the labelled probe was added and spun for 2 minutes at 300xg.
To check for the quality of the labelled material, 2µl probe were loaded together with 2µl loading buffer on a 1% agarose gel without ethidium bromide. The gel was run for 1hour at 70 Volt. In the Microarray-scanner the labelled cDNA could be checked.
2.2.8. Labelling using the Cyscribe-labelling kit:
The RNA was handled as described in the fairplay labelling section. Control RNAs were added in the same amount as described above. 1µl of anchored oligo(dT) was added and incubated for 5 minutes at 70°C. After cooling down 4µl of 5x CyScript buffer, 2µl 0.1M DTT, 1µl dUTP nucleotide mix, 1µl dUTP CyDye-labelled nucleotide (red or green) and 1µl of reverse transcriptase were added and incubated at 42°C for 1.5 hours. After the cDNA production the RNA was degraded by adding 2µl of 2.5M NaOH to the reaction and incubating it at 37°C for 15 minutes. 2µl of 2.5M HCl neutralised the cDNA solution.
The labelled cDNAs were purified in the G-50 Sephadex Spin Columns as described above.
2.2.9. Hybridisation on microarray slides:
GAPSI and GAPSII slides:
To 100µl of hybridisation solution 10µl of labelled cDNA was added (5µl green and 5µl red labelled cDNA). The cDNA-mixture was denatured at 85°C for 3minutes and then at 65°C for 20 minutes.
The hybridisation was done in the GeneTAC Hybridisation-station and the slides were
mounted according to the instructions.
The hybridisation program consisted of following steps:
The probe was introduced at 75°C. Then a step-down hybridisation was performed;
3hours at 65°C, 3 hours at 55°C and 12 hours at 50°. Afterwards the slides were washed in the machine: medium stringency buffer 6 times at 50°C for 20 seconds.
High stringency buffer 3 times at 25°C for 20 seconds and post wash buffer 3times at 25°C for 20 seconds.
The slides were dried by centrifugation at 235xg for 5minutes.
Elipsa slides:
The prehybridisation solution was heated to 42°C and the arrays incubated in it for 45 minutes, keeping the temperature at 42°C. Afterwards the slides were rinsed in water at room temperature. The slides were shortly dipped in iso-propanol and finally dried by centrifugation at 235g for 2 min.
The hybridisation was done in hybridisation chambers. Into the tiny holes 3xSSC was pipetted to allow a humid environment in the chambers during hybridisation. To the labelled and combined cDNAs hybridisation-solution was pipetted (For four slides 265µl). The cDNAs were denatured by heating the solution for 10 minutes at 80°C.
The cDNA-hybridsation-solution was pipetted on the slides and a coverslip was placed onto the slide. The slide was put into the chamber and the chamber was submerged into a waterbath at 42°C. Hybridisation was done overnight (at least 16 hours).
After hybridisation the slides were washed using the glass-rack and the glass- chambers. The first washing step was done at 42°C with washing solution 1 and was done to remove the coverslips. Afterwards the slide were put into another washing bath also containing washing solution 1 at 42°C and incubated for 5minutes. Then the slides were washed five times in washing solution 2 for 5 minutes at room temperature. Finally the slides were rinsed five times in washing solution 3 and dried by centrifugation at 235xg for 5minutes.
Schott H slides:
Prior to hybridisation the slides were incubated in the blocking solution for 1 hour at
room temperature. Afterwards the slides were washed two times with water and then
dried by centrifugation at 240xg for 6minutes. The cDNAs were combined with the
hybridisation solution (65µl per slide were needed. Therefore 5µl of each labelled
cDNA was mixed with 55µl of hybridsation solution). The cDNA in hybridisation solution was denatured at 80°C for 10 minutes and then kept at 42°C until pipetting on the slide. A coverslip and later a lifter slip were placed onto the slide. Then the slide was put into a Corning chamber (Preparation of Corning chambers see Elipsa slides) and the chamber was submerged into a waterbath at 42°C. Hybridisation was done overnight (at least 16 hours). The slides were put shortly into washing solution 1 to remove the cover- or lifterslips. Then the slides were incubated for 5 minutes in washing solution 1 at room temperature. Afterwards the slides were incubated for 5 minutes in washing solution 2. Finally the slides were rinsed five times in washing solution 3 and the slides dried by centrifugation at 240xg for 6minutes.
2.2.10. Scanning of microarray slides:
The micorarray slides were scanned using the Genetac Scanner following the instruction manual. The green fluorphor was scanned at 560 nm and the red one at 647nm.
2.2.11. Preparation of DIG labelled Antisense probes:
The template DNA was created by PCR using genespecific primers with an T7 sequence overhang. The PCR was purified. 100ng of the purified DNA was used as template. 2µl DIG RNA labelling mix, 2µl 10 transcription buffer, 2µl T7 RNA polymerase and 1µl of RNase Inhibitor was added to the template. The transcription reaction volume was 20µl. The reaction was incubated for 2hours at 37° C. After this the template DNA was destroyed by adding 2µl DNaseI and incubation at 37°C.
Purification was done by precipitation using 1/10 LiCl, 2.5Volumes 100% Ethanol
and 1µl Glycogen. The precipitation was done at -20°C over night. The RNA was spun down at maximum speed for 20 minutes and washed once with 75% Ethanol in DEPC-H
2O. The dried pellet was dissolved in 20µl DEPC-H
2O. To prevent degradation of the DIG labelled RNA 20µl of Formamide was added and the RNA was stored at -20°C.
2.2.12. in situ Hybridisation:
2.2.12.1. Rehydration of embryos:
The dehydrated embryos were rehydrated by incubating them for 5minutes in 66%
Methanol in PBST, 5minutes in 33% Methanol in PBST and washing them 3 times in PBST.
2.2.12.2. Heat-treatment of zebrafish embryos
The embryos in 1ml PBST were put in nearly boiling water for 10 minutes. The embryos were whirled up every two minutes to avoid sticking together of the embryos. After this the embryos were put for 5minutes on ice. Again the embryos were whirled up every minute. Finally the embryos were washed once with PBST.
2.2.12.3. in situ Hybridisation using the hybridization machine:
After heat-treatment the embryos were put together with the solutions in the machine.
Following steps were done by the machine:
2 times incubation in PBST
10 minutes incubation in 0.1M Triethanolamine and Acetanhydrid Four times washing with PBST for 5minutes
Incubation in 50% hybridisation solution in PBST at 65°C Prehybridisation in hybridisation solution at 65°C for 1 hour
The hybridisation buffer was replaced by hybridisation solution containing DIG labelled probe (2-4µl labelled probe in 1ml hybridisation solution). Incubation was for 18hours at 65°C.
After hybridisation the embryos were washed in hybridisation solution for 30 minutes at 65°C and twice in 50% hybridisation solution in 2x SSCT at 65°C. Two washing steps in 0.2xSSCT at 65°C followed.
Before antibody incubation the embryos were washed four times with PBST at RT.
Blocking was done for 20 minutes in blocking solution I and for 60 minutes in blocking solution II at room temperature. The antibody (Anti-Dig alkaline phosphates linked) was diluted 1:2000 in blocking solution II and pipetted on the the embryos and incubated for 4 hours.
Finally the embryos were washed 4 times in PBST and then incubated two times in AP-buffer.
2.2.12.4. Staining reaction with BM-Purple:
The embryos were removed from the machine at put into a 12 well plate. 400µl of BM-purple (staining substate) was added and the staining reaction was done in the dark.
To stop the staining reaction the embryos were washed 2 times in PBST.
2.2.12.5. Photographing of stained embryos:
Either the embryos were photographed as whole mounts under a stereomicroscope or the embryos were flat-mounted on a microscopic slide and the picture was taken under a microscope. For flat-mounting the yolk of the embryo was removed using acupuncture needles. The flattened embryo was covered with a cover-slip.
2.2.13. DNA- Sequencing with the ABI- Sequencer:
1 to 50 ng of PCR product was mixed with 2µl terminator ready reaction mix (Big Dye) and 2µl of sequencing primer. Water was added to a final concentration of 10µl.
Sequencing programm: 1 minutes at 96°C, 30 times: 10 seconds 96°C, 15 seconds at the annealing temperature of the primer, 4 minutes at 60°C. Afterwards to the reaction 10µl water was added. Purification and loading of the sequencer was done by the sequencing facility personal.
The sequenced fragments were checked with Vector NTI and blasted against the NCBI database.
2.2.14. mRNA Isolation using the µMACs-Kit:
Danio rerio embryos at 10 somite stage were collected as described above.
Approximately 100 animals were used per isolation. The embryos were transferred
into an eppendorf tube and the water was removed using a glass Pasteur pipette.
Lysisbuffer (1ml) was pipetted into the tube. With a small plastic pistil the
dechorionated embryos were homogenized and vortexed for 3 minutes to lyse them
completely. A centrifugation step at 4000g for 3 minutes reduced the foam produced
during vortexing. The lysate was transferred into a column attached to a tube. The
lysate was run through the column by centrifugation at 13 000g for 3 minutes to
reduce viscosity. 50µl microbeads were added to the lysate. Then this mixture was
transferred onto a column fixed in the magnetic field. Before this the column was
equilibrated with 100µl Lysis buffer.
The lysate run through the column by gravity. Afterwards the column was washed twice with 200µl lysis-buffer and four times with 100µl washing buffer. These washing steps removed proteins, RNA and DNA.
120µl Elution buffer (nuclease free H
2O) eluted the enriched mRNA from the column.
The first drop of the eluate was discarded and the rest was collected.
The concentration of the RNA was obtained by measuring the absorbance. Finally the RNA was put into precipitation by adding 1µl Glycogen, 10µl 4M LiCL and 250µl 100% EtOH.
2.2.15. 1
stsynthesis:
1µg precipitated mRNA (obtained with the µMACs Kit) was centrifuged at 14 000 rpm for 20 minutes. The pellet was washed with 70% EtOH in DEPC- H
2O and centrifuged again for 7minutes. After the pellet was dried completely the RNA was redissolved in 11µl DEPC-H
20. To help the redissolvation the tube was incubated at 37° C for 10 minutes. After this 1µg of oligo dT-primer was added and incubated at 70°C for 5 minutes. Then the tube was put on ice and after cooling down, the contents of the tube were spun down. 5µl Transcription buffer, 2.5µl 25mM dNTPs, 2.5µl DEPC-H
2O, 1µl RNase Inhibitor and 1µl Reverse Transcriptase were added and incubated for one hour at 48°C. The enzymes were inactivated by incubating the reaction for 10 minutes at 70°.
3. Results:
3.1.: General remarks on the different approaches:
Several approaches were used to find novel genes involved in somitogenesis. The first one, using a cDNA library was also used to establish the technology in the lab.
Several protocols were tried out until the ones described here where chosen and
established (3.2).
The PSM consists of several different compartments and it seemed promising to investigate in the differences between them. The PSM of the zebrafish is very small and therefore the dissection in an anterior and posterior part was easier in the mouse system. This decision was also facilitated by the fact that the mouse oligo library (Sigma-Genosys) was at this time-point available in the lab (3.3).
Finally genes, which are dependent on the Delta-Notch pathway, were detected using the zebrafish oligo libray (Sigma-Genosys) (3.4).
3.2.: Establishment of microarray-technology:
3.2.1: Printing:
Three 96 well PCR plates were used for establishing the printing protocol. The DNA was mixed with 50% DMSO. This buffer was chosen because it denatures the double stranded DNA and therefore no heating step was needed prior to spotting.
Additionally it reduces evaporation. One drawback of DMSO is that the spots tend to spread, but as not too many plates were used it was possible to print in the necessary distance to avoid merging of spots (Diehl et al, 2001).
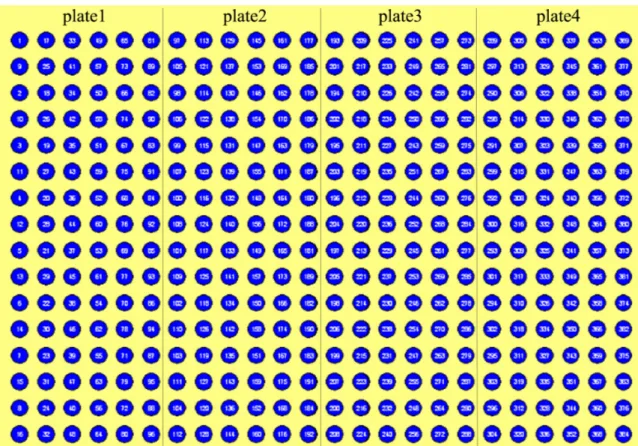
Corning GAPSII slides were used for the first printing runs. As the spotting morphology was good, this slide type was used for further experiments (Fig. 6), although other slide-types were tested as well, for example Arraylink (Genescan).
Fig 6: SYBR green staining of one of the printing runs. Most of the spots show a round, even surface