Information flow and optimization in transcriptional regulation
Gasˇper Tkaˇcik†‡, Curtis G. Callan, Jr.‡§, and William Bialek§
†Joseph Henry Laboratories of Physics, Lewis–Sigler Institute for Integrative Genomics, and§Princeton Center for Theoretical Physics, Joseph Henry Laboratories of Physics, Lewis–Sigler Institute for Integrative Genomics, Princeton University, Princeton, NJ 08544
Contributed by Curtis G. Callan, Jr., June 24, 2008 (sent for review April 3, 2008) In the simplest view of transcriptional regulation, the expression of a gene is turned on or off by changes in the concentration of a transcription factor (TF). We use recent data on noise levels in gene expression to show that it should be possible to transmit much more than just one regulatory bit. Realizing this optimal information capacity would require that the dynamic range of TF concentrations used by the cell, the input/output relation of the regulatory module, and the noise in gene expression satisfy certain matching relations, which we derive. These results provide parameter-free, quantitative predictions connecting indepen- dently measurable quantities. Although we have considered only the simplified problem of a single gene responding to a single TF, we find that these predictions are in surprisingly good agreement with recent experiments on the Bicoid/Hunchback system in the earlyDrosophilaembryo and that this system achieves!90% of its theoretical maximum information transmission.
gene regulatory networks!information theory
C
ells control the expression of genes in part through tran- scription factors (TFs), proteins which bind to particular sites along the genome and thereby enhance or inhibit the transcription of nearby genes. We can think of this control process as an input/output device in which the input is the concentration of TF and the output is the concentration of the gene product. Although this qualitative picture has been with usfor !40 years (1), only recently have there been quantitative
measurements ofin vivoinput/output relations and of the noise in output level when the input is fixed (2–11). Because these input/output relations have a limited dynamic range, noise limits the ‘‘power’’ of the cell to control gene expression levels. In this article, we quantify these limits and derive the strategies that cells could use to take maximum advantage of the available regula- tory power.
To make precise our intuition about regulatory power, we need to quantify the number of reliably distinguishable regula- tory settings of the transcription apparatus, a task to which Shannon’s mutual information (12, 13) is ideally suited. Al- though there are many ways to associate a scalar measure of correlation or control with a joint distribution of input and output signals, Shannon proved that mutual information is the only such quantity that satisfies certain plausible general re- quirements, independent of the details of the underlying distri- butions. We can then show that maximizing the mutual infor- mation between the input and output of a regulatory element—in effect, maximizing the control that the cell can exert over the expression level of a gene—requires a quantitative matching among the input/output relation, the noise level, and the distribution of TF concentrations used during the life of the cell. If the regulation of gene expression has been optimized, these matching conditions provide parameter-free predictions that connect several independently measurable quantities.
The general problem of optimizing information flow in reg- ulatory networks is difficult. We begin here with the simplest case, where a single TF controls the expression of a single target gene; see also refs 14 and 15. In this case, our optimization
problem is very similar to that discussed by Laughlin (16), who considered the optimization of information transmission from light intensity to intracellular voltage in the fly retina. More generally, ideas from information theory, including optimization and matching, have been productive in analyzing many aspects of neural coding (17–20), and it is attractive to think that similar theoretical principles could apply to the regulation of gene expression.
Although we have treated only the simplest version of the general problem, we try to compare our theoretical results with experiment. Recent work has characterized the input/output relations and noise in the transformation between the Biocoid and Hunchback morphogens in the earlyDrosophilaembryo (11, 21). We suggest that, quite generally, the regulation of gene expression in the developing embryo provides an interesting testing ground for our ideas, because the information that is transmitted in this case is precisely the ‘‘positional information’’
(22) that drives the formation of spatial patterns. Using the measured input/output relations and noise in the Bicoid/
Hunchback system, our theoretical matching relations provide a parameter-free prediction for the distribution of Hunchback expression levels that we expect to see across the embryo, and the observed distributions have a nontrivial structure that is in good agreement with theory. We also reanalyze measurements of the nucleus-by-nucleus relationship between Bicoid and Hunchback levels (11) to show that the mutual information between these two variables is!90% of the theoretical maximum. Although there are many caveats, we view these results as strong support for the idea that, in this system at least, genetic regulatory mechanisms provide for optimal information flow.
Setting up the Problem
Gene expression levels (g) change in response to changes in the concentrations of the relevant TFs (ci). In general, the gene regulatory network is a noisy dynamical system, where TFs can regulate other genes (including other TFs) or they can auto- regulate themselves, and this makes both theoretical attempts and experimental approaches to understanding the network of regulatory interactions difficult. Some progress can be achieved, however, by selecting biological systems where one gene re- sponds mainly to a single primary determinant, a TF present at concentrationc, and by focusing on the steady-state response of the gene of interest to its input. Although this may seem a drastic approximation, it is also the framework within which most of the recent measurements of noise in gene expression have been performed (2–11).
The changes in the regulated gene often are summarized by an input/output relationg!(c) in which the mean expression level is plotted as a function of TF concentration (Fig. 1). This average
Author contributions: G.T., C.G.C., and W.B. designed research, performed research, and wrote the paper.
The authors declare no conflict of interest.
‡To whom correspondence may be addressed. E-mail: gtkacik@sas.upenn.edu or ccallan@princeton.edu.
© 2008 by The National Academy of Sciences of the USA
BIOPHYSICS
relationship is a smooth function, but, because of noise, this does not mean that arbitrarily small changes in input TF concentra- tion are meaningful for the cell. The noise in expression levels could even be so large that reliable distinctions can only be made between (for example) ‘‘gene on’’ at high TF concentration and
‘‘gene off’’ at low TF concentration. To complete our description of the system we thus also need a characterization of the noise.
Most generally, describing the noise means specifying the dis- tribution of expression levels that can occur at a fixed TF concentrationP(gc).
Intuitively, the statement that a gene is regulated by a TF must mean that knowing the concentrationc of the TF will tell us something about the gene’s expression levelgand vice versa. To make this intuition precise, we introduce the mutual informa- tion,I(c; g), between TF concentration and expression level, which counts the (logarithm of the) number of distinguishable expression levels achieved by varying c. If we measure the information in bits (13), then
I"c;g#!
#
dc PTF"c##
dg P"g!c#log2$
PP"g!exp"g#c#%
, [1]wherePTF(c) is the distribution of TF concentrations the regu- latory element is exposed to andPexp(g) is the distribution of expression levels that results from convolving the distribution of TFs with the stochastic input/output relation:
Pexp"g#!
#
dc P"g!c#PTF"c#. [2]One way to think about PTF(c) is as the distribution that one would recover if it were possible to collect and histogram the measurements of the concentrationcat regular intervals in time while a cell lives undisturbed in its natural habitat, i.e., the distribution of inputs that a wild-type cell generates in the course of its life. Alternatively, one could imagine an ensemble of genetically identical cells or nuclei, each of which is exposed and is responding to a different level of input, c, drawn from a distributionPTF(c), which is generated as a result of some natural process, as in the case of morphogen gradients discussed below.
Although conceptually straightforward, such experimental esti- mates ofPTF(c) are in practice not so simple. As an example, although much is known about thelacoperon, we don’t know the distributions of lactose andlacrepressor concentrations expe- rienced byEscherichia coliin its natural environment.
The distribution, P(gc), of expression levels at fixed TF concentration summarizes the physics of the regulatory element itself, from the protein/DNA interaction, to the rates of protein synthesis and degradation; this distribution describes both the mean input/output relation and the noise fluctuations around the mean output. The information transmission, or regulatory power, of the system is not determined byP(gc) alone, however, but also depends on the distribution,PTF(c), of TF ‘‘inputs’’ that the cell uses, as can be seen from Eq.1. If this distribution and the properties of the regulatory element are matched to each other, the regulatory power of the cell will be maximized.
Matching the distribution of inputs to the (stochastic) input/
output relation of the system is a central concept in information theory (13) and has been applied to the problems of coding in the nervous system. For sensory systems, the distribution of inputs is determined by the natural environment, and the neural circuitry can adapt, learn, or evolve (on different time scales) to adjust its input/output relation. It has been suggested that maximizing information transmission is a principle that can predict the form of this adaptation (16–19, 23). In transcriptional regulation, by contrast, both the distribution of TF inputs and the input/output relation are internal to the cell, and either one is conceivably subject to adjustment on physiological or evolution- ary time scales. Computationally, however, it seems appropriate to think of the input/output relation as given (by experiment) and to ask how the distribution of TF inputs (often unmeasured) might be adjusted to find the maximal regulatory power, or information capacity, of the genetic regulatory element. We emphasize that although such a maximum might or might not be realized by the cell, it can never be exceeded.
Solving the Optimization Problem
It is difficult to make analytic progress in the general calculation of mutual information, but there are some limiting cases where one can make progress and gain intuition. Here, we describe a small noise approximation, and in the following section, we consider the opposite limit of large noise. For the general case, we have numerical methods which, as one would hope, give results that join smoothly onto the low- and high-noise limits.
The expression level at a fixed TF concentrationchas a mean valueg!(c), which we can plot as an input/output relation (Fig. 1).
Let us assume that the fluctuations around this mean are Gaussian, with a variance"g2(c), which itself depends on the TF concentration. Formally this means that
P"g!c#! 1
&
2#"g2"c#exp'
$%g2"$g2g!""c#c#&2(
. [3]Let us assume further that the noise level is small. Then we can expand all of the relevant integrals from Eq.1as a power series in the magnitude of"g:
I"c;g#!$
#
dg!Pˆexp"g!#log2Pˆexp"g!#$1
2
#
dg! Pˆexp"g!#log2%2#e"g2"g!#&%. . . , [4]where . . . are terms that vanish as the noise level decreases and Pˆexp(g!) is the probability distribution for the average levels of
log(c/Kd)
g
−5 −2.5 0 2.5 5 1
0.5
−5 −2.5 0 2.5 5 0 0
0.1 0.2 0.3
log(c/Kd) PTF
0 0.5 1 1.2
10−2 10−1 100
g Pexp
Input Output
ACTTCT
mRN A RNAP
PTF(c) P(g|c) Pexp(g)
PTF(c) P(g|c) Pexp(g))
Transcription factor Gene expression
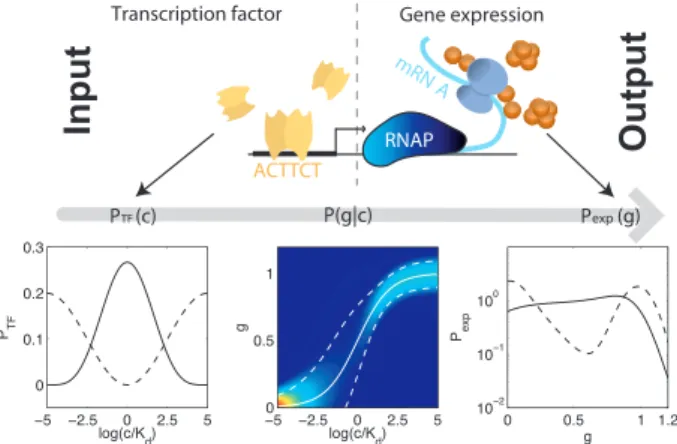
Fig. 1. Transcriptional regulation of gene expression. The occupancy of the binding site by TFs sets the activity of the promoter and hence the amount of protein produced. The physics of TF–DNA interaction, transcription, and trans- lation processes determines the conditional distribution of expression levelsg at fixed TF concentrationc,P(gc), shown here as a heat map with red (blue) corresponding to high (low) probability. The mean input/output relation is shown as a thick white line, and the dashed lines indicate'1 SD of the noise around this mean. Two sample input distributionsPTF(c) (Lower Left) are passed throughP(gc) to yield two corresponding distributions of outputs, Pexp(g) (Lower Right).
expression (15). We can think of this as the distribution that the cell would generate in the absence of noise:
Pˆexp"g!#)
#
dc PTF"c#&%g!$g!"c#& [5]!PTF"c!c*"g!##
*
dgdc!*
c(c*"g!#
$1
, [6]
wherec*(g!) is the TF concentration at which the mean expression level isg!; similarly, by"g(g!) we mean"g(c) evaluated atc(c*(g!).
We now ask how the organism can choose a distribution of TF concentrations,PTF(c), to maximize the information transmis- sion I(c; g). Eq. 4 shows us that, in the low-noise limit, the information is most easily written in terms of the distribution of average expression levels,Pˆexp(g!), whereas Eq.6shows us that this distribution is a simple (and invertible) transformation of the input distributionPTF(c). Thus, although we are really interested in adjusting the distributionPTF(c), we can equally well optimize the information by adjustingPˆexp(g!) itself, and this variational problem has a simple solution:
Pˆ*exp"g!#! 1 Z! 1
"g"g!# [7]
Z!
#
dg!"g1"g!#. [8]This result captures the intuition that effective regulation requires preferential use of signals that have high reliability or low variance—Pˆexp! (g!) is large where "g is small. The actual information transmitted for this optimal distribution can be found by substitutingPˆexp! (g!) into Eq.4, with the resultIopt(c;
g)(log2(Z/)2#e).
Although we initially formulated our problem as one of optimizing the distribution of inputs, the low-noise approxima- tion yields a result, Eq.7, that connects the optimal distribution of output expression levels to the variances of the same quan- tities, sampled across the life of a cell as it responds to natural variations in its environment. To the extent that the small noise approximation is applicable, data on the variance vs. mean expression thus suffice to calculate the maximum information capacity; fortuitously, variance in a gene product as the function of its mean expression level is exactly the quantity of interest in most of the transcriptional noise experiments. Note also that details of the input/output relation, such as its degree of coop- erativity, do not matter except insofar as they leave their signature on the noise, and that, furthermore, we do not need to know which microscopic noise sources contribute to what extent to the total observed noise.
Recent experiments provide the data for an application of these ideas. Elowitz and coworkers have measured gene expres- sion noise in a synthetic system, placing fluorescent proteins under the control of a lac-repressible promoter inE. coli(2).
Varying the concentration of an inducer, they determined the intrinsic variance of expression levels across a bacterial popula- tion as a function of mean expression level. Their results can be summarized as"g2(g!)(ag!*bg!2, where the expression levelg!is normalized to have a maximum mean value of 1, and the constants area(5$7+10$4andb(3$10+10$3. Across most of the dynamic range (g!,,0.03), the small noise approx- imation should be valid and, as discussed above, knowledge of
"g(g!) alone suffices to compute the optimal information trans-
mission. We findIopt(c;g)!3.5 bits: Rather than being limited to on/off switching, these transcriptional control systems could in principle specify 2Iopt!10$12 distinguishable levels of gene
expression. It is not clear whether this capacity, measured in an engineered system, is available to or used byE. coliin its natural environment. The calculation does demonstrate, however, that optimal information transmission values derived from real data are more than 1 bit, but perhaps small enough to provide significant constraints on regulatory function.
When the noise is not small, no simple analytic approaches are available. On the other hand, so long as P(gc) is known explicitly, our problem is equivalent to one well studied in communication theory, and efficient numerical algorithms are available for finding the input distributionPTF(c) that optimizes the informationI(c;g) defined in Eq.1(15, 24). In general, we must extractP(gc) from the experiment and, to deal with finite data, we will assume that it has the Gaussian form of Eq. 3.
P(gc) then is completely determined by measuring just two functions ofc: the mean input/output relationg!(c) and the output variance "g2(c). The central point is that, in the general case where noise is not necessarily small, solving the information optimization problem still requires only empirical data on the input/output relation and the noise—regardless of whether the underlying regulatory apparatus is a simple prokaryotic pro- moter or a metazoan enhancer, we can treat it as a ‘‘black box’’
that hides the complicated physics and biology of transcriptional control.
An Example from Embryonic Development
Motivation.The initial events of pattern formation in the embryo of the fruit flyDrosophilaprovide a promising testing ground for the optimization principle proposed here. These events depend on the establishment of spatial gradients in the concentration of various morphogen molecules, most of which are TFs (22, 25).
To be specific, consider the response of thehunchback(Hb) gene to the maternally established gradient of the TF Bicoid (Bcd) (26–29). A recent experiment reports the Bcd and Hb concen- trations in thousands of individual nuclei of the Drosophila embryo, using fluorescent antibody staining (11). Nuclei stained for Bcd and Hb were imaged during early nuclear cycle 14, before large-scale spatial rearrangement due to gastrulation, but within the time window during which the nuclear Bcd stably and reproducibly (from cycle to cycle) reaches its peak values (21).
These nuclei constitute our ensemble of genetically identical regulatory elements, exposed to spatially varying levels of Bcd, which we imagine as being drawn from the concentration distributionPTF(c). We assume that, during this period, Hb is produced in response to Bcd and degraded, yielding a steady- state response distribution,P(gc), introduced in Eq.1. These considerations, then, make the connections between our infor- mation theoretic computations with the experiment explicit.
There are additional factors that make this experiment especially appealing for our analysis: First, both Bicoid (input TF) and Hunchback (output) concentrations were measured simultaneously in vivo; second, along its anterior–posterior axis, the embryo establishes a natural graded variation in Bicoid concentration spanning the full physiological range, to which Hunchback re- sponds, quite unlike thelaccase, where the response was induced externally by IPTG; third, perpendicular to the anterior–posterior axis, one can find many nuclei that are exposed to the same level of input Bcd but generate slightly different Hb responses, providing us with a direct estimate of the noise in gene expression; fourth, the focus of the experiment was to explore how fluctuations in gene expression can affect spatial patterning and, as a consequence, care was taken to try to reduce or at least estimate fairly the systematic sources of noise.
For the purposes of our discussion, the results of experiments by Gregor et al.(11) can be summarized by the mean input/
output relation and noise level shown in Fig. 2. These data can be understood in some detail on the basis of a simple physical model (30), but here, we use the experimental observations
BIOPHYSICS
directly to make phenomenological predictions about maximum available regulatory power and optimal distribution of expres- sion levels. Caveats in the connection of theory with experiment are collected at the end of this section. We emphasize at the outset, however, that our goals are rather different from current discussions of models of spatial patterning; rather than trying to trace the pattern of expression levels down to specific molecular mechanisms, we are trying to see whether we can predict at least some features of these patterns by assuming that they reflect optimal solutions to the problem facing the organism.
Maximum Information Transmission.Given the measurements of the mean input/output relationg!(c) and noise"g(c) shown in Fig.
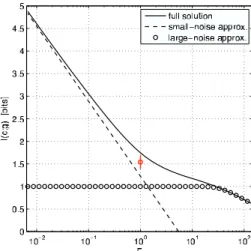
2, we can calculate the maximum mutual information between Bcd and Hb concentrations by following the steps outlined above; we findIopt(c;g)(1.7 bits. To place this result in context, we imagine a system that has the same mean input/output relation, but the noise variance is scaled by a factorF, and ask how the optimal information transmission depends onF. This is not just a mathematical trick: For most physical sources of noise, the relative variance is inversely proportional to the number of signaling molecules, and so scaling the expression noise variance down by a factor of 10 is equivalent to assuming that all relevant molecules are present in 10 times as many copies. We see in Fig.
3 that there is a large regime in which the regulatory power is well approximated by the small noise approximation. In the opposite extreme, at large noise levels, we expect that there are (at best) only two distinguishable states of high and low expression, so that our problem approaches the asymmetric binary channel (31).
The exact result interpolates smoothly between these two lim- iting cases with the real system (F(1) lying closer to the small noise limit, but deviating from it significantly. In particular, it is interesting to note that in this regime, increasing the capacity from the optimum achievable atF(1 by 1 bit would require a substantial increase (of 6-fold), in the number of available signaling molecules, whereas doubling it would require !20 times as many molecules.
In the embryo, maximizing information flow from TF to target gene has a very special meaning. Cells acquire ‘‘positional
information,’’ and thus can take actions that are appropriate to their position in the embryo by responding to the local concen- tration of morphogen molecules (22). In the original discussions,
‘‘information’’ was used colloquially. But in the simplest picture ofDrosophiladevelopment (25, 32), information in the technical sense really does flow from physical position along the anterior–
posterior axis to the concentration of the primary maternal gradients (such as Bcd) to the expression level of the gap genes (such as Hb). Maximizing the mutual information between Bcd and Hb thus maximizes the positional information that can be carried by the Hb expression level.
More generally, rather than thinking of each gap gene as having its own spatial profile, we can think of the expression levels of all of the gap genes together as a code for the position of each cell. In the same way that the 4 bases (2 bits) of DNA must code in triplets to represent arbitrary sequences of 20 aa, we can ask how many gap genes would be required to encode a unique position in the Nrows! 100 rows of nuclei along the anterior–posterior axis. If the regulation of Hb by Bcd is typical of what happens at this level of the developmental cascade, then each letter of the code is limited to less than two bits (Iopt(1.7 bits) of precision; because log2(Nrows)/Iopt(3.9, the code would need to have at least four letters. It is interesting to note that there are four known gap genes—hunchback,kru¨ppel,giant, and knirps(32)—which provide the initial readout of the maternal anterior–posterior gradients.
We emphasize that in comparing the information capacity of the Bcd/Hb system with the overall information needed for anterior–posterior fate determination, we are making a sugges- tion rather than drawing a conclusion. Although we tend to think of each row of cells as adopting a unique and largely determin- istic fate, which we can identify from the expression levels of pair rule and other later genes in the developmental cascade (see, for example, ref. 33), it is not known whether the gap genes convey enough information to specify this fate, or whether other inputs are essential. Our calculation does indicate, however, that the limits to information transmission in transcriptional regulation are significant on the scale of the information needed for embryonic development, suggesting that the optimization of information transmission is of direct biological relevance.
Thus far, we have emphasized the theoretical maximum
A B
Fig. 2. The Bcd/Hb input/output relationship in theDrosophila melano- gastersyncytium at early nuclear cycle 14 (see ref.11). (A) Each point marks the Hb (g) and Bcd (c) concentration in a single nucleus, as inferred from immu- nofluorescent staining; data are from!11+103individual nuclei across nine embryos. Hb expression levelsgare normalized so that the maximum and minimum mean expression levels are 1 and 0 respectively; small errors in the estimate of background fluorescence result in some apparent expression values being slightly negative. Bcd concentrationscare normalized byKd, the concentration of Bcd at which the mean Hb expression level is half-maximal.
For details of normalization across embryos, see ref. 11. Solid red line isg!(c)( cn/(cn*Kdn), withn(5, and error bars are'1 SEM. (B) Standard deviation of the noise in Hb expression level as a function of Bcd concentration; error bars are'1 SD across embryos. The curve is a fit to"g2(g!(c))('g!*(g!1.8(1$g!)2.2
*&, with'!2.5+10$3,(!0.5, and&!4+10$4. This functional form has
a microscopic motivation discussed in ref. 30, but note that any smooth phenomenological fit to the data would suffice.
Fig. 3. Optimal information transmission for the Bcd/Hb system as a function of the noise variance rescaling factorF. The factor by which the number of input and output signaling molecules has to be increased for the correspond- ing gain in capacity is!1/F. Dashed and dotted curves show the solutions in the small-noise and large-noise approximations, respectively. The real system,F( 1, lies in an intermediate region where neither the small- nor the large-noise approximation is valid. Measured informationIdata(c;g) shown in red (error bar is SD over nine embryos).
information transmission, given the measured noise levels. But does the embryo actually reach this optimum? The experiments of ref. 11 can be thought of as sampling the joint distribution of Bicoid and Hunchback concentrations in the (many) nuclei of the embryo, P(c, g). From such samples, we can estimate the distribution itself and, hence, the actual mutual information between the Bicoid and Hunchback levels; because it is possible to obtain,103samples from a single embryo, the often chal- lenging problems of finite sample size can be brought under control by following the strategies described in refs. 34 and 35.
We findIdata(c;g) ( 1.5' 0.15 bit, where the error bar is a standard deviation across nine embryos. This represents!90%
(0.88'0.09) of the theoretical maximum.
One might worry that !90% of the maximum information transmission is easy to achieve; after all, the input/output relation is nearly switch-like, and many different inputs thus are mapped to nearly identical outputs. In fact, were we interested in transmitting just 1 bit, this intuition would be correct, and almost any randomly chosen distribution of inputs would be sufficient.
However, a detailed analysis (15) shows that transmission of,1 bit is quite difficult, and requires something close to the optimal matching discussed here. Quantitatively, we find that if we perturb about an optimum distribution and select perturbed distributions that are readily distinguishable from the optimum (technically, the Jensen–Shannon divergence between the two approaches 1 bit), the information capacity of the perturbed distributions rarely exceeds 1 bit, even if the optimal distribution has a capacity of as many as 3 bits. Thus, the fact that the data of ref. 11 demonstrate transmission of 1.5'0.15 bits, which is
!90% of the optimum, means that the embryo must generate distributions of expression levels whose detailed structure is close to the predicted optimum. We will now test this prediction directly.
The Distribution of Expression Levels. In Drosophila embryos, Hunchback in each nucleus is responding to its local Bicoid concentration, set during the natural process of morphogen gradient establishment. If we picture this as a process where a single nucleus with its Bcd/Hb regulatory element probes dif- ferent Bcd concentrations along the anterior–posterior axis, we can pose several deeper questions. Instead of plotting Hunch- back expression levels vs. either position or Bcd concentration as is customary, we can ask about the distribution of expression levels seen across all nuclei, Pexp(g), as shown in Fig. 4. The distribution is bimodal, so that large numbers of nuclei have near zero or near maximal Hb, consistent with the idea that there is
an expression boundary—cells in the anterior of the embryo have Hb ‘‘on’’ and cells in the posterior have Hb ‘‘off.’’ But intermediate levels of Hunchback expression also occur with nonzero probability, and the overall distribution is quite smooth.
We can compare the experimentally measured distribution of Hb expression levels with the distribution predicted if the system maximizes information flow, and we see from Fig. 4 that the agreement is quite good. The optimal distribution reproduces the bimodality of the real system, hinting in the direction of a simple on/off switch, but also correctly predicts that the system makes use of intermediate expression levels. In particular, the matching of the probability weights in the ‘‘on’’ and ‘‘off’’ state as well as the nonnegligible number of nuclei (!20%) experi- encing the intermediate state of induction are nontrivial pre- dictions of our calculation.
The smooth distribution of expression levels is at variance to the common view of the Bcd/Hb system as serving only to delineate a sharp spatial boundary, for which a single bit of capacity would suffice. As noted above, direct computations from the data show that information beyond 1 bit is present, in amounts very close to the maximum possible value. This extra information depends upon the detailed structure of the distri- bution, which we see is correctly predicted by the theory. More precisely, the intermediate levels of Hb can have meaning only if the noise at those levels is sufficiently low, and it is this intuitive condition that leads to the predicted matching of the expression level distribution to the noise levels. These details are important, because it is precisely in this concentration interval where the embryo ultimately partitions the anterior–posterior axis with a precision of one nuclear row.
Caveats. Our results on the Bcd/Hb system are extremely en- couraging. The real system achieves!90% of the maximum information transmission, and the observed distribution of Hunchback expression levels is in rather good agreement with the distribution predicted from our optimization principle, with no adjustable parameters. To be fair, however, we collect here several caveats.
We have treated the simplest version of our theoretical problem, considering one input and one output, with no feed- back. In fact, Hb activates its own expression (36), and this must contribute to the shape of the input/output relation and perhaps also to the noise level. But an important aspect of our analysis is that the maximum mutual information depends on the ob- served input/output relation and noise in the system, and not directly on the molecular mechanisms that generate these char- acteristics. Thus, the information capacity is the same no matter whether (for example) the steepness of the input/output relation is the result of intrinsic cooperativity among Bcd molecules or a self-activating feedback loop, assuming that both mechanisms also account correctly for the observed noise level. On the other hand, if the gradient of maternally expressed Hb provides a separate path for transmission of positional information to the final zygotic expression level, then our discussion of one input and one output may be too drastic a simplification.
Bicoid has multiple targets and many of these genes have multiple inputs (37), so to fully optimize information flow, we need to think about a more complex problem than the single input, single output system considered here. How does this affect, for example, our discussion of coding by combinations of gap gene expression levels? Because Bcd acts as an activator for all of the gap genes, their expression levels would tend to provide redundant information about the local Bcd level, reducing the available positional information below the nominal capacity estimated above. On the other hand, several of the gap genes are mutually repressive, and [as with lateral inhibition in the visual system (17)] this serves to remove redundancy and increase information transmission. It would be attractive if these inter-
Fig. 4. The measured (black) and optimal (red) distributions of Hunchback expression levels. The measured distribution is estimated from data of ref. 11 by making a histogram of thegvalues for each data point in Fig. 2. The optimal solution corresponds to the capacity ofIopt(c;g)(1.7 bits. The same plot is shown on logarithmic scale in theInset.
BIOPHYSICS
actions within the gap gene network could also be seen as solutions to an optimization problem.
Clearly, there are more steps to the developmental cascade than the primary gradients and the gap genes, and several interacting genes comprise each step. We emphasize that, de- spite this complexity, information theory tells us that informa- tion cannot spontaneously be created as it propagates through a gene cascade; rather, information can only be lost due to noisy processing. If maternal morphogens did not, to some extent, feed directly into subsequent layers, i.e., the pair-rule or segment polarity genes, in addition to controlling their primary gap gene targets, the information transmission from the maternal gradi- ents to the ultimate nuclear identities would be bounded from above precisely by the transmission between maternal gradients and the gap genes.
One can also raise concerns about the experiments with which we are comparing. Measurement of the distribution of expres- sion levels requires a fair sampling of all of the nuclei in the embryo, and this was not the intent of the experiments of ref. 11.
Similarly, the theoretical predictions depend somewhat on the behavior of the input/output relation and noise at low expression levels, which are difficult to characterize experimentally, as well as the (possible) deviations from Gaussian noise. A complete test of our theoretical predictions will thus require a new generation of experiments.
Concluding Remarks
The functionality of a transcriptional regulatory element is determined by a combination of its input/output relation, the
noise level, and the dynamic range of TF concentrations used by the cell. In parallel to discussions of neural coding (16, 19), we have suggested that organisms can make maximal use of the available regulatory power by achieving consistency among these three different ingredients; in particular, if we view the input/
output relation and noise level as fixed, then the distribution of TF concentrations or expression levels is predicted by the optimization principle. Although many aspects of transcriptional regulation are well studied, especially in unicellular organisms, these distributions of protein concentrations have not been investigated systematically. In embryonic development, by con- trast, the distributions of expression levels can literally be read out from the spatial gradients in morphogen concentration. We have focused on the simplest possible picture, in which a single input TF regulates a single target gene, but nonetheless find encouraging agreement between the predictions of our optimi- zation principle and the observed distribution of the Hunchback morphogen inDrosophila. We emphasize that our prediction is not the result of a model with many parameters; instead we have a theoretical principle for how the system should behave so as to maximize its performance and no free parameters.
ACKNOWLEDGMENTS.We thank T. Gregor, D. W. Tank, and E. F. Wieschaus for many helpful discussions, as well as for sharing the raw data from ref. 11.
This work was supported in part by National Institutes of Health Grants P50 GM071508 and R01 GM077599, by the Burroughs Wellcome Fund Program in Biological Dynamics (G.T.), by U.S. Department of Energy Grant DE-FG02- 91ER40671(to C.G.C.), and by National Science Foundation Grant PHY- 0650617.
1. Jacob F, Monod J (1961) Genetic regulatory mechanisms in the synthesis of proteins.J Mol Biol3:318 –356.
2. Elowitz MB, Levine AJ, Siggia ED, Swain PD (2002) Stochastic gene expression in a single cell.Science297:1183–1186.
3. Ozbudak E, Thattai M, Kurtser I, Grossman AD, van Oudenaarden A (2002) Regulation of noise in the expression of a single gene.Nat Gene31:69 –73.
4. Blake WJ, Kaern M, Cantor CR, Collins JJ (2003) Noise in eukaryotic gene expression.
Nature422:633– 637.
5. Setty Y, Mayo AE, Surette MG, Alon U (2003) Detailed map of acis-regulatory input function.Proc Natl Acad Sci USA100:7702–7707.
6. Raser JM, O’Shea EK (2004) Control of stochasticity in eukaryotic gene expression.
Science304:1811–1814.
7. Rosenfeld N, Young JW, Alon U, Swain PS, Elowitz MB (2005) Gene regulation at the single cell level.Science307:1962–1965.
8. Pedraza JM, van Oudenaarden A (2005) Noise propagation in gene networks.Science 307:1965–1969.
9. Golding I, Paulsson J, Zawilski SM, Cox EC (2005) Real-time kinetics of gene activity in individual bacteria.Cell123:1025–1036.
10. Kuhlman T, Zhang Z, Saier MH, Jr, Hwa T (2007) Combinatorial transcriptional control of the lactose operon ofEscherichia coli. Proc Natl Acad Sci USA104:6043– 6048.
11. Gregor T, Tank DW, Wieschaus EF, Bialek W (2007) Probing the limits to positional information.Cell130:153–164.
12. Shannon CE (1948) A mathematical theory of communication.Bell Sys Tech J27:379 – 423 and 623– 656. Reprinted in Shannon CE, Weaver W (1949)The Mathematical Theory of Communication(Univ of Illinois Press, Urbana, IL).
13. Cover TM, Thomas JA (1991)Elements of Information Theory(Wiley, New York).
14. Ziv E, Nemenman I, Wiggins C (2007) Optimal signal processing in small stochastic biochemical networks.PLoS One2:e1077.
15. Tkacˇik G, Callan CG, Jr, Bialek W (2008) Information capacity of genetic regulatory elements.Phys Rev E78:011910 – 011926.
16. Laughlin SB (1981) A simple coding procedure enhances a neuron’s information capacity.Z Naturforsch36C:910 –912.
17. Barlow HB (1961) Possible principles underlying the transformation of sensory mes- sages.Sensory Communication, ed Rosenblith W (MIT Press, Cambridge, MA), pp 217–234.
18. Atick JJ, Redlich AN (1990) Towards a theory of early visual processing.Neural Comp 2:308 –320.
19. Brenner N, Bialek W, de Ruyter van Steveninck R (2000) Adaptive rescaling optimizes information transmission.Neuron26:695–702.
20. Rieke F, Warland D, de Ruyter van Steveninck R, Bialek W (1997)Spikes: Exploring the Neural Code(MIT Press, Cambridge, MA).
21. Gregor T, Wieschaus EF, McGregor AP, Bialek W, Tank DW (2007) Stability and nuclear dynamics of the bicoid morphogen gradient.Cell130:141–152.
22. Wolpert L (1969) Positional information and the spatial pattern of cellular differenti- ation.J Theor Biol25:1– 47.
23. Detwiler PB, Ramanathan S, Sengupta A, Shraiman BI (2000) Engineering aspects of enzymatic signal transduction: Photoreceptors in the retina.Biophys J79:2801–2817.
24. Blahut RE (1972) Computation of channel capacity and rate-distortion functions.IEEE Trans Info Theory4:460 – 473.
25. Lawrence PA (1992)The Making of a Fly: The Genetics of Animal Design(Blackwell, Oxford).
26. Driever W, Nu¨sslein-Volhard V (1988) A gradient of bicoid protein inDrosophila embryos.Cell54:83–93.
27. Driever W, Nu¨sslein-Volhard C (1988) The bicoid protein determines position in the Drosophilaembryo.Cell54:95–104.
28. Driever W, Nu¨sslein-Volhard C (1989) The bicoid protein is a positive regulator of hunchbacktranscription in the earlyDrosophilaembryo.Nature337:138 –143.
29. Struhl G, Struhl K, Macdonald PM (1989) The gradient morphogen bicoid is a concen- tration-dependent transcriptional activator.Cell57:1259 –1273.
30. Tkacˇik G, Gregor T, Bialek W (2008) The role of input noise in transcriptional regulation.
PLoS One3:e2774.
31. Silverman R (1955) On binary channels and their cascades.IEEE Trans Info Theory1:19–27.
32. Rivera-Pomar R, Ja¨ckle H (1996) From gradients to stripes inDrosophilaembryogenesis:
Filling in the gaps.Trends Genet12:478 – 483.
33. Gergen JP, Coulter D, Wieschaus EF (1986) Segmental pattern and blastoderm cell identities.Gametogenesis and the Embryo, ed Gall JG (Liss, New York), pp 195–220.
34. Strong SP, Koberle R, de Ruyter van Steveninck RR, Bialek W (1998) Entropy and information in neural spike trains.Phys Rev Lett80:197–200.
35. Slonim N, Atwal GS, Tkacˇik G, Bialek W (2005) Information-based clustering.Proc Natl Acad Sci USA102:18297–18302.
36. Simpson-Brose M, Treisman J, Desplan C (1994) Synergy between the hunchback and bicoid morphogens is required for anterior patterning inDrosophila. Cell78:855– 865.
37. Ochoa-Espinosa A,et al.(2005) The role of binding site cluster strength in Bicoid- dependent patterning inDrosophila.Proc Natl Acad Sci USA102:4960 – 4965.