1
Supporting Information for
Late 20th century increase in northern Spitsbergen (Svalbard) glacier-derived runoff tracked by coralline algal Ba/Ca ratios Steffen Hetzinger1,2*, Jochen Halfar
3, Zoltan Zajacz
4,5, Marco Möller
6,7, Max Wisshak
8
1Institut für Geologie, Universität Hamburg, Bundesstr. 55, 20416 Hamburg, Germany
2GEOMAR Helmholtz-Zentrum für Ozeanforschung Kiel, Wischhofstr. 1-3, 24148 Kiel, Germany
3CPS-Department, University of Toronto Mississauga, 3359 Mississauga Rd. N, Mississauga, ON, L5L 1C6, Canada
4Department of Earth Sciences, University of Toronto, 22 Russell Street, Toronto, ON, M5S 3B1, Canada
5Department of Earth Sciences, University of Geneva, Rue des Maraichers 13, 1205 Geneva
6Institute of Geography, University of Bremen, Bibliothekstr. 1, 28359 Bremen, Germany
7Geography Department, Humboldt-Universität zu Berlin, Unter den Linden 6, 10099 Berlin, Germany
8Senckenberg am Meer, Marine Research Department, Südstrand 40, 26382 Wilhelmshaven
*corresponding author: shetzinger@geomar.de
Contents of this file
Figure S1 Table S1Caption for Dataset S1
Additional Supporting Material (Files uploaded separately)
Dataset S1 ("Dataset S1.xlsx")This supporting information provides one supplementary figure (Figure S1) and one supplementary table (Table S1). Figure S1 shows the original annual resolution Ba/Ca ratios for all four samples used to calculate the multispecimen average. Table S1 details the correlation coefficients for comparisons between algal Ba/Ca records from individual samples. Dataset S1 (uploaded separately) provides the data shown in Figure S1 plus the normalized algal Ba/Ca data that were used for comparisons to modelled runoff and climatic mass balance records.
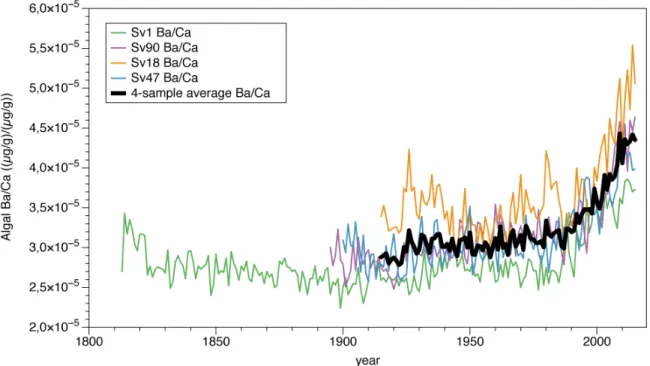
2 Figure S1. Algal Ba/Ca ratios based on four individual C. compactum samples.
One sampling transect per specimen. Multispecimen average (4-sample average, bold black line) is calculated for overlapping time period 1915-2015.
Sample Sv1 Sv90 Sv18 Sv47
Sv1 1 0.73 (0.84) 0.66 (0.74) 0.77 (0.93)
Sv90 1 0.78 (0.85) 0.75 (0.9)
Sv18 1 0.69 (0.82)
Sv47 1
range annual >0.66 (0.66-078) range N5 >0.74 (0.74-0.93) sign. at the 99.9% level
Table S1. Comparison of Ba/Ca ratio records from individual algal samples.
Correlation coefficients (R) are shown for annual resolution records, 5-year averages (N5) are given in brackets, respectively (p < 0.001, 1915-2015 time interval).
Dataset S1 (uploaded as separate file "Dataset S1.xlsx"). Primary data from Svalbard samples. Algal Ba/Ca ratio time series in ((µg/g)/(µg/g)) for individual samples and the four-sample average (columns B-F). Normalized Ba/Ca ratios shown in columns G-K. Data was normalized to unit variance by subtracting the mean and dividing by standard deviation (STD) for the common time period (1915-2015). The multi-specimen 4-sample average is calculated for the same time period . Data given in annual mean resolution, calculated from monthly-resolved algal proxy data.