https://doi.org/10.1007/s00382-021-05642-x
Late twentieth century increase in northern Spitsbergen (Svalbard) glacier‑derived runoff tracked by coralline algal Ba/Ca ratios
Steffen Hetzinger1,2 · Jochen Halfar3 · Zoltan Zajacz4,5 · Marco Möller6,7 · Max Wisshak8
Received: 4 May 2020 / Accepted: 9 January 2021
© The Author(s) 2021
Abstract
The Arctic cryosphere is changing rapidly due to global warming. Northern Svalbard is a warming hotspot with a tem- perature rise of ~ 6 °C over the last three decades. Concurrently, modelled data suggest a marked increase in glacier runoff during recent decades in northern Svalbard, and runoff is projected to increase. However, observational data from before anthropogenic influence are sparse and the potential effects on the surface ocean are unclear. Here, we present a 200-year record of Ba/Ca ratios measured in annual increment-forming coralline algae from northern Spitsbergen as a proxy for past glacier-derived meltwater input. Our record shows a significant increasing trend in algal Ba/Ca ratios from the late-1980s onwards matching modelled regional runoff data, suggesting a drastic increase in land-based runoff. The rate of increase is unprecedented during the last two centuries and captures the impact of amplified warming on the coastal surface ocean in the high Arctic. The algal Ba/Ca runoff proxy offers an opportunity to reconstruct past land-based runoff variability in Arctic settings in high resolution, providing important data for validating and improving climate modelling studies.
Keywords Ba/Ca · Runoff proxy · Glacier · Freshwater · Coralline algae · Svalbard
1 Introduction
Trends and extremes seen in twenty-first century obser- vations of the Arctic atmosphere-cryosphere system are moving well outside the twentieth century envelope (IPCC 2019). The Svalbard archipelago has become a global warm- ing hotspot with an exceptionally strong 2 °C/decade warm- ing of winter mean surface air temperature (van Pelt et al.
2019). Significant warming is predicted across Svalbard for the coming decades, i.e. surface air temperature increases of up to 7 °C (in addition to the warming that has already taken place) for medium greenhouse gas emission scenarios, and up to 10 °C for high emission scenarios by 2100 C.E.
(Hanssen-Bauer et al. 2019). Ongoing warming will have wide-reaching consequences for land and ocean ecosys- tems, ranging from significant changes in predicted river flow and glacier meltwater contribution, to an increase in erosion and sediment transport, to altering of the length of the snow season. Long-term direct measurements of glacier mass balances are only available from the western and south- ern parts of Spitsbergen, mostly from observations of indi- vidual glaciers starting in the 1960s (e.g. Lefauconnier et al.
1999). A number of studies have estimated Svalbard long- term glacier mass balance trends using models, commonly
Supplementary Information The online version contains supplementary material available at https ://doi.org/10.1007/s0038 2-021-05642 -x.
* Steffen Hetzinger shetzinger@geomar.de
1 Institut Für Geologie, Universität Hamburg, Bundesstr. 55, 20416 Hamburg, Germany
2 GEOMAR Helmholtz-Zentrum Für Ozeanforschung Kiel, Wischhofstr. 1-3, 24148 Kiel, Germany
3 CPS-Department, University of Toronto Mississauga, 3359 Mississauga Rd. N, Mississauga, ON L5L 1C6, Canada
4 Department of Earth Sciences, University of Toronto, 22 Russell Street, Toronto, ON M5S 3B1, Canada
5 Department of Earth Sciences, University of Geneva, Rue des Maraichers 13, 1205 Geneva, Switzerland
6 Institute of Geography, University of Bremen, Bibliothekstr. 1, 28359 Bremen, Germany
7 Geography Department, Humboldt-Universität Zu Berlin, Unter den Linden 6, 10099 Berlin, Germany
8 Senckenberg Am Meer, Marine Research Department, Südstrand 40, 26382 Wilhelmshaven, Germany
forced by regional climate model or reanalysis fields (e.g.
Möller et al. 2013; Möller and Kohler 2018; Østby et al.
2017; van Pelt et al. 2019). However, the reported spread in variability of Svalbard-wide glacier mass balance, long- term trends and decadal- to multidecadal-scale variations is large, mainly due to the use of different models, forcings, calibration, spatial resolution, and limited observational data basis. Projections show a rapid and large increase expected towards the end of this century and more than half of the land-terminating glacier areas on Svalbard are predicted to disappear under RCP8.5 forcing (Möller et al. 2016a).
Although, increased precipitation also plays a role, the main contribution to runoff is glacier melt caused by increasing temperatures. Thus, increased input of glacier-derived fresh- water runoff may significantly influence surface ocean water properties, such as altering nutrient availability and sediment load, thereby directly influencing coastal marine ecosystems (Hanssen-Bauer et al. 2019).
However, due to the sparseness and limitations in avail- able observed data, little is known about runoff variability of northern Svalbard before recent decades. A paleoproxy- based approach, allowing a reconstruction of runoff/glacier mass balance beyond the recent past decades, may thus deliver highly-needed data for comparison and model vali- dation. In general, proxy time series are sparse around Sval- bard, mostly limited to short-term high-resolution records (e.g. Carroll et al. 2011; Vihtakari et al. 2017); longer, but lower-resolution marine sediment records (Rasmussen and Thomsen 2013), or land-based records (Gjerde et al. 2018;
Isaksson et al. 2005; Schomacker et al. 2019). Recently, long-lived coralline algae that grow attached to the seafloor have emerged as novel mid- and high-latitude paleoclimate archives providing multicentury records from a number of regions including Svalbard (Halfar et al. 2008; Hetzinger et al. 2012, 2018; Williams et al. 2018). The species Clath- romorphum compactum (Kjellmann) Foslie (1898) forms thick carbonate crusts on rocky bottoms in the sublittoral spanning from the northwestern Atlantic through the Arctic Ocean (Adey et al. 2013). It reaches maximum abundance around 10–20 m water depth and is well suited as a climate recorder because it is (1) widely distributed, (2) has a multi- century lifespan, and (3) displays annual growth increments (similar to tree rings) in a high-Mg calcite skeleton. Slow growth rates (< 50–500 μm/year) and annual banding permit the development of sub-annually resolved reconstructions.
Coralline algal Ba/Ca ratios have been successfully used as a tracer of coastal freshwater runoff and as a recorder of past changes in surface ocean freshwater balance and pro- ductivity (Hetzinger et al. 2013). Barium concentrations in the coastal surface oceans can be influenced by the input of suspended sediments from land sources (Guay and Kenison Falkner 1998; Taylor et al. 2003) or upwelling of nutrient- rich deep waters (Lea et al. 1989). The surface ocean layer
is generally depleted in Ba compared to deep ocean waters (Lea et al. 1989), which are often enriched due to the uptake of Ba as barite (BaSO4), associated with the formation of biological particulate matter (Falkner et al. 1994; Lea and Boyle 1989). Ba/Ca ratios measured in the calcium carbon- ate skeletons of marine organisms have proven to be a valu- able proxy for seawater Ba/Ca that can provide information on past coastal sediment transport, river-based freshwater discharge, salinity, as well as nutrient and alkalinity distri- butions (Gillikin et al. 2006; Hönisch et al. 2011; Lea and Boyle 1989; Sinclair and McCulloch 2004). In the Arctic Ocean, dissolved Ba concentrations in the surface mixed layer have been linked to the fluvial input of major rivers (Guay and Kenison Falkner 1998).
Here, we provide the first proxy-based reconstruction of past Svalbard runoff variability at annual resolution. We focus on the analysis of algal Ba/Ca variations as a proxy for land-based runoff variability to address several funda- mental research questions: (1) do coralline algal-based Ba/
Ca ratios capture land-based Svalbard runoff variability?;
(2) has land-based runoff in northern Svalbard increased in recent decades due to enhanced surface warming?; (3) is the variability in the coralline algal-based runoff proxy comparable to Svalbard observations, model estimates, and large-scale Arctic trends? This study builds upon the data presented in Hetzinger et al. (2019), where a combination of algal Mg/Ca ratios and annual extension rates measured on some of the same samples analyzed here were used to reconstruct past sea-ice changes.
2 Methods
2.1 Sample collection
Long-lived C. compactum coralline algae were collected off northern Spitsbergen during MARIA S. MERIAN cruise MSM55 in June 2016 at the study site “Mosselbukta” (at station MSM55/444, 79.9° N, 15.9° E; Fig. 1a). The site is influenced by seasonal sea ice cover for 6 months per year on average. The northern Svalbard coast is one of the north- ernmost possible study sites in the Arctic with confirmed growth of C. compactum coralline algae, as the relatively warm Svalbard Branch of the West Spitsbergen Current (WSC), which flows along the northern margin, is keeping the northern coast partly ice-free in summer. At the study site Mosselbukta [Fig. 1a, (Wisshak et al. 2019)], collection of coralline algal buildups took place by removing them from rocky substrate using a chisel and the manipulator arm of the submersible JAGO. All specimens were collected live from hard substrate at a water depth of 15 m. Appropriate algal specimens for sclerochronological and geochemical analysis were selected according to size (taller specimens = longer
record) and smoothness of surface (smoother surface = better developed internal growth increments and lower degree of bioerosion-based on previous experience). Four specimens of the crustose coralline alga C. compactum were used in this study.
2.2 Sample preparation
Untreated coralline algal specimens were slabbed vertically to a thickness of ~ 1 cm using a rock saw, then thick sec- tions (2 mm) were cut from the slabs. In preparation for microscopic scanning, sample surfaces were polished using diamond-polishing suspensions with grit sizes of 9, 3, and 1 µm on a Struers Labopol polishing disk. High-resolution digital images of the polished surface were produced using an Olympus reflected light microscope (VS-BX) attached to an automated sampling stage and imaging system equipped with the software geo.TS (Olympus Soft Imaging Systems).
This setup allows two-dimensional mapping of the surfaces of polished specimens at various magnifications. The result- ant high-resolution photomosaics enable the identification and lateral mapping of growth-increment patterns over the entire sample (see Fig. 2). In preparation for laser ablation- inductively coupled plasma-mass spectrometry (LA-ICP- MS) analysis, paths for laser line transects as well as two reference points per sample were digitized on high-resolu- tion photomosaics perpendicular to the direction of growth using geo.TS software. Coordinates of digitized paths and reference points were subsequently transferred to the LA- ICP-MS system. After recoordination of the sample, laser
line transects could be precisely positioned along previously digitized paths.
2.3 Geochemical sample analysis by LA‑ICP‑MS LA-ICP-MS analyses were carried out in the Magmatic and Ore-Forming Processes Research Laboratory at the Univer- sity of Toronto, Canada, on four samples (Sv1, Sv18, Sv47, Sv90). 43Ca and 24Mg contents were measured using a NWR 193 UC laser ablation system coupled to an Agilent 7900 Quadrupole mass spectrometer. Each sample underwent a pre-ablation step to remove surface contaminants and the transects were placed to avoid conceptacles. Measurements
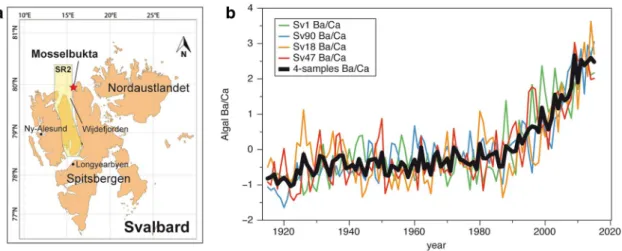
Fig. 1 Location map and algal Ba/Ca ratios. a Map of Svalbard Archipelago in the Arctic with location of Mosselbukta study site in northern Spitsbergen (red asterisk), where long-lived encrusting coralline algal buildups were collected in June 2016. Yellow-shaded rectangle indicates Subregion 2 (SR2) from which modelled runoff and climatic mass balance (CMB) data was used (Möller and Kohler 2018). Locations of Ny-Ålesund and Longyearbyen are indicated,
where air temperature station data is available. b Algal Ba/Ca ratios from four individual Clathromorphum compactum samples and mul- tispecimen average (4-sample average, bold black line) for overlap- ping time period 1915–2015. Algal proxy data are annually-averaged and normalized to unit variance by subtracting mean and dividing by standard deviation
Fig. 2 Photomosaic of polished cross section of coralline alga from Mosselbukta, northern Spitsbergen (sample Sv90, Clathromorphum compactum; time period C.E. 1895–2016 covered by the proxy).
Post-analysis laser ablation–inductively coupled plasma–mass spec- trometry (LA-ICP-MS) sampling line transects (“Laser transects”) are visible. Red arrow indicates direction of algal growth
were carried out with laser energy densities of 6 J/cm2, laser pulse rate of 10 Hz and helium as carrier gas.
The rectangular laser slot size was 70 × 10 μm with the long axis oriented parallel to growth increments. Individual line transects measuring up to 6000 µm in length were ana- lyzed with a scan speed of 5 µm/second. ICP-MS cycling time was set so that ~ 6.5 samples were measured per second resulting in a sampling resolution of 0.775 μm. Several laser transects were run in parallel on the samples allowing the determination of sample heterogeneity and to confirm data reproducibility. 43Ca was used as the internal standard with calcium concentrations measured by ICP-OES (Hetzinger et al. 2009). NIST SRM 610 glass (US National Institute of Standard and Technology Standard Reference Material) was analyzed as an external standard twice for 60 s every hour to allow correcting for instrumental drift. Monitored instru- mental drift was always insignificant (standard deviations of all analyses within 10%). More details on LA-ICP-MS methodology for C. compactum, including relative standard deviation for repeated analysis of NISTSRM610 standards (external reproducibility) for elemental ratios (including Mg/
Ca and Ba/Ca) and detection limits, can be found in Hetz- inger et al. (2011). An in-house spreadsheet adapted for the line transect data input was used for data reduction.
2.4 Development of chronologies
Chronologies were generated by counting annual growth increments on the mapped and digitized image of the speci- mens (Fig. 2). All samples were live collected, hence the top layer was assigned the year of collection. The yearly growth layers are strongly delineated by bands of short, heavily- calcified cells that are formed during the late autumn and winter, when the reproductive sporangia (conceptacles) are produced (Adey et al. 2013). Yearly growth banding is usu- ally well-defined, although it can be disrupted by inverte- brate grazing or boring and other surface damage. High Mg values within the skeleton of Clathromorphum are inter- preted to correspond to summer periods of growth. Age models were established on the basis of the pronounced sea- sonal cycle in algal Mg/Ca and the annual growth banding, respectively. Maximum (minimum) Mg/Ca values were tied to August (February) for Mosselbukta samples, which is on average the warmest (coolest) month at the study site. The algal Mg/Ca time series were linearly interpolated between these anchor points using the AnalySeries software (Paillard et al. 1996) to obtain an equidistant proxy time series with a resolution of 12 samples/year. The developed chronolo- gies were refined and cross-checked for possible errors in the age model by comparing annual extreme values in the Mg/Ca ratios to mapped growth increment patterns for each individual year of algal growth. Mean annual extension rates for Mosselbukta samples were obtained from Mg/Ca cycles
widths and are 125 µm (sample Sv1), 143 µm (sample Sv18), 125 µm (sample Sv47), and 145 µm (sample Sv90). Sam- ple Sv1 displays the longest record (1813–2015). Sample Sv18 extends from 1915 to 2015, sample Sv47 from 1900 to 2015, and Sv90 covers the past 120 years (1894–2015).
Annually averaged Mg/Ca ratio time series were calculated from monthly-resolved time series. The multi-specimen intersample average record was calculated by averaging all data from four algal specimens for the common time period (1915–2015).
3 Results
3.1 Sample overview
Using LA-ICP-MS analysis, four individual coralline algal samples were analyzed for this study (see “Methods”).
Samples extend from 1813 to 2015 (see Figure S1 and pri- mary data in Dataset S1 in Supplementary Material), with all samples overlapping 1915–2015, a 100-year common time period record. Sample Sv1, which extends back to 1813, gives a rare insight into nineteenth century variabil- ity. Elemental ratios were analyzed along single transects spanning the entire record of algal growth on each of the four samples. We first compare Ba/Ca ratios of all samples, then focus on the common time period where all samples overlap (1915–2015, Fig. 1b). The comparison between Ba/Ca records from individual samples indicates high intersample reproducibility (Figure S1 in Supplementary Material). Correlations among individual Ba/Ca records are R > 0.66 (0.66–0.78; p < 0.001) for annual means and R > 0.74 (0.74–0.93; p < 0.001) for 5-year running means (see also Supplementary Table S1 for detailed correlations).
Algal Ba/Ca ratio time series from all samples show similar interannual- to decadal-scale variability (Fig. 1b) and also a very similar onset of a strong increasing trend starting in the late-1980s. We normalize annual-resolution Ba/Ca ratio records from individual samples by removing the mean and dividing by the standard deviation. From individual normal- ized records a normalized 4-sample intersample average is calculated for the common time period (Fig. 1b), which is used for following comparisons to climate data.
3.2 Relationship of algal Ba/Ca to observations and model data
Due to the lack of direct runoff observations in north- ern Svalbard, algal Ba/Ca ratio time series are compared to modelled runoff and climatic mass balance (CMB) data from Möller and Kohler (2018) available for the 1901–2009 time period (Fig. 3). In that study a degree- day based CMB model was forced by spatially-distributed
and statistically downscaled air temperature and precipi- tation data from the European Centre for Medium-Range Weather Forecasts (ECMWF) twentieth century reanal- ysis (ERA-20C) (Poli et al. 2016) to obtain CMB time
series for all glacier-covered areas of the Svalbard Archi- pelago. CMB is defined as the sum of ablation (negative value), accumulation and all refreezing (Cogley et al.
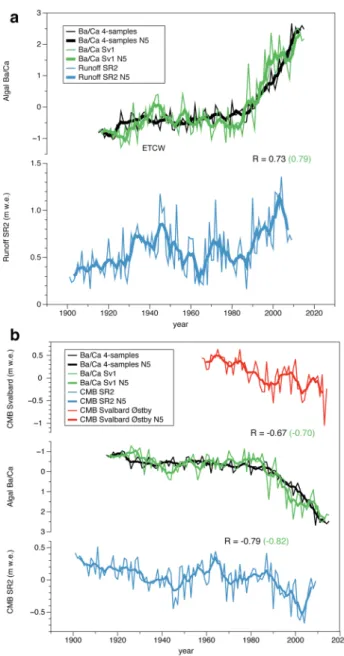
2011), while annual runoff is calculated by subtracting annual refreezing from the sum of the absolute amounts of annual ablation and rainfall. We compare our data to runoff estimates from subregion 2 (SR2, January–Decem- ber annual averages, see Möller and Kohler 2018, their Fig. 1), which borders the study site and includes the Wijdefjorden and its western tributaries (Fig. 1a). Algal Ba/Ca ratios are significantly correlated with runoff of SR2 from 1915 to 2009 (Fig. 3a; 4-sample-average, annual mean: R = 0.45, p < 0.001; 5-year running aver- age (N5): R = 0.73, p < 0.01) and CMB (Fig. 3b, CMB;
R = − 0.46, p < 0.01; N5: R = − 0.79, p < 0.001). Cor- relations are slightly higher for the longer (1901–2009) single-specimen-based Ba/Ca record (sample Sv1) and both, SR2 runoff (annual mean: R = 0.46, p < 0.001; N5:
R = 0.79, p < 0.001) and SR2 CMB (R = − 0.48, p < 0.001;
N5: R = − 0.82, p < 0.001). A test with detrended proxy time series yielded similar correlations (e.g. Sv1 to SR2 runoff, annual mean: R = 0.43, p < 0.001, N5: R = 0.78, p < 0.001; Sv1 to SR2 CMB, annual mean: R− .44, p < 0.001; N5: R = − 0.80, p < 0.001). A comparison to Svalbard-wide CMB from Østby et al. (2017) indicates a significant negative relationship to algal Ba/Ca ratios (Fig. 3b, 1958–2014). For the 4-sample-average Ba/Ca ratios: annual mean: R = − 0.54, p < 0.001; 5-year run- ning average (N5): R = − 0.67, p < 0.05). Correlations are similar for the single-specimen-based Ba/Ca record (sample Sv1): annual mean: R = − 0.49, p < 0.001; N5:
R = − 0.70, p < 0.05).
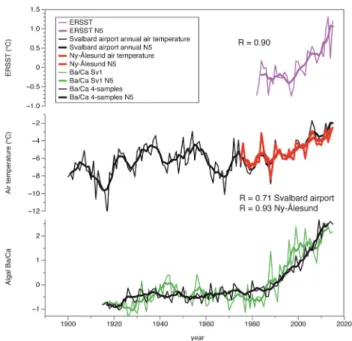
A significant positive relationship is found between annually averaged Svalbard air temperature (recorded at Svalbard Airport at Longyearbyen, West Coast, Fig. 1a) and algal Ba/Ca ratios (4-sample-average, R = 0.57 for annual means; R = 0.71 for 5-year running means, p < 0.01, 1915–2015). Relationships to air temperature observa- tions from Ny-Ålesund station, which is located closer to the study site (Fig. 1a) are higher (4-sample-average, R = 0.70 for annual means, R = 0.93 for 5-year running means, p < 0.01, 1977–2014). Note that monitoring at Ny- Ålesund only started in 1977. SST data also show a sig- nificant increase at northern Svalbard starting in the 1990s (Fig. 4). Relationships between algal Ba/Ca and ERSST (v.5) reanalysis data (Huang et al. 2017) are calculated for the 1982–2015 time period (SST averaged for 12–20°E, 79–80°N including the study site). Before 1982 the num- ber of observations for the northern part of Svalbard is low with frequent data gaps. Correlations are significant for the 4-sample average and annual mean ERSSTs (R = 0.73 for annual means, p < 0.001; R = 0.90 for 5-year running means, p < 0.05).
Fig. 3 Algal Ba/Ca proxy compared to runoff and climatic mass balance. a Normalized annual algal Ba/Ca ratios compared to mod- elled annual runoff in subregion SR2 (taken from Möller and Kohler 2018). Records for multi-specimen 4-sample average and sample Sv1 are shown. b Comparison between normalized annual algal Ba/
Ca ratios and Svalbard climatic mass balance data from models. Top panel (red) shows Svalbard-wide CMB from Østby et al. (2017), bot- tom panel (blue) is regional CMB for subregion SR2 from Möller and Kohler (2018), which borders the study site Mosselbukta (see Fig. 1).
Note that Ba/Ca is sign inverted in b. Thin lines represent annual- averaged records; bold lines are five-year moving averages (N5). Cor- relation coefficients are shown for Ba/Ca of 4-sample average (Sv1) using 5-year moving averages, respectively (p < 0.01; p < 0.05 for comparison to CMB Svalbard overall in b)
4 Discussion
4.1 Algal Ba/Ca proxy: runoff relationship and variability
Enhanced glacier-derived runoff may deliver large volumes of barium-enriched freshwater to the surface ocean, where uptake during growth of C. compactum can take place in relatively shallow water. Due to the absence of upwelling and close proximity of the algae collection site to land, and therewith source areas for Ba enriched runoff (Fig. 1a), algal Ba/Ca ratios most likely reflect the flux of suspended sediments transported to the coastal ocean surface layer from nearby partially glaciated landscapes. Past studies have shown that Ba transported in fine-grained suspended sediments (e.g. riverborne clays) can desorb in the mixing zone between fluvial and ocean waters, then becoming a conservative tracer (Guay and Kenison Falkner 1998). Ba is then incorporated into the coralline algal skeleton propor- tionally to its concentration in seawater. Clathromorphum
sp. samples from coastal Alaska have already shown that higher suspended sediment loads in seasonal runoff can be registered in algal Ba/Ca ratios, that were also detected in the surface layer by oceanographic monitoring (Chan et al.
2011).
Since in situ observations of runoff are not available for northern Spitsbergen, the comparison of algal-based Ba/Ca data to model data helps us to assess our proxy. The close relationship of algal Ba/Ca ratios to modelled runoff data, including the recent increase in the late-1980s, demonstrates that algal Ba/Ca ratios at Mosselbukta can provide a con- tinuous and highly-resolved record of runoff input to the northern Svalbard coastal surface ocean.
When investigating decadal-scale variability in our proxy record, an increase in sample Sv1 Ba/Ca ratios is observed from 1930 lasting to the mid-1940s, suggesting a period of increased runoff in the first half of the twentieth century (Fig. 3a). This multiyear episode corresponds to the “Early Twentieth Century Warming” (ETCW), a large Arctic warm- ing event that commenced in the 1920s and peaked around 1930–40. During this time period a significant increase in observed surface air temperature has been linked to a major shift in westerly winds between Norway and Spitsbergen leading to enhanced atmospheric and oceanic heat transport from the comparatively warm North Atlantic Current to the Arctic (Bengtsson et al. 2004). This event is also displayed in modelled Svalbard-wide mass balance, with the 1930s and early 1940s showing the highest ablation sums for the twentieth century (Fig. 3b), with only the first decade of the twenty-first century having even higher ablation rates (Möller and Kohler 2018). Comparable reductions in mod- elled mass balance during the 1930s have also been found for the Greenland Ice Sheet (GIS) (Fettweis et al. 2017).
A similar effect has been observed in an algal-based sea- ice proxy reconstruction (Hetzinger et al. 2019), where the ETCW episode is characterized by a substantial reduction in sea-ice due to enhanced surface warming.
4.2 Proxy comparison to Svalbard runoff, glacier mass balance, and temperature
Although significant warming has been observed in Svalbard since the 1960s (Nordli 2018), the detailed assessment of long-term consequences for Svalbard glaciers and regional CMB is difficult to conduct. Only few local measurements exist, such as the Longyearbyen Airport time series (Førland et al. 2011) showing an overall increase in air temperature (Fig. 4), similar to large-scale Arctic-wide assessments (Osborne et al. 2018). Observed warming trends have been reported to be statistically significant since the 1970s, with a strong warming of ~ 1 °C per decade. A decline in gla- cier mass balance from the mid-1980s onwards was mainly attributed to enhanced glacier melt rates (e.g. van Pelt et al.
Fig. 4 Comparison of algal Ba/Ca ratios to Svalbard temperatures.
Top panel shows sea surface temperature (SST) for the region that includes study site (averaged for 12–20° E, 79–80° N; 1982–2015).
Middle panel depicts air temperature records from western Spitsber- gen stations: Svalbard airport (black) and Ny-Ålesund station (red) for annually-averaged records (locations in Fig. 1). Svalbard airport (Longyearbyen) and Ny-Ålesund data available from Norwegian Meteorological Institute (e.g. Hanssen-Bauer et al. 2019) (http://
www.mosj.no/en/clima te/atmos phere /tempe ratur e-preci pitat ion.html).
SST from ERSST [v.5; Huang et al. (2017)]. Bottom panel shows normalized annual algal Ba/Ca ratios. Thin lines represent annually- averaged records; bold lines are 5-year moving averages (N5). Cor- relation coefficients shown for Ba/Ca ratios of 4-sample average vs. temperature using N5 (p < 0.05 for comparison to ERSST (top), p < 0.01 for comparison to air temperatures (middle)
2019), which in turn, have been linked to the significant increase in air temperatures (Fig. 4).
A strong increase in algal Ba/Ca ratios starts in the late- 1980s, concurrent with modelled Svalbard SR2 runoff, that increases significantly in the late-1980s as well (Fig. 3).
At the same time, modelled CMB indicates a significant decrease. The increase in Ba/Ca ratios continues to the end of the available algal record, matching the strongly negative values after 2010 (Fig. 3b) for overall Svalbard mass balance (Østby et al. 2017). For the algal Ba/Ca the magnitude of the increase is unprecedented over the entire proxy record, both for the common time period 1915–2015 and for the single- sample (Sv1) record extending to the early nineteenth cen- tury (see Figure S1). When comparing average Ba/Ca ratios between the 1915–1990 and 1990–2015 time periods, we observe an increase of 27% when comparing the past-1990 to the pre-1990 time periods for Ba/Ca ratios from sam- ple Sv1 and 25% for the 4-sample average. The significant increase of the Ba/Ca ratio suggests a much larger input of Ba-rich sediment/freshwater to coastal northern Svalbard surface waters starting in the 1980s (Fig. 3a). This corre- sponds to the modelled runoff rates for SR2 in Möller and Kohler (2018), which also show an uninterrupted increase starting in the 1980s. The most recent Ba/Ca data continue to increase from a low in the late 2000s to the end of the record in 2015 (Fig. 3a). Since the available modeled runoff data ends in 2009, the increase in the 2010s (seen in algal Ba/Ca) is not displayed. However, since warming at northern Svalbard has continued in the 2010s (see temperature obser- vations in Fig. 4), a further increase in land-based runoff, as suggested by algal Ba/Ca, is highly probable. The develop- ments of the Ba/Ca record and the SR2 runoff are concur- rent with the most negative CMB of the entire study period occurring during the first decade of the twenty-first century (Fig. 3b). This agreement is backed by the Svalbard-wide modeling study of Østby et al. (2017), extending to 2014 (Fig. 3b), and by region-specific CMB modeling of Möller and Kohler (2018). It is opposed by a modeling study of Lang et al. (2015), which found a stable Svalbard-wide sur- face mass balance over recent decades. However, additional short-term CMB studies also report a more negative CMB over the first decade of the twenty-first century and thus also indicate increased runoff rates towards the end of our study period (Aas et al. 2016; Möller et al. 2016b).
Declining mass balance, accelerating runoff trends and increasing freshwater flux starting in the late-1980s have been reported Arctic-wide, similar to our findings from northern Svalbard. Several studies have suggested that mass balance of the GIS has changed significantly over the last two decades (Bamber et al. 2018; Kamenos et al. 2012;
Mouginot et al. 2019; Noël et al. 2018). It has been argued that a non-linear rise in Greenland runoff has emerged recently due to GIS surface melting being pushed outside of
the range of previous natural variations by increasing sum- mer air temperatures (Trusel et al. 2018).
5 Conclusions
Our findings, based on algal Ba/Ca ratios as a proxy for runoff suggest a significant late twentieth century increase at Svalbard. Episodes of similar drastic increases in algal Ba/
Ca are not observed in the earlier portions of our 200-year long record, suggesting that the increase in glacier-derived runoff of the recent two decades is unprecedented in the last centuries. Algal Ba/Ca ratios can be used to study runoff input/freshwater variability prior to recent decades, when instrumental observations are nonexistent at Svalbard. Our proxy, which is well-replicated for the last 100 years, shows that amplified anthropogenic warming already affects Sval- bard hydrology and surface ocean variability. The algal Ba/
Ca runoff proxy may thus be used to distinguish natural variability from the anthropogenically-overprinted increase during the last decades in the Arctic. It will offer an oppor- tunity to develop a better understanding of ice melt and help to improve forecasts of future sea level increase. Continued atmospheric warming, as predicted by climate models for the high Arctic (IPCC 2019), may lead to further increases in land-based runoff in the decades to come. In the future additional ground truthing studies are needed at sites that have long-term observation data available.
Acknowledgements Coralline algal samples were collected during R/V Maria S. Merian cruise MSM 55 in 2016. We thank Captain Ralf Schmidt and the Maria S. Merian crew for providing our fieldwork platform, and the JAGO team for the sampling dive. This research was supported by the DFG (Grant HE 6251/4-1 to S. H.). J. H. was supported by a Natural Sciences and Engineering Research Council of Canada Discovery Grant (316003). Funding for the Maria S. Merian cruise 55 was provided to M. W. by the DFG in concert with the Leit- stelle Deutsche Forschungsschiffe. Thomas Schuler is acknowledged for providing the mass balance data from the modeling study of Østby et al. (2017).
Funding Open Access funding enabled and organized by Projekt DEAL. This research was supported by the Deutsche Forschungsge- meinschaft (DFG Grant HE 6251/4-1 to S. H.). J. H. was supported by a Natural Sciences and Engineering Research Council of Canada Discovery Grant (316003). Funding for the Maria S. Merian cruise 55 was provided to M. W. by the DFG in concert with the Leitstelle Deutsche Forschungsschiffe.
Compliance with ethical standards
Conflict of interest The authors declare that they have no known com- peting financial interests or personal relationships and/or conflicts of interest that could have appeared to influence the work reported in this paper.
Availability of data and material A dataset of Primary Data (Dataset S1) is provided with this manuscript. Primary Data will be uploaded to the NOAA National Centers for Environmental Information—Pale- oclimatology Data Repository after acceptance.
Code availability Not applicable.
Open Access This article is licensed under a Creative Commons Attri- bution 4.0 International License, which permits use, sharing, adapta- tion, distribution and reproduction in any medium or format, as long as you give appropriate credit to the original author(s) and the source, provide a link to the Creative Commons licence, and indicate if changes were made. The images or other third party material in this article are included in the article’s Creative Commons licence, unless indicated otherwise in a credit line to the material. If material is not included in the article’s Creative Commons licence and your intended use is not permitted by statutory regulation or exceeds the permitted use, you will need to obtain permission directly from the copyright holder. To view a copy of this licence, visit http://creat iveco mmons .org/licen ses/by/4.0/.
References
Aas KS, Dunse T, Collier E, Schuler TV, Berntsen TK, Kohler J, Luks B (2016) The climatic mass balance of Svalbard glaciers:
a 10-year simulation with a coupled atmosphere—glacier mass balance model. Cryosphere 10:1089–1104
Adey WH, Halfar J, Williams B (2013) Biological, physiological and ecological factors controlling high magnesium carbonate forma- tion and producing a precision Arctic/Subarctic marine climate archive: the coralline genus ClathromorphumFoslie emend Adey.
Smithson Contrib Mar Sci 40:1–48
Bamber JL, Tedstone AJ, King MD, Howat IM, Enderlin EM, van den Broeke MR, Noel B (2018) Land ice freshwater budget of the Arctic and North Atlantic Oceans: 1. Data, methods, and results.
J Geophys Res Oceans 123:1827–1837
Bengtsson L, Semenov VA, Johannessen OM (2004) The early twen- tieth-century warming in the Arctic—a possible mechanism. J Clim 17:4045–4057
Carroll ML, Ambrose WG, Levin BS, Locke VWL, Henkes GA, Hop H, Renaud PE (2011) Pan-Svalbard growth rate variability and environmental regulation in the Arctic bivalve Serripes groen- landicus. J Mar Syst 88:239–251
Chan P, Halfar J, Williams B, Hetzinger S, Steneck R, Zack T, Jacob DE (2011) Freshening of the Alaska Coastal Current recorded by coralline algal Ba/Ca ratios. J Geophys Res 116:G01032 Cogley JG, Hock R, Rasmussen LA, Arendt AA, Bauder A, Braith-
waite RJ, Jansson P, Kaser G, Möller M, Nicholson L, Zemp M (2011) Glossary of glacier mass balance and related terms, IHP- VII technical documents in hydrology no. 86. UNESCO-IHP, Paris
Falkner KK, MacDonald RW, Carmack EC, Weingartner TJ (1994) The potential of barium as a tracer of Arctic water masses. In: Johan- nessen OM, Muench RD, Overland JE (eds) The polar oceans and their role in shaping the global environment: the Nansen centen- nial volume, geophysical monograph. Series. AGU, Washington, DC, pp 63–76
Fettweis X, Box JE, Agosta C, Amory C, Kittel C, Lang C, van As D, Machguth H, Gallée H (2017) Reconstructions of the 1900–2015 Greenland ice sheet surface mass balance using the regional cli- mate MAR model. Cryosphere 11:1015–1033
Førland E, Benestad R, Hanssen-Bauer I, Haugen JE, Skaugen TE (2011) Temperature and precipitation development at
Svalbard 1900–2100. Adv Meteorol 2011:893790. https ://doi.
org/10.1155/2011/89379 0
Gillikin DP, Dehairs F, Lorrain A, Steenmans D, Baeyens W, André L (2006) Barium uptake into the shells of the common mussel (Mytilus edulis) and the potential for estuarine paleo-chemistry reconstruction. GeochimCosmochimActa 70:395–407
Gjerde M, Bakke J, D’Andrea WJ, Balascio NL, Bradley RS, Vasskog K, Ólafsdóttir S, Røthe TO, Perren BB, Hormes A (2018) Holo- cene multi-proxy environmental reconstruction from lake Hak- luytvatnet, Amsterdamøya Island, Svalbard (79.5°N). QuaternSci Rev 183:164–176
Guay CK, Kenison Falkner K (1998) A survey of dissolved barium in the estuaries of major Arctic rivers and adjacent seas. Cont Shelf Res 18:859–882
Halfar J, Steneck RS, Joachimski M, Kronz A, Wanamaker AD Jr (2008) Coralline red algae as high-resolution climate recorders.
Geology 36:463–466
Hanssen-Bauer I, Forland EJ, Hisdal H, Mayer S, Sando AB, Sorte- berg A (2019) Climate in Svalbard 2100—a knowldge base for climate adaptation, NCCS report 1/2019, p 105
Hetzinger S, Halfar J, Kronz A, Steneck RS, Adey W, Lebednik PA, Schöne BR (2009) High-resolution Mg/Ca ratios in a coralline red alga as a proxy for Bering Sea temperature variations from 1902 to 1967. Palaios. https ://doi.org/10.2110/palo.2008.p2108 -2116r
Hetzinger S, Halfar J, Zack T, Gamboa G, Jacob DE, Kunz BE, Kronz A, Adey W, Lebednik PA, Steneck RS (2011) High-resolution analysis of trace elements in crustose coralline algae from the North Atlantic and North Pacific by laser ablation ICP-MS. Pal- aeogeogrPalaeoclimatolPalaeoecol 302:81–94
Hetzinger S, Halfar J, Mecking J, Keenlyside N, Kronz A, Steneck R, Adey W, Lebednik P (2012) Marine proxy evidence linking dec- adal North Pacific and Atlantic climate. ClimDyn 39:1447–1455 Hetzinger S, Halfar J, Zack T, Mecking JV, Kunz BE, Jacob DE, Adey WH (2013) Coralline algal Barium as indicator for 20th century northwestern North Atlantic surface ocean freshwater variability.
Sci Rep. https ://doi.org/10.1038/srep0 1761
Hetzinger S, Halfar J, Kronz A, Simon K, Adey WH, Steneck RS (2018) Reproducibility of Clathromorphum compactum coralline algal Mg/Ca ratios and comparison to high-resolution sea surface temperature data. GeochimCosmochimActa 220:96–109 Hetzinger S, Halfar J, Zajacz Z, Wisshak M (2019) Early start of 20th-
century Arctic sea-ice decline recorded in Svalbard coralline algae. Geology 47:963–967
Hönisch B, Allen KA, Russell AD, Eggins SM, Bijma J, Spero HJ, Lea DW, Yu J (2011) Planktic foraminifers as recorders of seawater Ba/Ca. Mar Micropaleontol 79:52–57
Huang B, Thorne PW, Banzon VF, Boyer T, Chepurin G, Lawri- more JH, Menne MJ, Smith TM, Vose RS, Zhang H-M (2017) Extended reconstructed sea surface temperature, version 5 (ERSSTv5): upgrades, validations, and intercomparisons. J Clim 30:8179–8205
IPCC (2019) IPCC, 2019: summary for policymakers. In: Pörtner H-O, Roberts DC, Masson-Delmotte V, Zhai P, Tignor M, Poloczanska E, Mintenbeck K, Nicolai M, Okem A, Petzold J, Rama B, Weyer N (eds), IPCC special report on the ocean and cryosphere in a changing climate (SROCC)
Isaksson E, Divine D, Kohler J, Martma T, Pohjola V, Motoyama H, Watanabe O (2005) Climate oscillations as recorded in Svalbard ice core d18O records between 1200 and 1997. Geogr Ann Ser A Phys Geogr 87:203–214
Kamenos NA, Hoey TB, Nienow P, Fallick AE, Claverie T (2012) Reconstructing Greenland ice sheet runoff using coralline algae.
Geology 40:1095–1098
Lang C, Fettweis X, Erpicum M (2015) Stable climate and surface mass balance in Svalbard over 1979–2013 despite the Arctic warming. Cryosphere 9:83–101
Lea D, Boyle E (1989) Barium content of benthic foraminifera con- trolled by bottom-water composition. Nature 338:751–753 Lea D, Shen GT, Boyle EA (1989) Coralline barium records temporal
variability in equatorial Pacific upwelling. Nature 340:373–376 Lefauconnier B, Hagen JO, BørreØrbæk J, Melvold K, Isaksson E
(1999) Glacier balance trends in the Kongsfjorden area, west- ern Spitsbergen, Svalbard, in relation to the climate. Polar Res 18:307–313
Möller M, Kohler J (2018) Differing climatic mass balance evolution across svalbard glacier regions over 1900–2010. Front Earth Sci 6:128
Möller M, Finkelnburg R, Braun M, Scherer D, Schneider C (2013) Variability of the climatic mass balance of Vestfonna ice cap, northeastern Svalbard, 1979–2011. Ann Glaciol 54:254–264 Möller M, Obleitner F, Reijmer CH, Pohjola VA, Głowacki P, Kohler
J (2016b) Adjustment of regional climate model output for mod- eling the climatic mass balance of all glaciers on Svalbard. J Geo- phys Res Atmos 121:5411–5429
Möller M, Navarro F, Martín-Español A (2016a) Monte Carlo model- ling projects the loss of most land-terminating glaciers on Sval- bard in the 21st century under RCP 8.5 forcing. Environ Res Lett 11:094006
Mouginot J, Rignot E, Bjørk AA, van den Broeke M, Millan R, Mor- lighem M, Noël B, Scheuchl B, Wood M (2019) Forty-six years of Greenland Ice Sheet mass balance from 1972 to 2018. In: Pro- ceedings of the national academy of sciences, 201904242 Noël B, van de Berg WJ, van Wessem JM, van Meijgaard E, van As
D, Lenaerts JTM, Lhermitte S, KuipersMunneke P, Smeets CJPP, van Ulft LH, van de Wal RSW, van den Broeke MR (2018) Mod- elling the climate and surface mass balance of polar ice sheets using RACMO2—part 1: Greenland (1958–2016). Cryosphere 12:811–831
Nordli Ø (2018) The Svalbard airport temperature series. Bull Geogr Phys GeogrSer 3:5–25
Osborne E, Richter-Menge JA, Jeffries M (2018) Arctic report card Østby TI, Schuler TV, Hagen JO, Hock R, Kohler J, Reijmer CH (2017) 2018 Diagnosing the decline in climatic mass balance of glaciers in Svalbard over 1957–2014. Cryosphere 11:191–215
Paillard D, Labeyrie L, Yiou P (1996) Macintosh program performs time-series analysis. Eos Trans AGU 77:379
Poli P, Hersbach H, Dee DP, Berrisford P, Simmons AJ, Vitart F, Laloyaux P, Tan DGH, Peubey C, Thépaut J-N, Trémolet Y, Hólm
EV, Bonavita M, Isaksen L, Fisher M (2016) ERA-20C: an atmos- pheric reanalysis of the twentieth century. J Clim 29:4083–4097 Rasmussen TL, Thomsen E (2013) Pink marine sediments reveal
rapid ice melt and Arctic meltwater discharge during Dansgaard–
Oeschger warmings. Nat Commun 4:2849
Schomacker A, Farnsworth WR, Ingólfsson Ó, Allaart L, Håkansson L, Retelle M, Siggaard-Andersen M-L, Korsgaard NJ, Rouillard A, Kjellman SE (2019) Postglacial relative sea level change and glacier activity in the early and late Holocene: Wahlenbergfjorden, Nordaustlandet, Svalbard. Sci Rep 9:6799
Sinclair DJ, McCulloch MT (2004) Corals record low mobile barium concentrations in the Burdekin River during the 1974 flood: evi- dence for limited Ba supply to rivers? PalaeogeogrPalaeoclima- tolPalaeoecol 214:155–174
Taylor JR, Falkner KK, Schauer U, Meredith M (2003) Quantita- tive considerations of dissolved barium as a tracer in the Arc- tic Ocean. J Geophys Res Oceans 108(C12):3374. https ://doi.
org/10.1029/2002J C0016 35
Trusel LD, Das SB, Osman MB, Evans MJ, Smith BE, Fettweis X, McConnell JR, Noël BPY, van den Broeke MR (2018) Nonlin- ear rise in Greenland runoff in response to post-industrial Arctic warming. Nature 564:104–108
van Pelt W, Pohjola V, Pettersson R, Marchenko S, Kohler J, Luks B, Hagen JO, Schuler TV, Dunse T, Noël B, Reijmer C (2019) A long-term dataset of climatic mass balance, snow conditions, and runoff in Svalbard (1957–2018). Cryosphere 13:2259–2280 Vihtakari M, Ambrose WG, Renaud PE, Locke WL, Carroll ML, Berge
J, Clarke LJ, Cottier F, Hop H (2017) A key to the past? Element ratios as environmental proxies in two Arctic bivalves. Palaeoge- ogrPalaeoclimatolPalaeoecol 465:316–332
Williams S, Halfar J, Zack T, Hetzinger S, Blicher M, Juul-Pedersen T, Kronz A, Noël B, Broeke M, Berg WJ (2018) Coralline algae archive fjord surface water temperatures in southwest Greenland.
J Geophys Res Biogeosci 123:2617–2626
Wisshak M, Neumann H, Rüggeberg A, Büscher J, Linke P, Raddatz J (2019) Epibenthos dynamics and environmental fluctua- tions in two contrasting polar carbonate factories (Mosselbukta and Bjørnøy-Banken, Svalbard). Front Mar Sci. https ://doi.
org/10.3389/fmars .2019.00667
Publisher’s Note Springer Nature remains neutral with regard to jurisdictional claims in published maps and institutional affiliations.