Essays on Persistence in Growth Rates and the Success of the British Premium Bond
Dissertation zur Erlangung des Grades eines Doktors der Wirtschaftswissenschaft
eingereicht an der Fakultät für Wirtschaftswissenschaften der Universität Regensburg
vorgelegt von: Dipl.-Kfm. Alexander Hölzl
Berichterstatter: Prof. Dr. Klaus Röder (Universität Regensburg)
Prof. Dr. Sebastian Lobe (WHL Wissenschaftliche Hochschule Lahr)
Tag der Disputation: 24.07.2014
I
Dedicated to Julia
II
Content
List of tables ... V List of figures ... VI
1. Introduction ... 7
1.1. Summary ... 7
1.2. Overview of essays ... 12
2. Does the persistence in sales growth rates have predictive power? ... 15
2.1. Introduction ... 16
2.2. Literature review ... 18
2.3. Data and methodology ... 19
2.3.1. Data ... 19
2.3.2. Methodology ... 20
2.4. Investor appreciation of persistence in sales growth ... 23
2.5. Relationship between persistence in sales growth and persistence in income growth .. ... 24
2.5.1. Analyzing subsets of firms ... 25
2.5.2. Robustness test: Firms with a very high persistence in sales growth ... 30
2.6. Relationship between operating expenses and persistence in sales growth ... 31
2.7. Conclusion ... 32
3. Predicting above-median and below-median growth rates ... 44
3.1. Introduction ... 45
3.2. Data and methodology ... 48
3.2.1. Data ... 48
3.2.2. Runs of above-median or below-median growth rates ... 49
3.3. The logit model ... 50
III
3.3.1. Comparing groups of firms with positive and negative runs ... 51
3.3.2. Explanatory variables ... 52
3.3.3. Variable selection ... 54
3.4. Results ... 55
3.4.1. Logit model estimates ... 55
3.4.2. Classification test ... 57
3.4.3. Multiple discriminant analysis ... 59
3.5. General test for predictability ... 60
3.6. Conclusion ... 62
4. Why are British Premium Bonds so successful? The effect of saving with a thrill ... 75
4.1. Introduction ... 76
4.2. History of the Premium Bond and its characteristics ... 79
4.3. Classical risk tolerance analysis ... 81
4.3.1. Research method and preliminary considerations ... 81
4.3.2. Data ... 84
4.3.3. Short-run risk coefficients ... 85
4.3.4. Inclusion of personal wealth and higher investment amounts ... 87
4.3.5. Long-term analysis ... 89
4.4. Factors influencing net sales ... 90
4.4.1. Indifference risk coefficients ... 91
4.4.2. Analysing the Premium Bond net sales time series ... 92
4.4.3. Interest rate ... 93
4.4.4. Macroeconomic variables ... 94
4.4.5. Cumulative prospect theory ... 94
4.4.6. Prize skewness ... 96
IV
4.5. Regression analysis... 98
4.5.1. Period 1: October 1969 to September 1993 ... 99
4.5.2. Period 2: October 1993 to April 2006 ... 100
4.5.3. Period 3: May 2006 to December 2011 ... 101
4.5.4. Forecast tests ... 102
4.6. Conclusion ... 103
V
List of tables
Table 2.1: Market valuation of persistence in sales growth and net income growth. ... 38
Table 2.2: Persistence in growth across the entire sample. ... 38
Table 2.3: Persistence in growth across the sample period. ... 39
Table 2.4: Subset 1: Divided by country. ... 40
Table 2.5: Subset 2: Divided by industry. ... 41
Table 2.6: Subsets 3, 4, and 5: Divided by firm size, firm valuation, and leverage... 42
Table 2.7: Robustness test: Firms with a very high persistence in sales growth. ... 42
Table 2.8: Correlation between wf-delta and persistence in growth of operating expenses. ... 43
Table 3.1: Example of current run length. ... 68
Table 3.2: Sample summary of current run length. ... 68
Table 3.3: Summary statistics of explanatory variables. ... 69
Table 3.4: Correlation matrix. ... 70
Table 3.5: Logit regressions of run indicator on predictor variables. ... 71
Table 3.6: Classification tests. ... 72
Table 3.7: Multiple discriminant analysis. ... 73
Table 3.8: General test for predictability. ... 73
Table 4.1: Number and value of prizes awarded in December 2011. ... 108
Table 4.2: Premium Bond compared to alternative investments. ... 108
Table 4.3: Premium Bond compared to Bank of England base rate with inclusion of personal wealth and higher investment amounts. ... 109
Table 4.4: Granger causality tests of net sales and risk coefficients. ... 109
Table 4.5: Granger causality tests of net sales and skewness. ... 110
Table 4.6: Multivariate autoregressive models. ... 110
Table 4.7: Forecast accuracy. ... 111
VI
List of figures
Figure 3.1: Share of firms in the positive run group and the negative run group. ... 74 Figure 4.1: Interest rates of the Premium Bonds compared to the Bank of England base rate and the NS&I Income Bond. ... 112 Figure 4.2: Indifference risk coefficients (CRRA) Premium Bond compared to Bank of
England base rate. ... 112 Figure 4.3: Valuation based on cumulative prospect theory compared with Premium Bond net sales. ... 113 Figure 4.4: Prizes skewness compared with Premium Bond net sales. ... 113
7
1. Introduction
1.1. Summary
This dissertation contributes new evidence to two areas of research. The first part of the work aims at analyzing persistence in growth rates of operating performance as an important factor for firm valuations. The second part investigates the tremendous success of a lottery bond, the British Premium Bond.
The first two essays, presented in chapters 2 and 3, perform in-depth analyses on both the predictive power as well as the predictability of persistence in growth rates. In this context, persistence derives from the length and the relative frequency of so called runs. A positive run is registered if a firm produces above-median growth rates for a number of consecutive years.
A negative run consists of a series of consecutive below-median growth rates, respectively.
Runs and therefore persistence in growth rates are strongly linked with the valuation of a firm.
Many investors, analysts and valuation professionals extrapolate past growth rates to make their forecasts. The reason for this is the wide-spread sentiment among market participants that there is a considerable degree of consistency in a firm’s growth rates. This relation between persistence in growth rates and firm valuations leads to the two research questions addressed in the first part of the dissertation: (1) Do investors overestimate the predictive power of a high persistence in sales growth rates? (2) Is it possible to predict a high future persistence in growth rates based on a set of firm-specific financial indicators? These research questions are related to the literature on earnings behavior and investor expectations. De Bondt and Thaler (1987, 1990) analyze returns of stocks that have experienced either extreme capital gains or extreme losses. They argue that investors overreact to past firm performance and conclude that this is the main reason why simple value strategies based on valuation ratios beat growth strategies. In this context, Lakonishok et al. (1994) show that glamour
8
stocks with consistently high past growth rates in operating performance are rewarded with rich valuations. In the same way, value stocks are punished for previous disappointments after several years of consistently poor growth rates. They conclude that market participants had too high expectations about the future performance of glamour stocks. Confirming this finding, La Porta (1996) and La Porta et al. (1997) show that investors tend to extrapolate past growth too far into the future. As a result, stock market returns of value stocks tend to outperform glamour stocks over the long-term (e.g., Fama and French (1988)). Although investors are often tempted to believe in a high consistency of firm growth rates, research shows that empirically this is not the case. For instance, Little (1962) and Little and Rayner (1966) find that in the UK corporate annual earnings numbers essentially follow random processes. A short time later, Lintner and Glauber (1967) analyze US data and confirm that changes in earnings over time appear to be randomly distributed. The closest related study to the essays presented in this dissertation is the US-based cross-sectional study by Chan et al.
(2003). They caution against extrapolating past income growth rates into the future, because there is no persistence beyond chance. However, they do report that there is some persistence in sales growth rates.
Chapter 2 takes up this finding. It follows the question: what are the implications of an increased persistence in sales growth on future income growth rates? In particular, it investigates the hypothesis that investors overestimate the translation of an increased persistence in sales growth into consistently high income growth rates. The initial sample comprises data of more than 54,000 firms from 77 countries and over a sample period of 28 years. For the analysis, a new single measure of persistence in growth, called weighted frequencies-score (wf-score), is developed. It is based on a nonparametric test for serial correlation called “run-test” used by Chan et al. (2003). The new measure allows meaningful comparisons across heterogeneous sets of firms. It also enables to compare persistence in
9
growth of the three examined performance indicators sales, operating income and net income.
The results are as follows. Investors apparently strongly reward runs of above-median growth rates and thus a high persistence in sales growth. It is also shown that an increased persistence in sales growth is a global phenomenon. This supports the finding of Chan et al. (2003). The results furthermore reveal that the higher the persistence in sales growth, the more persistence is lost in the translation into income growth rates. This leads to the hypothesis that firms may trade persistence in income growth for a high persistence in sales growth. In a final test, it is shown that the loss of persistence in sales growth is correlated with consistently high growth rates in operating expenses. In total, the study cautions not to overestimate a high persistence in sales growth as a strong predictor of future profit growth rates.
Chapter 3 analyzes persistence in growth rates from a different perspective. In the previous chapter, the definition of persistence derives on an aggregate firm level. This means, persistence is detected if a group of firms has more runs of a certain length than would occur randomly. The goal is to analyze what past persistence tells about future persistence. In chapter 3, the focus is on individual firms and the predictability of specific runs which consist of combinations of above-median and below-median growth rates. Since firm valuations strongly respond to multiannual runs, it is worth to analyze their predictability and thus investigate the factors indicating or causing future runs in growth. The analysis aims to identify variables that indicate whether a firm is more likely to be particularly successful or unsuccessful within the next couple of years. The research methodology is based on binary response models. Both logit regressions and a multiple discriminate analysis are employed to distinguish between two distinct groups of firms. The first group has a positive run, consisting of a series of above-median growth rates after a given point in time. The second group of firms has a negative run, consisting of below-median growth rates, respectively. The prediction period covers six years. To endogenously identify the parsimonious indicator-
10
specific set of economically and empirically meaningful variables, stepwise regression is used. In-sample and out-of-sample classification tests are conducted to evaluate the predictive power of the forecast models. The results show that based on a set of widely-used financial variables, predicting positive and negative runs is possible. The accuracy of the prediction depends on the length of the investment period. The most salient prediction variable turns out to be the dividend to price ratio.
In chapter 4, representing the second part of the dissertation, a very successful British lottery bond is in the focus of interest, the Premium Bond. After being launched by the British Exchequer in November 1956, customers had almost 27 million holdings in Premium Bonds totalling about £43 billion by the end of 2011. Although monthly return is solely based on a lottery and therefore uncertain, this financial product is very popular. The study aims to explain what makes the Premium Bond and generally lottery-linked deposit accounts successful. The sample consists of a unique hand-collected set of data provided by the issuer.
In total, it covers a period of fifty-four years. The first part of the study considers the expected utility theory (Arrow, 1965; Pratt, 1964). To evaluate the relevance of an investor’s individual risk tolerance, the constant absolute risk aversion (CARA) and constant relative risk aversion (CRRA) coefficients are calculated at which a saver is indifferent between the Premium Bond and a risk-free investment. The second part of the study searches for factors influencing net sales. To detect relationships, Granger causality tests (Granger, 1969) are employed. Potential explanations based on cumulative prospect theory (Tversky and Kahneman, 1992;
Pfiffelmann, 2008) and prize skewness are analysed in detail (Guillén and Tschoegl, 2002;
Golec and Tamarkin, 1998; Garrett and Sobel, 1999; Bhattacharya and Garrett, 2008).
Finally, autoregressive models are constructed in order to establish a formal relationship between Premium Bond net sales and a variety of potential influential factors. The results show that CARA and CRRA risk coefficients as well as cumulative prospect theory have no
11
or only limited statistical influence on net sales. However, prize skewness, the number of jackpots and the maximum holding amount are important factors driving net sales.
12 1.2. Overview of essays
Papers included in the present dissertation:
• Does the persistence in sales growth rates have predictive power?
(with Sebastian Lobe)
ACATIS Value Prize 2013, Submitted to European Financial Management
• Predicting above-median and below-median growth rates (with Sebastian Lobe)
Submitted to Review of Managerial Science
• Why are British Premium Bonds so successful? The effect of saving with a thrill (with Sebastian Lobe)
Submitted to Journal of Empirical Finance Papers not included in the present dissertation:
•
The level and persistence of growth rates: International evidence (with Sebastian Lobe)Working paper, presented at Campus for Finance - Research Conference 2013, WHU Vallendar, January 16/17, 2013
• Perpetuity, bankruptcy, and corporate valuation: The global evidence [Ewigkeit, Insolvenz und Unternehmensbewertung: Globale Evidenz]
(with Sebastian Lobe)
CORPORATE FINANCE biz 2 (4) (2011), 252–257.
• Happy savers, happy issuer: the UK lottery bond, (with Sebastian Lobe)
Revue Bancaire et Financière/Bank- en Financiewezen, (6-7) (2008), 408–414.
13 References
Arrow, K.J., 1965. Aspects of the theory of risk-bearing. Yrjö Jahnssonin Säätiö, Helsinki.
Bhattacharya, N., Garrett, T.A., 2008. Why people choose negative expected return assets: An empirical examination of a utility theoretic explanation. Applied Economics 40 (1-3), 27–34.
Chan, L.K.C., Karceski, J., Lakonishok, J., 2003. The level and persistence of growth rates.
The Journal of Finance 58 (2), 643–684.
De Bondt, W.F.M., Thaler, R.H., 1987. Further evidence on investor overreaction and stock market seasonality. The Journal of Finance 42 (3), 557–581.
De Bondt, W.F.M., Thaler, R.H., 1990. Do security analysts overreact? The American Economic Review 80 (2), 52–57.
Fama, E.F., French, K.R., 1988. Dividend yields and expected stock returns. Journal of Financial Economics 22 (1), 3–25.
Garrett, T.A., Sobel, R.S., 1999. Gamblers favor skewness, not risk: Further evidence from United States' lottery games. Economics Letters 63 (1), 85–90.
Golec, J., Tamarkin, M., 1998. Bettors love skewness, not risk, at the horse track. Journal of Political Economy 106 (1), 205–225.
Granger, C.W.J., 1969. Investigating causal relations by econometric models and cross- spectral methods. Econometrica 37 (3), 424–438.
Guillén, M., Tschoegl, A.E., 2002. Banking on gambling: Banks and lottery-linked deposit accounts. Journal of Financial Services Research 21 (3), 219–231.
La Porta, R., 1996. Expectations and the cross-section of stock returns. The Journal of Finance 51 (5), 1715–1742.
La Porta, R., Lakonishok, J., Shleifer, A., Vishny, R.W., 1997. Good news for value stocks:
Further evidence on market efficiency. The Journal of Finance 52 (2), 859–874.
14
Lakonishok, J., Shleifer, A., Vishny, R.W., 1994. Contrarian investment, extrapolation, and risk. The Journal of Finance 49 (5), 1541–1578.
Lintner, J., Glauber, R., 1967. Higgledy piggledy growth in America reprinted in James Lorie and Richard Brealey, eds. Modern Developments in Investment Management (Dryden Press, Hinsdale, IL).
Little, I.M.D., 1962. Higgledy piggledy growth. Bulletin of the Oxford University Institute of Economics 24 (4), 387–412.
Little, I.M.D., Rayner, A.C., 1966. Higgledy piggledy growth again. Basil Blackwell, Oxford.
Pfiffelmann, M., 2008. Why expected utility theory cannot explain the popularity of lottery- linked deposit accounts? ICFAI Journal of Behavioral Finance 5 (2), 6–24.
Pratt, J.W., 1964. Risk aversion in the small and in the large. Econometrica 32 (1/2), 122–136.
Tversky, A., Kahneman, D., 1992. Advances in prospect theory: Cumulative representation of uncertainty. Journal of Risk and Uncertainty 5, 297–323.
15
2. Does the persistence in sales growth rates have predictive power?
(with Sebastian Lobe) ACATIS Value Prize 2013
Presented at Campus for Finance - Research Conference 2013, WHU Vallendar, January 16-17, 2013
Abstract
Chan, Karceski, and Lakonishok (2003) report that there is some persistence in sales growth rates in the United States. First, we establish that this also holds around the world. Second, we corroborate that investors strongly reward high persistence in sales growth. This suggests that investors tend to overestimate this indicator as a predictor of future profit growth rates. Third, we find evidence that the higher the persistence in sales growth, the more the persistence gets lost in the translation into income growth. Our study issues a warning not to overestimate the predictive power of a high persistence in sales growth.
Keywords: sales growth rates, persistence, prediction
16 2.1. Introduction
Stocks that have had a long record of superior past growth rates tend to receive rich valuations. However, most of them are not able to live up to these high expectations, and their valuations return to the mean. A prominent interpretation of this effect is offered by both De Bondt and Thaler (1985, 1987) and Lakonishok et al. (1994). They argue that investor overreaction to past firm performance is the main reason why simple value strategies based on valuation ratios (such as book-to-market) surpass growth strategies. Lakonishok et al. (1994) argue that when forecasting future earnings, investors extrapolate past growth too far into the future.1 Contradicting this strong belief among investors research shows that there is no persistence in long-term earnings growth beyond chance. In their seminal United States (US) based study, Chan et al. (2003) (CKL) reaffirm this notion and forcefully caution against extrapolating past success in income growth into the future. However, they do find some persistence in sales growth. In the following, we call this phenomenon an “increased” or
“high” persistence. In other words, more firms than expected under the hypothesis of independence are able to maintain above-median sales growth rates for many consecutive years. This finding prompts the question, what are the implications on growth rates of operating and net income? In the present study, we expand the work of CKL and perform a profound analysis on this topic. We investigate the hypothesis that investors overestimate the predictive power of an increased persistence in sales growth. More specifically, these investors overestimate its translation into consistently high income growth rates. To our knowledge, this article is the first to present empirical evidence on the persistence in sales growth around the world and on its relationship to persistence in income growth. Our results
1 In sports, a similar phenomenon is known as the belief in “hot hands” (Camerer, 1989). Hendricks et al. (1993) analyze the hot hands effect in mutual fund performance.
17
should be important to investors as well as analysts in order to avoid being deceived by an alleged useful predictor.
Our sample comprises data from more than 54,000 firms from 77 countries and over a sample period of 28 years. To allow sound comparisons across heterogeneous sets of firms and performance indicators, we develop an innovative measure called the weighted frequencies- score. The indicator is based on the run-test, a nonparametric test for serial correlation, applied by CKL. The weighted frequencies-score further expands upon the original run-test by generating a single measure of persistence in growth. Using this method, we analyze consistency in growth of sales, operating income, and net income. In doing so, we split our sample according to country and industry affiliation, firm size, market valuation, and leverage. In a final analysis, we investigate the hypothesis that firms try to “buy” a high persistence in sales growth at the cost of increasing operating expenses.
Our main findings are as follows. Indicating potential overestimation, we observe that investors strongly reward runs and thus a high persistence in sales growth. In line with the existing US evidence, we find that an increased persistence in sales growth is a global phenomenon. Our results reveal that the higher the persistence in sales growth, the more persistence is lost in the translation into income growth rates. Supporting our hypothesis that firms may trade persistence in income growth for a high persistence in sales growth, we find that the loss of persistence in sales growth is strongly correlated with a high persistence in operating expense growth rates. In total, our study issues a warning not to overestimate a high persistence in sales growth as a strong predictor of future profit growth rates.
The rest of the paper is organized as follows. Section 2.2 reviews the related literature.
Section 2.3 discusses our sample and the methodology. Section 2.4 examines how investors evaluate past sales growth in their company valuations. Section 2.5 studies the translation of
18
persistence in sales growth across a number of subsets of firms. Section 2.6 investigates operating expenses in this context. Section 2.7 concludes the report.
2.2. Literature review
The literature regarding expectations about future growth rates is related to research on why value stocks outperform growth stocks. One possible explanation for this anomaly is investor overreaction. In their research, De Bondt and Thaler (1987, 1990) analyze returns of stocks that have experienced either extreme capital gains or extreme losses. Referring to Kahneman and Tversky (1973), who report that people have a tendency to overweight salient information (such as recent news), they argue that this trend might be explained by biased expectations of the future. De Bondt and Thaler (1990) and Chopra et al. (1992) conduct further analyses that corroborate these findings. Lakonishok et al. (1994) argue that investors tend to extrapolate past growth rates too far into the future. A paper by Barberis et al. (1998) formalizes the same general idea. La Porta (1996) conducts further analyses and argues that analysts and investors rely too heavily on past growth in their forecasts and valuations. La Porta et al. (1997) examine the hypothesis that the superior return to value stocks is the result of expectational errors made by investors. They find that investors may incorrectly assume that there is a significant degree of consistency in growth, so they extrapolate glamour stocks’ past superior growth rates (and value stocks’ past disappointing growth rates) too far into the future.
Our study is also related to the rather slim literature on the behavior of earnings growth. Early evidence for the United Kingdom (UK) is provided by Little (1962) and Little and Rayner (1966). They find that corporate annual earnings numbers essentially follow random processes and therefore challenge the assumption that a firm's past growth performance is a good predictor of its future growth. In line with these conclusions, Lintner and Glauber (1967) and Brealey (1983) provide evidence for the US and confirm that changes in earnings over time appear to be randomly distributed. Based on these findings, many further studies
19
investigate earnings predictability by applying time-series models (e.g., Beaver, 1970; Ball and Watts, 1972; Albrecht et al., 1977). However, these studies only focus on short-term forecasting.
One of the few recent studies on persistence in operating performance growth rates is the seminal paper by CKL. They convincingly show that there is no persistence in net income growth rates. Despite this fact, they do identify some persistence in sales growth rates. They suppose that a shrinking profit margin is the reason why growth in sales shows more persistence than growth in profits, but they do not investigate this relationship in detail.
2.3. Data and methodology
2.3.1. Data
Our study is based on a large international sample. The data used are obtained from Thomson Datastream and Worldscope. The sample period runs from 1980 to 2008, as no firm accounting data are available before 1980. The start dates vary across countries and firms because of data availability. First, we select all active and inactive equities recorded in the database. Following CKL, we do not exclude any kind of firms.2 We then control for multiple collections of the same company, data errors, and missing data. Time-series of inactive firms are included in the dataset during their time of existence. Our initial sample comprises a total of 54,176 firms in 77 countries. At the end of each calendar year, we collect net sales or revenues, operating income, and net income before extraordinary items/preferred dividends for each firm in local currencies.3
At the end of each calendar year, we calculate growth in operating performance as follows,
2 We do not include American depositary receipts (ADRs) and closed-end funds. CKL do not describe their procedure in this context.
3 Worldscope items WC01001, WC01250, and WC01551.
20
, −1, = , − , −1 1 + ,
, −1 (2.1) where g is the growth rate of firm i over the period of time t-1 to the sample selection year t.
PI denotes the operating performance indicator. Following CKL, we assume that the dividends are reinvested, taking into account different dividend payout policies. We measure growth on a per-share basis and assume that an investor would typically buy and hold shares over a specific period. The number of shares outstanding is adjusted to reflect stock splits and dividends.
In cases where earnings in the base year are negative, growth rates cannot be calculated, so the number of eligible growth rates would be reduced. We therefore also apply the substitution method described in CKL (see page 653). To ensure a robust data basis for comparisons, we drop all countries with an insufficient number of eligible sales growth rates over the entire sample period. Our final sample encompasses 53,435 firms in 48 countries, of which 32,300 exist at the end of our sample period in 2008. In total, the sample includes 531,091 firm-years, with 31.4% of these attributed to US firms. Firms in Japan and the UK account for 12.9% and 7.3% of all firm-year observations, respectively. The remaining 45 countries typically account for less than five percent of the total observations.
2.3.2. Methodology
Our approach is based on the run-test design applied by CKL. First, the median of all eligible growth rates is calculated at every calendar year’s end. We then determine how many consecutive years a company is able to beat the median. This row is called the run. Finally, we calculate the percentage of firms with runs in relation to all the firms that survive for the same period of time. Extending the analysis of CKL, our goal is to measure the degree of persistence in growth. We therefore refer to percentages that are higher than we expect under
21
the hypothesis of independence as an “increased” persistence in growth. To ensure best comparability across sets of firms, we also need to consider some further issues.
2.3.2.1. Nonsurviving firms
When comparing sets of firms, nonsurviving firms may bias our conclusions. The fewer firms survive, the higher the percentage of firms with runs. For instance, consider two groups A and B with 100 eligible firms (e.g. two countries) in the sample selection year. In Group A, three firms have a run for five consecutive years, and all firms survive for the same period of time.
We report that 3% of all valid firms have a five-year run. In Group B, three firms have a run for five consecutive years, but now only 90 firms survive for the same period of time.
Therefore, we report that 3.33% of all valid firms have a five-year run. It would appear that persistence in growth is higher in Group B than in Group A. In fact, some firms with a particularly poor performance lead to this erroneous conclusion.
2.3.2.2. Comparing run lengths
The run-test produces a combination of percentages, which is difficult to compare with others.
Simply adding up the obtained numbers would neglect the fact that a very long run is much more difficult to achieve than a short run.
2.3.2.3. Discrepancy between the groups
Our approach requires two groups of firms. The first group is tested for runs, and the second one provides the basis for median calculation. Typically, the second group would comprise all firms within a country. At sample selection, these groups usually are identical. Without filtering, over time, Group 1 shrinks due to nonsurviving firms. In contrast, Group 2 gains size as each year new firms are added because of new foundations or simply due to improvements in data availability. The longer the test period, the larger the discrepancy. This
22
finding leads to the problem that it becomes impossible to state precise expected probabilities of beating the median for a number of years.
2.3.2.4. The weighted frequencies-score
To control for these issues, we develop a modified run-test design that we call the “weighted frequencies-score” (wf-score). Limiting our analysis to a rolling five-year horizon reduces the problem of low data availability over long periods of time. At the end of every calendar year, we select all firms that survive for the next five years. We then calculate the median growth rate of this set of firms for each of the next five years after the sample selection. The medians are determined separately for each country in order to avoid biased comparisons due to generally different levels of growth rates. This approach also eliminates the issue of varying inflation rates and accounting conventions across countries. Based on these medians, we determine the percentage of firms with above-median growth rates for a number of consecutive years with respect to the total number of firms in the group and can now accurately determine the percentages expected under the hypothesis of independence. By definition, 50% of all firms have an above-median growth rate in the sample selection year, 25% are expected to have a run for two years, and so on. To factor in the length of the run, we multiply the actual frequency of firms with the inverse of the expected frequency. For instance, if the expected frequency of a four-year run is 6.25%, the weighting factor would be 16. In the final step, we sum up the weighted frequencies to obtain a single, comparable measure of persistence in growth rates. The resulting formula is as follows,
, , = , , ,
, , × 1
0.5
5
=1
(2.2)
where wf is the weighted frequencies-score, t specifies the sample selection year, c is the group of firms that survive for five years after sample selection, and PI denotes the
23
performance indicator. The run length in years is denoted by l; n is the number of firms with a run length l, and N is the total number of firms in group c. If the distribution of above-median growth rates is totally random, the wf-score will be 0.5×2+0.25×4+0.125×8+
0.0625×16+0.0313×32=5.00. Values above 5.00 suggest persistence beyond pure chance (“increased persistence”) and quantify the scale. Values below 5.00 suggest the opposite. The theoretically highest possible wf-score is 31, which would suggest that all firms with above- median growth rates in the first year had a run for five consecutive years. The lowest possible value is 1, indicating that no firm has a run for more than one year.
The focus of our study is to relate persistence in sales growth to other performance indicators.
As a measure we use wf-delta which is the difference between the wf-score of income growth and the wf-score of sales growth. Negative values suggest that there is more persistence in sales growth than persistence in income growth. Positive values indicate the opposite.
2.4. Investor appreciation of persistence in sales growth
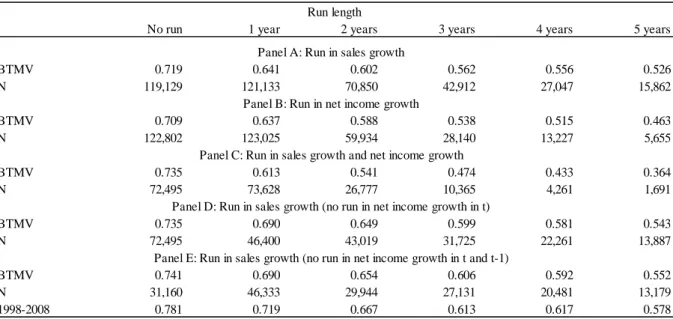
We begin our study by examining how market valuations are affected by high persistence in growth, especially sales growth. At every calendar year’s end, we determine for each firm the length of the current run in both sales growth and net income growth. If a firm has a run, a figure between one (year) and five (years) is assigned. If a firm does not beat the median growth rate, a zero is assigned. We measure the valuation of a company based on its book-to- market ratio (Datastream item MTBV). Table 2.1 shows the results across all firms and the entire sample period. Panel A analyzes the median book-to-market ratio of firms with runs in sales growth. Panel B performs the same analysis with net income growth.
The results clearly indicate that firm valuations become richer with increasing run length. In Panel C, we assume that a firm enjoys a run in both performance indicators at the same time.
The ratios suggest that investors not only reward past growth of the bottom line but also of the top line. We next try to isolate how investors appreciate sole persistence in sales growth.
24
Panel D reports the median book-to-market ratios assuming that a firm has a run in sales growth but no above-median net income growth rate in the current year. Valuations continue to increase with the run length. Panel E tightens the analysis. Firms now have a run in sales growth but no above-median growth in the current and the past year. As is intuitively expected, the overall valuation level is slightly lower than in Panel D but still increases with the length of the sales run. The results also apply to the final ten-year period from 1998 to 2008.
These findings suggest that investors give weight to persistence in past sales growth. The return of an investment, however, primarily depends on net income. If an increased persistence in sales growth does not translate into an increased persistence in income growth, investors are at risk of overestimating an impressive track record of past sales growth rates.
2.5. Relationship between persistence in sales growth and persistence in income growth We commence with an analysis across the entire sample and sample period. Table 2.2 reports wf-scores measuring the persistence in growth of sales, operating income, and net income.
Consistent with the US results by CKL, we confirm that there is an increased persistence in sales growth. The wf-score of 7.42 surpasses the expected 5.00 under the hypothesis of independence. However, as CKL argue, this persistence vanishes as we get closer to the bottom line. The wf-scores of operating income and net income are only 4.95 and 4.51, respectively. In fact, the probability to achieve a run is slightly lower than we would expect under the hypothesis of independence. To ensure that our results are significantly different from the expected frequencies, we perform chi-square tests to determine the equality of the distributions. We reject the null hypothesis of independence for growth in sales and net income at the 1% level. The persistence of operating income is not significantly different from pure chance. These first results suggest that in general, an increased persistence in sales growth does not translate into persistent high income growth rates.
25
To exclude the possibility that sales growth actually has become a more accurate predictor over the past decades, we calculate the wf-score for each sample selection year beginning with 1981. The last full five-year period starts in 2004. Table 2.3 presents the wf-scores for every performance indicator over the time periods from 1981 to 2004, 1981 to 1988, 1989 to 1996, and 1997 to 2004.
The results suggest that within 28 years, persistence in sales growth has further increased. In 2004, the wf-score amounts to 8.06. Persistence in net income growth, however, does not follow this trend. It remains relatively stable with a slightly decreasing tendency. In 2004, the wf-score amounts to 4.80. Panel D reports wf-deltas of operating income and sales (OI-S) as well as net income and sales (NI-S). These findings suggest that the persistence of growth diverges over time. The wf-delta between net income and sales increases from -1.92 (1981 to 1988) to -2.56 (1989 to 1996) and finally to -3.31 (1997 to 2004). The same applies to operating income and sales. The results indicate that although persistence in sales growth constantly increases, it is still a weak predictor for persistence in income growth. One possible explanation for this trend is that firms manage their sales growth rates at the cost of income growth.
2.5.1. Analyzing subsets of firms
We hypothesize that even a high persistence in sales growth would provide little information about the corresponding persistence in income growth. Subsets of firms will help us to test this hypothesis.
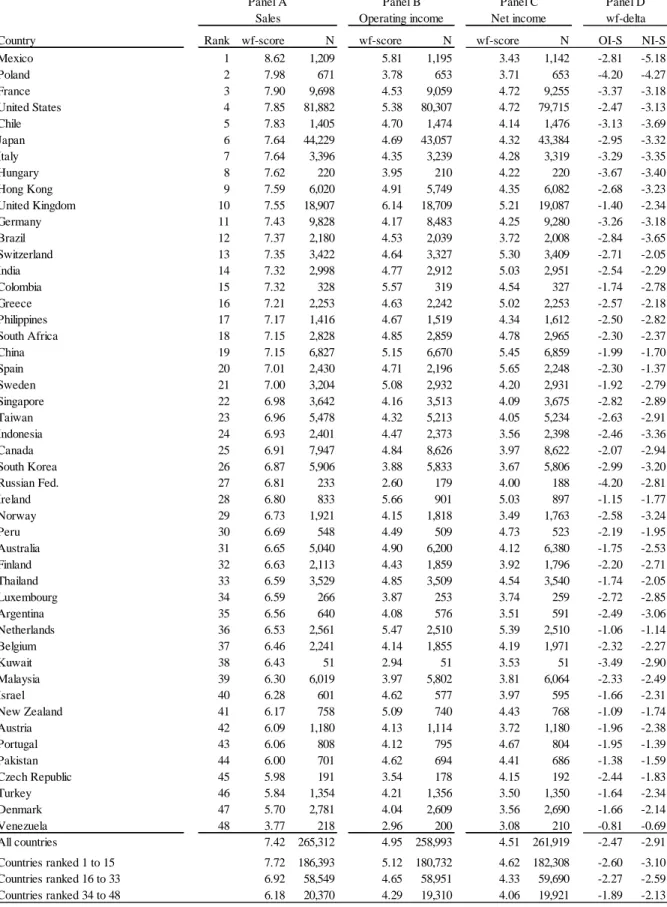
2.5.1.1. Subset 1: Divided by country
Given the variety of country-specific factors such as the legal system and the extent of investor protection (e.g., Demirgüç-Kunt and Maksimovic, 1998; La Porta et al., 2002;
Brockman and Chung, 2003; Beck et al., 2005), it seems likely that persistence is not exactly
26
equal anywhere around the world. Table 2.4 reports the wf-scores for each country in our sample over the entire sample period. We sort the countries in descending order by their wf- score in sales. As expected, there is an increased persistence in sales growth in almost every country. Mexico, Poland, and France are ranked highest with wf-scores of 8.62, 7.98, and 7.90. In contrast, Turkey, Denmark, and Venezuela only reach scores of 5.84, 5.70, and 3.77.
In line with our hypothesis, there seems to be no clear-cut correlation between persistence in sales growth and persistence in income growth. To quantify the link, in Panel D, we calculate the wf-deltas of operating income and sales (OI-S) as well as net income and sales (NI-S).
The results indicate that the wf-deltas tend to rise as persistence in sales growth increases. The countries ranked 1 to 15 have an average wf-delta score of -3.10 compared to persistence in net income. The countries ranked 16 to 33 average -2.59, and those ranked 34 to 48 only average -2.13. We find the same pattern when we compare sales and operating income.
Apparently, the translation into net income growth becomes weaker as persistence in sales growth increases.
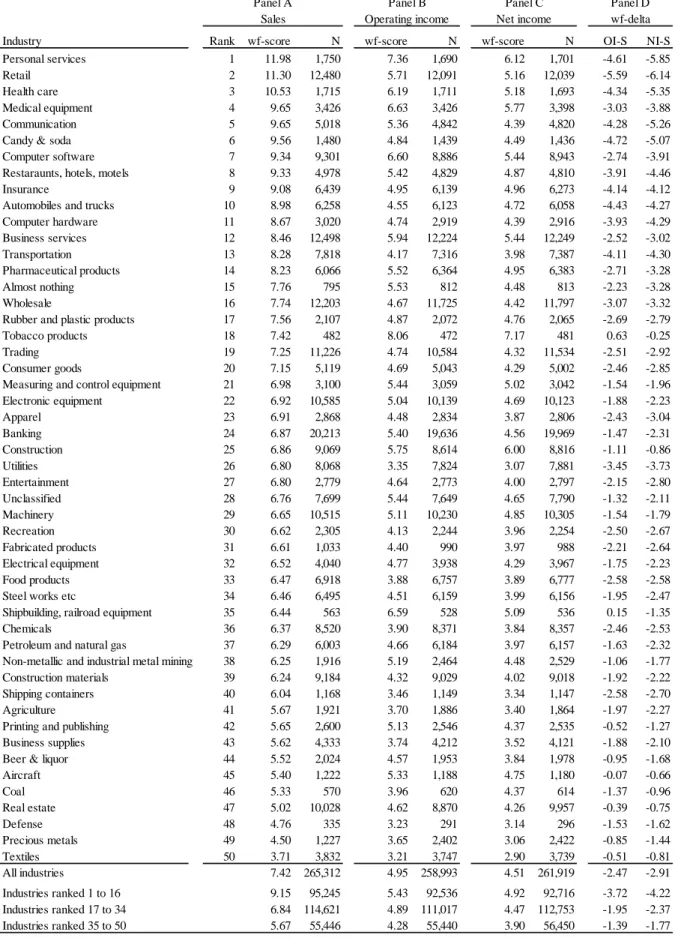
2.5.1.2. Subset 2: Divided by industry
As industries differ in many aspects, such as their sensitivity to business cycles, intensity of competition, and firm financial structure (MacKay and Phillips, 2005), persistence in growth is worth analyzing. The analysis is similar to the previous one, but now we classify firms by their industry affiliations instead of their country affiliations. The median growth rates are still calculated with respect to the individual countries. For industry classifications, we obtain four-digit standard industrial classification (SIC) codes from Worldscope. The industry classification follows Fama and French (1997) distinguishing between 49 industry categories.
Firms that do not fit into one of them are labeled as “unclassified.” Table 2.5 presents these results. Again, the list is sorted in descending order by the wf-score in sales.
27
We find considerable variation across industries. The “Personal Services” (11.98), “Retail”
(11.30), and “Healthcare” (10.53) industries are ranked the highest. Consistent with the results of the previous section, we again find that the higher the persistence in sales growth, the less it translates into persistence of income growth. The industries ranked 1 to 15 exhibit a wf- delta (weighted mean) with respect to net income of -4.22. In contrast, the industries ranked 16 to 34 and 35 to 50 only amount to -2.37 and -1.77, respectively. The correlation becomes particularly obvious when considering the top three industries in Panel A. For instance, the
“Retail” industry reaches a wf-delta score (NI-S) of -6.14. As a robustness test, we redo the analysis (results not reported) and calculate the median growth rates using industry categories instead of countries. The conclusions are the same.
2.5.1.3. Subset 3: Divided by firm size
Since industries are strongly distinguished from each other in terms of average firm size, we explore how firms of different sizes translate persistence in growth. It is well known that firm size is related to the firm's profitability, productivity, and survival (e.g., Zarowin, 1989;
Zarowin, 1990; Beck et al., 2008). We calculate the wf-scores and wf-deltas for large, mid- capitalization, and small firms over the entire sample period. Large firms are ranked in the top two deciles of market capitalization (in US dollars) as of the end of the sample selection year, while small firms fall into the bottom two deciles. Mid-capitalization firms cover all the remaining companies. Size decile breakpoints are computed separately from the entire universe of firms domiciled in the respective country. Panel A in Table 2.6 summarizes the results.
We find that persistence increases with firm size. Large firms have a wf-score (weighted mean) in sales of 9.71, while mid-capitalization firms have a score of 7.42; small firms exhibit only an average score of 4.36. These findings once more support our hypothesis. The higher the persistence in sales growth, the less it translates into persistence of income growth.
28
According to Table 2.6, large firms have a wf-delta of -4.32 (OI-S) and -4.84 (NI-S). In contrast, the corresponding scores of small firms are positive and average 0.50 (OI-S) and 0.06 (NI-S). In this case, persistence in operating income growth slightly exceeds that in sales growth. By computing the size classification each year, the group of large firms includes more and more past winners. As a check for robustness, we perform the same analysis (results not reported) with fixed size classifications based on the first available firm year. Our conclusions are still the same.
2.5.1.4. Subset 4: Divided by firm valuation
The widespread overestimation of persistence in growth among investors particularly manifests in the existence of value and glamour stocks. Considering the existing evidence (Lakonishok et al., 1994; La Porta et al., 1997) and our findings so far, we expect that glamour stocks would exhibit a relatively high persistence in sales growth, which potentially attracts investors. The translation into consistently high income growth rates, however, is probably weak as research shows that returns of glamour stocks underperform those of value stocks (e.g., Basu, 1977; Jaffe et al., 1989; Chan et al., 1991). In contrast, value stocks may have a relatively low persistence in sales growth but a rather good translation into income growth.
At the end of every calendar year, we split all firms into three distinct groups. Glamour firms are ranked in the bottom three deciles by their book-to-market ratio. The group of value firms comprises firms that are ranked in the top three deciles. The remaining firms are labeled as moderate valuation firms. The decile breakpoints are computed separately for each country to take into account international differences in market valuations. Panel B of Table 2.6 presents the respective wf-scores and wf-deltas. In line with our expectations, the results confirm that the growth rates of glamour firms are more persistent than those of value firms. However, as is observed in the previous subsets of firms, this persistence has a considerably worse
29
translation. The wf-score (weighted mean) of 10.01 for sales translates into 5.84 for net income, which equals a difference of -4.17. Value firms have a wf-score of 5.18 for sales and 3.53 for net income, which equals a wf-delta of only -1.65.
2.5.1.5. Subset 5: Divided by leverage
The last subset of firms we analyze focuses on the capital structure. According to the pecking order model of financing decisions (Myers, 1984), firms first fund projects out of retained earnings. Since profitable firms generate cash internally, in theory, more profitable firms are supposed to be less leveraged (e.g., Shyam-Sunder and Myers, 1999; Fama and French, 2002). We therefore expect that less-leveraged firms generally would have an increased persistence in sales growth. As a proxy for the debt level of a firm, we use the “debt-to-total- assets ratio” (Remmers et al., 1974) obtained from Worldscope (item WC08236).4 Following Fama and French (2002), we exclude financial firms (SIC codes 6000 to 6999) because financial intermediaries seem incomparable with other firms in terms of leverage. We also exclude utilities (SIC codes 4900 to 4999) because their capital structure may be influenced by regulation. At the end of every calendar year, we assign each firm to one of three groups.
Low leverage firms include firms in the bottom two deciles by their debt-to-total-assets ratios.
Median leverage firms comprise stocks ranked in the third through the seventh deciles, and high leverage firms cover firms ranked in the top two deciles. Leverage strongly varies across industries, so decile breakpoints are based on the universe of all firms in one particular industry. This approach additionally ensures that each set of firms include companies from all industries. The median growth rates are still calculated on a country basis. Results are presented in Panel C of Table 2.6 and reveal that persistence of sales growth indeed increases with decreasing leverage. Low leverage firms have a wf-score (weighted mean) in sales of 9.30 across the entire sample period. The corresponding scores of median and high leverage
4 To control for outliers, we trim the data at the 99th percentile.
30
firms amount to 7.78 and 5.43, respectively. Analyzing the wf-deltas once more corroborates our previous conclusions.
2.5.2. Robustness test: Firms with a very high persistence in sales growth
In this section, we test for the robustness of our previous results by using as general of an approach as possible. In Panel A of Table 2.7, we construct two strikingly different sets of firms. The first group (Group A1) encompasses only firms with at least one five-year run in sales growth within their time of survival. The second group (Group A2) contains all the remaining firms. These firms do not have a single run in sales growth for more than four years at any given time.
As expected, due to the rigorous selection criteria, the persistence in sales growth of Group A1 is the highest observed in this study. The wf-score of sales amounts to 18.53. Despite this fact, the wf-scores of operating income and net income are only 7.35 and 6.36, respectively.
This means that the conversion from persistence in sales growth into persistence in income growth is also the weakest in this study. The wf-deltas amount to -11.18 (OI-S) and -12.17 (NI-S). As expected, the translation is very different when analyzing the results of Group A2.
Here, persistence in income growth even exceeds the very low persistence in sales growth (wf-score: 2.68). The wf-delta of operating income and sales is 1.25. With respect to net income and sales, it is 1.05. Obviously, there is a fair amount of firms with long runs in income growth but with shorter or even no runs in sales growth. In Panel B of Table 2.7, we relax the criteria and compare firms with at least one run for four years (Group B1) to firms without a single run for more than three years at any time (Group B2). The results are consistent with those in Panel A. As expected, the wf-scores and wf-deltas of Group B1 are now generally smaller than those of Group A1.
31
2.6. Relationship between operating expenses and persistence in sales growth
There are a number of conceivable explanations for why persistence in sales growth vanishes on the way to the bottom line. CKL presume that a shrinking profit margin is the reason why growth in sales shows more persistence than growth in profits. Aghion and Stein (2008) argue that firms have to decide whether to focus their efforts either on increasing sales growth or on improving profit margins. Since managerial time and other resources are limited, firms face a strategic tradeoff between these objectives and therefore are confronted with essentially a multitasking problem (e.g., Holmstrom and Milgrom, 1991). Another reason may be that managers know the investors' preferences and actively cater to them. For example, Hong et al.
(2003, 2007) examine analyst reports on Amazon.com over the period from 1997 to 2002 and illustrate that analysts initially almost exclusively focused on its long-run revenue potential, while profit margins were virtually neglected.
Our previous findings give reason to believe that managers may trade income growth for momentum in sales growth because they assume that the stock market focuses on growth in sales rather than profit margins. In a last step, we investigate the hypothesis that a high persistence in sales growth is largely consumed by high operating expense growth rates. This process eventually leads to a slightly increased persistence in income growth at best. We focus on the two major items of operating expenses: “cost of goods sold” (CGS) and “selling, general, and administrative expenses” (SGAE).5 Due to low data availability for all countries except the US, we do not analyze research and development expenses. Table 2.8 lists all subsets of firms previously studied along with the respective wf-deltas based on operating income and sales. The list is sorted from the largest to the smallest loss of persistence in sales.
For each subset of firms, we calculate the wf-scores for CGS and SGAE. This approach is the same as the one used for sales, operating income, and net income.
5 Worldscope items WC01051 and WC01101.
32
Our results clearly indicate a strong correlation. The group of firms with at least one five-year run in sales growth has the highest wf-delta amounting to -11.18 (OI-S). Interestingly, this group also has the highest persistence in growth rates of CGS (14.82) and SGAE (13.09). To establish a quantitative relationship for all subsets of firms, we calculate Pearson correlation coefficients. Based on the wf-deltas and the wf-scores of CGS, we obtain a correlation coefficient of -99%. The respective result based on the wf-scores of SGAE amounts to -95%.
Both correlations are significant at the 1% level. Added together, the results from Table 2.8 suggest two conclusions. First, the higher the loss of persistence in sales growth, the higher the persistence in operating expenses. Second, firms with a low persistence in sales growth tend to enjoy a better-than-expected persistence in operating income growth, since their growth rates in operating expenses are generally lower.
2.7. Conclusion
In this paper, we shed further light on the persistence of growth rates in operating performance as an overestimated predictor for long-term future growth rates. In a first step, we establish that investors do pay a great deal of attention to past consistency in sales growth rates in their company valuations. We therefore focus on the question of how the frequently observed increased persistence in sales growth translates into persistence in income growth.
For this purpose, we require an indicator that allows us to consistently quantify persistence in growth rates and to perform meaningful comparisons. We therefore adopt the run-test approach applied by Chan et al. (2003) and develop a measure called the weighted frequencies-score. It analyzes above-median annual growth rates in the operating performance of firms that survive for at least five years and additionally factors in how long a firm outperforms the market. Using this method, we calculate persistence in growth rates for a variety of subsets of firms.
33
Our results expand the US evidence reported by Chan et al. (2003) and confirm that around the world, sales growth usually has an increased persistence. We also show that this persistence varies remarkably depending on factors like country or industry affiliation, firm size, and market valuation. Our results, however, also provide evidence that the higher the persistence in sales growth, the more persistence gets lost after the translation into income growth. We hypothesize that many firms place great emphasis on a high persistence in sales growth rates and try to “buy” this success. We also examine how the loss of persistence in sales growth is related to persistence in expense growth and find a strong correlation supporting our assumption. Taken together, our study issues a warning to investors and analysts not to overestimate long-term future profit growth, even if a firm has a remarkably high persistence in sales growth.
34 References
Aghion, P., Stein, J.C., 2008. Growth versus margins: Destabilizing consequences of giving the stock market what it wants. The Journal of Finance 63 (3), 1025–1058.
Albrecht, W.S., Lookabill, L.L., McKeown, J.C., 1977. The time-series properties of annual earnings. Journal of Accounting Research 15 (2), 226–244.
Ball, R., Watts, R., 1972. Some time-series properties of accounting income. The Journal of Finance 27 (3), 663–682.
Barberis, N., Shleifer, A., Vishny, R.W., 1998. A model of investor sentiment. Journal of Financial Economics 49 (3), 307–343.
Basu, S., 1977. Investment performance of common stocks in relation to their price-earnings ratios: A test of the efficient market hypothesis. The Journal of Finance 32 (3), 663–682.
Beaver, W.H., 1970. The time series behavior of earnings. Journal of Accounting Research 8 (suppl.), 62–99.
Beck, T., Demirgüç-Kunt, A., Laeven, L., Levine, R., 2008. Finance, firm size, and growth.
Journal of Money, Credit and Banking 40 (7), 1379–1405.
Beck, T., Demirgüç-Kunt, A., Maksimovic, V., 2005. Financial and legal constraints to growth: Does firm size matter? The Journal of Finance 60 (1), 137–177.
Brealey, R.A., 1983. An introduction to risk and return from common stocks. MIT Press Cambridge, MA.
Brockman, P., Chung, D.Y., 2003. Investor protection and firm liquidity. The Journal of Finance 58 (2), 921–937.
Camerer, C.F., 1989. Does the basketball market believe in the "hot hand"? The American Economic Review 79 (5), 1257–1261.
Chan, L.K.C., Hamao, Y., Lakonishok, J., 1991. Fundamentals and stock returns in Japan.
The Journal of Finance 46 (5), 1739–1764.
35
Chan, L.K.C., Karceski, J., Lakonishok, J., 2003. The level and persistence of growth rates.
The Journal of Finance 58 (2), 643–684.
Chopra, N., Lakonishok, J., Ritter, J.R., 1992. Measuring abnormal performance: Do stocks overreact? Journal of Financial Economics 31 (2), 235–268.
De Bondt, W.F.M., Thaler, R.H., 1985. Does the stock market overreact? The Journal of Finance 40 (3), 793–805.
De Bondt, W.F.M., Thaler, R.H., 1987. Further evidence on investor overreaction and stock market seasonality. The Journal of Finance 42 (3), 557–581.
De Bondt, W.F.M., Thaler, R.H., 1990. Do security analysts overreact? The American Economic Review 80 (2), 52–57.
Demirgüç-Kunt, A., Maksimovic, V., 1998. Law, finance, and firm growth. The Journal of Finance 53 (6), 2107–2137.
Fama, E.F., French, K.R., 1997. Industry costs of equity. Journal of Financial Economics 43 (2), 153–193.
Fama, E.F., French, K.R., 2002. Testing trade-off and pecking order predictions about dividends and debt. The Review of Financial Studies 15 (1), 1–33.
Hendricks, D., Patel, J., Zeckhauser, R., 1993. Hot hands in mutual funds: Short-run persistence of relative performance, 1974-1988. The Journal of Finance 48 (1), 93–130.
Holmstrom, B., Milgrom, P., 1991. Multitask principal-agent analyses: Incentive contracts, asset ownership, and job design. Journal of Law, Economics, & Organization 7 (0), 24–52.
Hong, H., Stein, J.C., Yu, J., 2003. Simple forecasts and paradigm shifts. NBER Working Paper 10013.
Hong, H., Stein, J.C., Yu, J., 2007. Simple forecasts and paradigm shifts. The Journal of Finance 62 (3), 1207–1242.
36
Jaffe, J., Keim, D.B., Westerfield, R., 1989. Earnings yields, market values, and stock returns.
The Journal of Finance 44 (1), 135–148.
Kahneman, D., Tversky, A., 1973. On the psychology of prediction. Psychological Review 80 (4), 237–251.
La Porta, R., 1996. Expectations and the cross-section of stock returns. The Journal of Finance 51 (5), 1715–1742.
La Porta, R., Lakonishok, J., Shleifer, A., Vishny, R.W., 1997. Good news for value stocks:
Further evidence on market efficiency. The Journal of Finance 52 (2), 859–874.
La Porta, R., Lopez-de-Silanes, F., Shleifer, A., Vishny, R.W., 2002. Investor protection and corporate valuation. Journal of Finance 57 (3), 1147–1170.
Lakonishok, J., Shleifer, A., Vishny, R.W., 1994. Contrarian investment, extrapolation, and risk. The Journal of Finance 49 (5), 1541–1578.
Lintner, J., Glauber, R., 1967. Higgledy piggledy growth in America reprinted in James Lorie and Richard Brealey, eds. Modern Developments in Investment Management (Dryden Press, Hinsdale, IL).
Little, I.M.D., 1962. Higgledy piggledy growth. Bulletin of the Oxford University Institute of Economics 24 (4), 387–412.
Little, I.M.D., Rayner, A.C., 1966. Higgledy piggledy growth again. Basil Blackwell, Oxford.
MacKay, P., Phillips, G.M., 2005. How does industry affect firm financial structure. The Review of Financial Studies 18 (4), 1433–1466.
Myers, S.C., 1984. The capital structure puzzle. The Journal of Finance 39 (3), 575–592.
Remmers, L., Stonehill, A., Wright, R., Beekhuisen, T., 1974. Industry and size as debt ratio determinants in manufacturing internationally. Financial Management 3 (2), 24–32.
Shyam-Sunder, L., Myers, S.C., 1999. Testing static tradeoff against pecking order models of capital structure. Journal of Financial Economics 51 (2), 219–244.
37
Zarowin, P., 1989. Does the stock market overreact to corporate earnings information? The Journal of Finance 44 (5), 1385–1399.
Zarowin, P., 1990. Size, seasonality, and stock market overreaction. The Journal of Financial and Quantitative Analysis 25 (1), 113–125.
38
Table 2.1: Market valuation of persistence in sales growth and net income growth.
This table analyzes how investors reward persistence in sales growth in their firm valuations. The table reports median book- to-market ratios (BTMV) and available firm-years (N) dependent on the current run length in sales growth and net income growth. Statistics are provided for all firms and the entire sample period from 1980 to 2008.
Table 2.2: Persistence in growth across the entire sample.
This table analyzes persistence in growth across the entire sample of firms. To factor in the length of the run, the actual frequencies of firms with runs are multiplied with weighting factors (WFA) which are the inverse of the expected frequencies. The wf-score is the sum of the weighted frequencies. A wf-score of 5.00 indicates that persistence in growth is randomly distributed. Values above 5.00 indicate and quantify an increased persistence in growth.
No run 1 year 2 years 3 years 4 years 5 years
Panel A: Run in sales growth
BTMV 0.719 0.641 0.602 0.562 0.556 0.526
N 119,129 121,133 70,850 42,912 27,047 15,862
Panel B: Run in net income growth
BTMV 0.709 0.637 0.588 0.538 0.515 0.463
N 122,802 123,025 59,934 28,140 13,227 5,655
Panel C: Run in sales growth and net income growth
BTMV 0.735 0.613 0.541 0.474 0.433 0.364
N 72,495 73,628 26,777 10,365 4,261 1,691
Panel D: Run in sales growth (no run in net income growth in t)
BTMV 0.735 0.690 0.649 0.599 0.581 0.543
N 72,495 46,400 43,019 31,725 22,261 13,887
Panel E: Run in sales growth (no run in net income growth in t and t-1)
BTMV 0.741 0.690 0.654 0.606 0.592 0.552
N 31,160 46,333 29,944 27,131 20,481 13,179
1998-2008 0.781 0.719 0.667 0.613 0.617 0.578
Run length
Run length
1 year 2 years 3 years 4 years 5 years wf-score
Expected frequency 50.0% 25.0% 12.5% 6.3% 3.1%
Weighting factor (WFA) 2 4 8 16 32
Panel A: Sales
Valid firm-years 265,312 265,312 265,312 265,312 265,312
Firm-years above median 132,655 75,841 45,240 28,292 18,312
Percent above median 50.0% 28.6% 17.1% 10.7% 6.9%
Weighted frequencies (Percent*WFA) 1.00 1.14 1.36 1.71 2.21 7.42
Panel B: Operating income
Valid firm-years 258,993 258,993 258,993 258,993 258,993
Firm-years above median 129,498 65,124 31,896 15,852 7,932
Percent above median 50.0% 25.1% 12.3% 6.1% 3.1%
Weighted frequencies (Percent*WFA) 1.00 1.01 0.99 0.98 0.98 4.95
Panel C: Net income
Valid firm-years 261,919 261,919 261,919 261,919 261,919
Firm-years above median 130,960 63,084 29,413 13,769 6,598
Percent above median 50.0% 24.1% 11.2% 5.3% 2.5%
Weighted frequencies (Percent*WFA) 1.00 0.96 0.90 0.84 0.81 4.51
39
Table 2.3: Persistence in growth across the sample period.
This table analyzes persistence in growth across the sample period. A wf-score of 5.00 indicates that persistence in growth is randomly distributed. Values above 5.00 indicate and quantify an increased persistence in growth. N denotes the number of available firm-years. Wf-delta is the difference between the wf-scores of operating income and sales (OI-S) as well as net income and sales (NI-S).
Sample
period wf-score N wf-score N wf-score N OI-S NI-S
1981 to 2004 7.42 265,312 4.95 258,993 4.51 261,919 -2.47 -2.91
1981 to 1988 6.83 34,339 4.72 32,077 4.91 32,306 -2.11 -1.92
1989 to 1996 7.41 79,767 5.11 75,711 4.85 77,083 -2.30 -2.56
1997 to 2004 7.56 151,206 4.92 151,205 4.25 152,530 -2.65 -3.31
Panel D
Panel A Panel B Panel C
Sales (S) Operating income (OI) Net income (NI) wf-delta