NBER WORKING PAPER SERIES
UNIVERSITY DIFFERENCES IN THE GRADUATION OF MINORITIES IN STEM FIELDS:
EVIDENCE FROM CALIFORNIA Peter Arcidiacono
Esteban M. Aucejo V. Joseph Hotz Working Paper 18799
http://www.nber.org/papers/w18799
NATIONAL BUREAU OF ECONOMIC RESEARCH 1050 Massachusetts Avenue
Cambridge, MA 02138 February 2013
Partial funding for Arcidiacono came from the Searle Freedom Trust. We thank seminar participants at NYU, Oxford, and the 2012 Brookings conference on The Effects of Racial Preferences on Student Outcomes for helpful comments. The views expressed herein are those of the authors and do not necessarily reflect the views of the National Bureau of Economic Research.
NBER working papers are circulated for discussion and comment purposes. They have not been peer- reviewed or been subject to the review by the NBER Board of Directors that accompanies official NBER publications.
© 2013 by Peter Arcidiacono, Esteban M. Aucejo, and V. Joseph Hotz. All rights reserved. Short sections of text, not to exceed two paragraphs, may be quoted without explicit permission provided that full credit, including © notice, is given to the source.
University Differences in the Graduation of Minorities in STEM Fields: Evidence from California Peter Arcidiacono, Esteban M. Aucejo, and V. Joseph Hotz
NBER Working Paper No. 18799 February 2013
JEL No. I23,J15,J24
ABSTRACT
The low number of college graduates with science degrees -- particularly among under-represented minorities -- is of growing concern. We examine differences across universities in graduating students in different fields. Using student-level data on the University of California system during a period in which racial preferences were in place, we show significant sorting into majors based on academic preparation, with science majors at each campus having on average stronger credentials than their non-science counterparts. Students with relatively weaker academic preparation are significantly more likely to leave the sciences and take longer to graduate at each campus. We show the vast majority of minority students would be more likely to graduate with a science degree and graduate in less time had they attended a lower ranked university. Similar results do not apply for non-minority students.
Peter Arcidiacono
Department of Economics 201A Social Sciences Building Duke University
Durham, NC 27708 and NBER
psarcidi@econ.duke.edu Esteban M. Aucejo
Department of Economics
London School of Economics and Political Science Houghton Street, London, WC2A 2AE
CEP, Office 2.29 United Kingdom E.M.Aucejo@lse.ac.uk
V. Joseph Hotz
Department of Economics Box 90097
Duke University
Durham, NC 27708-0097 and NBER
hotz@econ.duke.edu
1 Introduction
Increasing the number of Science, Technology, Engineering, and Math (STEM) majors is seen as one of the key components to keeping the U.S. competitive in a global economy (Carnevale, Smith, and Melton 2011).1 In a 2012 report, the President’s Council of Advisors on Science and Technology suggested that the number of STEM majors needed to increase by 34% over current rates to meet the demand for STEM professionals. The lack of STEM majors occurs despite STEM majors earning substantially more than other college degrees with the exception of perhaps business (Arcidiacono 2004, Kinsler and Pavan 2012, Melguizo and Wolniak 2012) and that the STEM premium has increased over time (Gemici and Wiswall 2011).2
Of particular concern is the lack of representation of minority students (Council of Graduate Schools 2007). Seymour and Hewitt (2000) point out that the National Science Foundation alone has spent more than $1.5 billion to increase participation of minorities in the sciences, and two programs at the National Institute of Health have invested $675 million in the same endeavor. At college entry, black and Hispanic students exhibit preferences for STEM fields that are similar to white preferences, yet their probabilities of persisting in these fields are much lower (Anderson and Kim 2006). The data for the University of California system between 1995 and 1997 used in this study show similar patterns. Namely, the percentage of college enrollees expressing an interest in science majors is 35% for both minorities and whites.3 Yet, 19% of white enrollees complete a degree in the sciences with the corresponding number for minorities at less than 11%. In a similar vein, among those who complete a degree in five years, 31% of whites and 17% of minorities graduate with a STEM major.
While different programs have been implemented with the aim to reduce the current racial disparities in shares of the U.S. workforce with STEM degrees, little is known about the role that colleges play in “producing” STEM degrees, especially for underrepresented minority groups.
1The importance of STEM majors has recently been highlighted in a Florida proposal to freeze tuition for majors that are in high demand (Alvarez 2012) as a way of facilitating recovery from the recession. At the same time, some schools charge high tuition for more lucrative majors, citing fairness issues and differences in educational costs of different majors (Stange 2012).
2Data on subjective expectations from a variety of schools indicates students are aware of the general differ- ences in earnings across fields. See Arcidiacono, Kang, and Hotz (2012), Stinebrickner and Stinebrickner (2011), Wiswall and Zafar (2012), and Zafar (forthcoming).
3Asian students have a higher initial interest in the sciences at 51%.
An important exception is the study by Griffith (2010), who finds that characteristics of colleges play a key role in the decision of students to remain in a STEM major and obtain a degree in any of these fields. For example, she finds that students at selective colleges with large research expenditures relative to total educational expenditures have lower persistence rates of students in the sciences, especially minority students. In this regard, understanding campus disparities in terms of the benefits and costs of producing STEM majors among minorities (and non- minorities) may have important implications for the way agencies, such as the National Science Foundation (NSF) and National Institutes of Health (NIH), allocate resources across colleges in the U.S. to increase the representation of minorities in such majors. Moreover, studying these differences by types of colleges (e.g., more selective vs. less selective) among minorities can be relevant to assess whether programs, such as affirmative action, improve minority representation among STEM degree holders or hinder it by encouraging minority students to attend colleges where success in STEM fields is unlikely.
In this paper, we make use of a rich database that contains information on applicants, enrollees and graduates of baccalaureate programs at the various campuses within the University of California (UC) system. These data include measures of students’ academic preparation, intended major, and, conditional on graduating, their final major. The data reveal substantial sorting across majors between freshmen and senior year. Those with SAT scores that are high relative to the campus average are more likely to persist in a science major and graduate with a science degree. This is especially true for minority students. For example, at UC Berkeley minorities who persisted in the sciences had SAT scores over 100 points higher than those who switched to a major outside of the sciences. For non-minority students the gap was only 30 points. These differences also are reflected in the likelihood of graduating. At UC Berkeley, minority students who began in the sciences had less than a 31% probability graduating with a science degree within five years, with the corresponding four-year graduation rate of 11%.
The differences across campuses in the rates of persistence in STEM majors and graduation rates reflect, in part, differences across campuses in the academic preparation of their students.
But, they may also reflect campus differences in how academic preparation, especially in STEM majors, translates into graduation. As we discuss below – and document in our empirical
analysis – while the more selective UC campuses (e.g., UC Berkeley and UCLA) have greater success in graduating better prepared students in STEM fields, they are not as successful as less-selective campuses (e.g., UC Riverside) in graduating less-prepared students in such majors.
We use data on minority and non-minority students4 who enrolled at one of the UC campuses between 1995 through 1997 to estimate a model of students’ decision to graduate from college with a particular major. We account for the initial selection into colleges via a Dale and Krueger (2002) approach, taking advantage of the rich data on where students submitted applications and where they were accepted. In addition, we allow campuses to differ in the attractiveness of particular majors. We do so by allowing the returns to academic preparation to be specific to the school and major combination. These returns are the combination of the reward in the labor market net of the difficulty of the course work. Schools and majors that reward academic preparation more than others will have relatively high persistence rates for those with high levels of academic preparation but relatively low persistence rates for those with lower levels of academic preparation.5
Estimates of the choice model reveal that the match between the student and the university is an important component for persistence in STEM majors. Students with relatively low levels of academic preparation will find majoring in a STEM field relatively less attractive at the most selective schools.6 Our estimates suggest that the vast majority of minority students who begin in the sciences at UC Berkeley would be more likely to graduate with a science degree had they enrolled in a less-selective campus, such as UC Santa Cruz or UC Riverside.7 The potential gains in minority graduation rates in the sciences from reallocating minority students are quite
4Throughout this paper, minority students consist of African Americans, Hispanics, and Native Americans, i.e., “under-represented minority groups” and non-minority students consist of whites and Asian Americans.
5Clearly those with higher levels of academic preparation will be more likely to persist at all schools. However, the school which makes it most likely that a particular student will graduate in a particular major may depend on the academic preparation of the student.
6Smyth and McArdle (2004) and Luppino and Sander (2012) also illustrate the importance of relative prepa- ration in the choice of college major, finding that those who are significantly under-prepared are less likely to persist in the sciences. What distinguishes our work is the importance of the matching of student preparation with campus selectivity: students with strong (weak) academic characteristics are more likely to graduate in the sciences at the more (less) selective campuses.
7This finding is related to those in Arcidiacono (2005), who examines how the returns to college quality in terms of subsequent earnings vary by a student’s choice of major. His estimates suggest that, while the returns to college quality are slightly higher in the social sciences/humanities (but not education) than in the natural sciences, the differences in the return to college quality are small relative to the differences in earnings across majors.
large. For example, minorities from UC Berkeley that are in the bottom quartile of the SAT score distribution would be twice as likely to graduate in the sciences at UC Santa Cruz or UC Riverside as they are observed to do so at UC Berkeley.8 In contrast, non-minority students that were enrolled at UC Berkeley would have had lower rates of persistence in the sciences if they had attended the two lowest-ranked UC campuses (UC Santa Cruz and UC Riverside).
That is, for the purposes of science graduation rates, non-minority students are well-matched.
The rest of the paper is organized as follows. In Section 2 we describe the data we use on students who entered a UC campus in the falls of 1995, 1996 or 1997 and provide summary statistics. We also document the across-campus differences in the rates at which minority students persisted in and graduated with STEM and non-STEM majors. In Section 3 we develop an econometric model of the decision of students to graduate in alternative majors or not graduate when colleges differ in the net returns to students’ academic preparation. Section 4 shows model estimation results and presents counterfactual simulations. Section 5 concludes.
2 The Data and Descriptive Findings by Race across UC Campuses
2.1 Majors and Graduation Rates
The data we use were obtained from the University of California Office of the President (UCOP) under a California Public Records Act request. These data contain information on applicants, enrollees and graduates of the UC system. The data are organized by years in which these students would enter as freshmen. Due to confidentiality concerns, some individual-level information was suppressed. In particular, the UCOP data have the following limitations:9
1. The data does not provide the exact year in which a student entered as a freshman, but rather a three year interval.
2. The data provide no information on gender, and race is aggregated into four categories:
8The fraction of minority students at Berkeley in the bottom quartile of the applicant distribution was 34%
for the years 1995-1997, the period of our study.
9See Antonovics and Sander (2012) for a more detailed discussion of this data set.
white, Asian, minority, and other.10
3. Academic data, such as SAT scores and high school grade point average (GPA), were only provided as categorical variables, rather than the actual scores and GPAs.
Weighed against these limitations is having access to the universe of students who applied to at least one campus in the UC system and also whether they were accepted or rejected at every UC campus where they submitted an application.
Our analysis focuses on the choices and outcomes of minority and non-minority students who enrolled at a UC campus during the interval 1995-1997. During this period, race-conscious admissions were legal at all of California’s public universities. Starting with the entering class of 1998, the UC campuses were subject to a ban on the use affirmative action in admissions enacted under Proposition 209.11 While available, we do not use data on the cohorts of students for this later period (i.e. 1998-2005) as there is evidence that the campuses changed their admissions selection criteria in order to conform with Prop 209.12
We begin by examining the differences across campuses in enrollments, graduation rates and SAT scores by UC campus for both non-minority and minority students. Tabulations are presented in Table 1, with the UC campuses listed according to theU.S. News & World Report rankings as of the fall of 1997.13 Minorities made up 18.5% of the entering classes at UC campuses during this period. The three campuses with the highest highest minority shares are at the two most-selective universities (UCLA and UC Berkeley) and the least-selective university (UC Riverside). A similar U-shaped pattern was found in national data in Arcidiacono, Khan, and Vigdor (2011), suggesting diversity at the top campuses comes at the expense of diversity of middle tier institutions.
We next examine the distribution of SAT scores across the campuses for minorities and non-minorities.14 For both non-minority and minority students, the average test scores gen-
10The other category includes those who did not report their race.
11See Arcidiacono, Aucejo, Coate and Hotz (2012) for analyses of the effects of this affirmative action ban on graduation rates in the UC system.
12See Arcidiacono, Aucejo, Coate and Hotz (2012).
13The 1997U.S. News & World Report rankings of National Universities included 6 of the 8 UC campuses in their Top 50: UC Berkeley (27); UCLA (31); UC San Diego (34); UC Irvine (37); UC Davis (40); and UC Santa Barbara (47). Neither UC Santa Cruz or UC Riverside ranked in the Top 50 National Universities.
14As noted above, the UCOP data does not include the exact scores students received on the verbal and math
Table1:AverageSATScoresandGraduationRatesbyUCCampus&MinorityStatus,1995-97 SanSantaSantaAll BerkeleyUCLADiegoDavisIrvineBarbaraCruzRiversideCampuses No.ofFreshmenEnrollees: Non-Minority8,0738,2567,5258,6387,4458,2774,5113,41556,140 Minority2,2872,8031,0811,4971,1291,8459701,15612,768 %ofEnrollmentMinority22.1%25.4%12.6%14.8%13.2%18.2%17.7%25.3%18.5% Ave.SATScores: Non-Minority1,3351,2791,2451,1821,1361,1561,1641,1001,211 Minority1,1421,1191,1211,0711,0251,0231,0199651,074 Difference193161124111111133145135136 5-YearGraduationRates: Non-Minority85.9%83.3%80.4%76.1%68.3%72.5%67.7%63.0%76.1% Minority68.4%66.0%66.4%54.8%63.2%60.0%60.9%59.2%63.0% Difference17.6%17.2%14.0%21.3%5.1%12.5%6.7%3.8%13.1% 4-YearGraduationRates: Non-Minority56.1%48.2%49.5%37.2%32.7%44.5%45.9%38.9%44.5% Minority32.5%26.1%32.2%20.1%24.9%27.8%38.4%29.3%28.4% Difference23.5%22.1%17.3%17.1%7.9%16.8%7.5%9.5%16.0% %ofRace/EthnicGroupEnrolleeswhoseInitialMajor=Science: Non-Minority48.9%43.9%52.2%45.4%48.0%29.0%26.0%40.1%42.7% Minority29.9%34.7%50.1%44.4%46.9%28.2%26.9%30.5%35.4% Difference19.0%9.2%2.1%1.0%1.2%0.8%-0.9%9.6%7.2% %ofInitialScienceMajorsthatSwitchOutofScience: Non-Minority38.5%41.2%36.4%41.5%46.4%48.2%65.4%44.7%42.9% Minority65.1%58.1%52.9%50.0%55.2%52.9%70.9%60.1%57.3% Difference-26.6%-16.9&-16.5%-8.5%-8.8%-4.7%-5.5%-15.4%-14.4% %ofGraduateswhoseMajor=Science: Non-Minorities38.4%31.7%41.3%34.3%29.2%16.9%17.6%31.7%31.2% Minorities14.1%16.9%27.2%24.0%19.8%12.8%12.9%14.8%17.2% Difference24.3%14.8%14.1%10.3%9.4%4.1%4.8%17.0%13.9% DataSource:UCOP. Allfiguresareonanannualbasis.
erally follow the rankings of the UC campuses. However, SAT scores for minority students are substantially lower than their white counterparts at each campus, with the largest racial gaps occurring at UC Berkeley (193) and UCLA (161). Moreover, the spread of scores across campuses is greater for non-minorities (235 points) than it is for minority students (177 points).
Differences in the academic preparation of students across campuses appear to track differ- ences in graduation rates, regardless of whether one looks at on-time graduation (in 4 years) or 5 year graduation rates. Non-minority students at UC Berkeley have 5-year graduation rates that are almost 18 percentage points higher than minority students at UC Berkeley, while the gap at UC Riverside is less than 3 percentage points. Differences in four-year graduation rates are even starker, with 56.1% of non-minority students at UC Berkeley graduating in four years compared to only 32.5% for minorities. Not withstanding the racial differences, the tabulations in Table 1 indicate that, within each racial group, the top-ranked UC campuses tend to attract students with better academic preparation and achieve higher graduation rates.
Table 1 also indicates that a substantial fraction of students intended to major in the sciences when they entered college – 42.7% for non-minorities and 35.4% for minorities.15 However, sizeable fractions of initial STEM majors end up switching to a different majors; 42.9% and 57.3% of non-minority and minority students who initially declared a STEM major ended up in a non-science major by the time they graduated or dropped out of school. The racial difference in switching is greatest at UC Berkeley and UCLA, the two most-selective campuses. For example, almost two-thirds (65.1%) of minorities at UC Berkeley who initially declared themselves to be science majors had switched out of science by the time they graduated or dropped out. As a result of this lack of persistence in the sciences, only 17.2% of minorities that graduate from a UC campus do so in the sciences, which is around 14 percentage points lower than the corresponding share of non-minorities (31.2%).
sections of the SAT test. Rather, it provides only whether a student’s score on each section fell into one of the following one of the following seven ranges: 200-449; 450-499; 500-549; 550-599; 600-649; 650-699; 700 or above.
We assigned students the midpoint of the range their score was in for the verbal and math tests, respectively, and summed these values to get a student’s SAT score.
15The difference in initial interests between minority and non-minority students is driven by Asians. White students have the same initial interest in the sciences as minority students.
2.2 Persistence in the Sciences
Given these sizeable rates of switching out of science majors and the low graduation rates in the sciences shown in Table 1, especially for minorities, we take a closer look at the across- campus and across-race differences in persisting and graduating with STEM majors. Table 2 displays both average SAT scores (top row) and the share of students (second row) for the three completion categories (graduate in the sciences, graduate but not in the sciences, do not graduate) by initial major and race for each campus, using completion status 5 years after enrollment.
Table 2 shows significant sorting on academic preparation at UC campuses, with students that graduate in the sciences having higher average SAT scores than those who do not, regardless of initial major. SAT scores for non-minority students who persist in the sciences – i.e., start in and graduate with a science major – are between 8 to 43 points higher than those who switch to a non-science major. The differences are much larger for minority students. At each campus, minority students who persist and graduate in the sciences have SAT scores that are between 27 and 115 points higher than those students who switch out of the sciences and graduate with a non-science major. Moreover, as reflected in the rates of switching from the sciences in Table 1, non-minorities are much more likely to persist in and graduate with a degree in the sciences than are minorities. For example, while 55% non-minorities who start in start in the sciences at UC Berkeley graduate in that major, only 24.9% of minorities who start in the sciences do so. This racial gap in persistence rates in the sciences, i.e., the share of students who remain in a science major and graduate, shrinks with the selectivity of the UC campus. We also note that switching into the sciences and graduating with a science degree is low for both racial groups but is much lower for minority students, with gaps again largest at the top campuses.
While 9.2% of non-minority students in the non-sciences switch into the sciences, only 3.5% of minority students do so.
It is also the case that students who start in science majors are less likely graduate from their initial UC campus compared to those who start out in majors outside of the sciences. With the exception of UC Berkeley, non-minority students whose initial major is in the sciences are less likely to graduate than those whose majors are not in the sciences, despite those who start
Table2:AverageSATScoresandSharesforMajor/GraduationCompletionOutcomesforFreshmanenteringaUCCampus in1995-1997,byInitialMajor,Campus,andMinorityStatus† InitialGraduationSanSantaSantaAll MajorStatusBerkeleyUCLADiegoDavisIrvineBarbaraCruzRiversideCampuses Non-Minority: ScienceGrad.inScience1,3591,2991,2661,2201,1711,1931,1721,1771,260 55.3%48.1%50.1%42.2%34.1%32.2%27.8%35.1%43.2% Grad.inNon-Science1,3311,2851,2411,1841,1361,1631,1641,1341,218 30.7%33.1%27.8%32.2%32.1%35.5%36.4%27.5%31.6% DidNotGraduate1,3341,2751,2241,1831,1251,1581,1381,0981,188 14.0%18.8%22.1%25.7%33.9%32.4%35.8%37.4%25.2% Non-ScienceGrad.inScience1,3521,2951,2531,1931,1411,1631,1891,1251,232 11.6%9.4%14.7%12.8%6.8%4.2%6.3%9.8%9.2% Grad.inNon-Science1,3241,2741,2391,1701,1291,1531,1651,0721,203 74.3%75.5%68.4%64.8%63.5%70.4%62.5%53.4%67.9% DidNotGraduate1,3001,2401,2361,1501,1221,1411,1661,0691,165 14.1%15.1%16.9%22.4%29.7%25.5%31.1%36.8%22.9% Minority: ScienceGrad.inScience1,2661,1791,1771,1751,1091,0891,0641,0621,161 24.9%25.8%30.7%22.3%22.7%23.8%18.8%20.1%24.3% Grad.inNon-Science1,1511,1331,1081,0871,0361,0291,0379911,087 39.8%35.1%34.4%29.4%38.0%33.7%34.5%34.6%35.0% DidNotGraduate1,1551,1081,0951,0771,0381,0221,0129821,072 35.4%39.1%34.9%48.3%39.3%42.5%46.7%45.3%40.7% Non-ScienceGrad.inScience1,1851,1791,1691,1221,0601,1371,0379891,125 3.2%3.4%5.4%5.9%3.5%1.4%3.8%3.7%3.5% Grad.inNon-Science1,1291,1181,1271,0599981,0251,0249491,070 66.8%65.4%62.4%51.5%61.8%59.6%59.9%57.4%61.6% DidNotGraduate1,1121,0851,0901,0219981,0019989451,037 30.0%31.2%32.2%42.6%34.7%39.0%36.2%38.9%34.9% † ForeachInitialMajor&GraduationStatuscluster,thetoprowisaverageSATScoreandsecondrowispercentageofenrolleeswhostartedina particularInitialMajor.
out in the sciences having higher SAT scores. This shows the importance of the initial major, both in its effect on the student’s final major and on whether the student graduates at all.
Differences in graduation rates between initial science and non-science majors are much starker for minorities. Among non-minorities who start out in the sciences, 25.2% do not graduate;
in contrast, 40.7% of minorities who start out in the sciences do not graduate. For minorities, those who begin in a non-science major are between 2.7 (for UC San Diego) and 10.5 (for UC Santa Cruz) percentage points more likely to graduate in 5 years than those who start in a non-science major, again despite the fact that those with initial science majors had higher SAT scores.
Table 2 showed that persistence rates in the sciences were higher at the top campuses but that these campuses also had higher average SAT scores. Similarly, persistence rates were higher for non-minority students than minority ones, but this, too, may be the result of differences in average SAT scores by race. We now take a first step towards separating out whether higher persistence rates at top campuses are due to better students or due to something top campuses are doing differently than the the less-selective campuses by breaking out persistence rates by quartiles of the SAT score distribution.
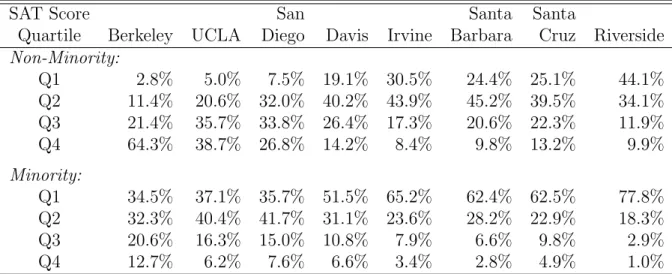
We define the quartiles of the SAT score distribution based on all applicants to the UC system between 1995 and 1997 regardless of whether the applicant attended or even was admitted to a UC campus. Table 3 shows the share of minority and non-minority students in each quartile at each institution. At each of the campuses, minority students are disproportionately represented in the bottom quartile. Even at UC Berkeley, over 34% of minorities are in the bottom quartile of the applicant SAT score distribution. The share of minority students in the bottom quartile at UC Berkeley is actually higher than the share of non-minority students in the bottom quartile at all institutions except for UC Riverside. In contrast, less than 3% of non-minority students at UC Berkeley were in the bottom quartile with over 64% in the top quartile. As we move down the selectivity/rankings of campuses, the share of both minority and non-minority students in the bottom quartile rises, topping out at 78% for minority students and 44% for non-minority students at UC Riverside.
Given the shares of non-minority and minority students in each SAT quartile, we now turn
Table 3: Share of Non-Minority and Minority Students in each Quartile of the 1995-1997 Applicant SAT Score Distribution by Institution
SAT Score San Santa Santa
Quartile Berkeley UCLA Diego Davis Irvine Barbara Cruz Riverside Non-Minority:
Q1 2.8% 5.0% 7.5% 19.1% 30.5% 24.4% 25.1% 44.1%
Q2 11.4% 20.6% 32.0% 40.2% 43.9% 45.2% 39.5% 34.1%
Q3 21.4% 35.7% 33.8% 26.4% 17.3% 20.6% 22.3% 11.9%
Q4 64.3% 38.7% 26.8% 14.2% 8.4% 9.8% 13.2% 9.9%
Minority:
Q1 34.5% 37.1% 35.7% 51.5% 65.2% 62.4% 62.5% 77.8%
Q2 32.3% 40.4% 41.7% 31.1% 23.6% 28.2% 22.9% 18.3%
Q3 20.6% 16.3% 15.0% 10.8% 7.9% 6.6% 9.8% 2.9%
Q4 12.7% 6.2% 7.6% 6.6% 3.4% 2.8% 4.9% 1.0%
to persistence rates conditional on institution and SAT quartile. Table 4 gives the results for minority students. (The corresponding tabulations for non-minority students are found in Table 12 in the Appendix.) The evidence indicates that minority students with low SAT scores would be more likely to persist in the sciences if they attended a less-selective institution. For example, minority students in the bottom quartile of the SAT score distribution who attended UC Berkeley graduated in the sciences at a lower rate than similar students at UC Riverside, despite those in the bottom quartile at UC Berkeley likely being stronger in other dimensions (high school grades, parental education, etc.) than those in the bottom quartile at UC Riverside.
Note that the total graduation rate for initial science majors in the bottom quartile is actually higher at UC Berkeley and UC Riverside. The primary difference is that at UC Berkeley many of the students switch to non-science majors. Indeed, initial science majors in the bottom quartile at UC Berkeley are close to five times as likely to graduate in the non-sciences than in the sciences.
The results are different for minorities in the top quartiles, with those attending UC Berkeley graduating at a higher rate in the sciences than those at UC Riverside. This is suggestive that matching may be important – at least in the sciences – with top campuses being particularly advantageous for those at the top of preparation distribution and less selective campuses being more advantageous for those further down the preparation distribution. But beyond differences across campuses, the reality is that those in the bottom quartiles of the SAT score distribution
have very low persistence rates in the sciences.
Table 4 also reinforces the point that an initial major in the sciences makes graduation in any field in five years less likely, particularly for minorities in the bottom quartile of the SAT score distribution. Overall, minorities in the bottom quartile with an initial major in the sciences have graduation probabilities that are over eight percentage points lower than their non-science counterparts. The similar gap for those in the top quartile is around four percentage points.
The corresponding results for non-minority students, displayed in Table 12 in the Appendix, are very different. In particular, at all quartiles of the SAT score distribution non-minority students are, on average, more likely to graduate in the sciences at UC Berkeley than at UC Riverside, and are significantly more likely to graduate, regardless of major, at UC Berkeley than at UC Riverside. These results for non-minority and minority students suggest that mismatch of students with initial interests in STEM majors to UC campuses may be sizeable for minorities.
Moreover, this mismatch may be a consequence of affirmative action policies in which race as well as academic preparation affect which campus students attend. At the same time, it would be premature to ascribe any causal explanation of these racial differences in the share of students graduating with science degrees since these tabulations do not account for selection, i.e. the fact that the students at UC Berkeley are likely to be better prepared than those at UC Riverside.
The patterns of persistence in science majors and probabilities of graduating in any field are even more striking if we instead examine 4-year graduation rates. Table 5 repeats the analysis of Table 4, but this time examines 4-year graduation rates. (The corresponding results for non- minorities are recorded in Table 13 in the Appendix.) The probability that a minority in the bottom quartile of the SAT score distribution who initially was interested in a science major actually graduates in the sciences in four years at UC Berkeley is astonishingly low at 0.6% and is substantially lower than the corresponding probability at UC Riverside. This again occurs despite students at UC Berkeley having stronger academic preparation on other dimensions.16
16Switching majors on average delays graduation. While 24% of those who graduated in five years had switched majors, the corresponding share of those who graduated in four years was 20%.
Table4:UnadjustedSharesofMinorityStudentsGraduatingin5YearswithScienceorNon-ScienceMajors,by Campus,SATQuartile,andInitialMajor InitialSATSanSantaSantaAll MajorQuartileBerkeleyUCLADiegoDavisIrvineBarbaraCruzRiversideCampuses ShareGraduatingwithScienceMajor: ScienceQ110.3%15.5%19.7%13.1%17.3%18.3%16.7%15.6%15.9% Q214.6%27.4%32.1%21.9%26.6%27.4%21.7%28.9%25.2% Q337.6%34.8%36.6%39.8%28.8%41.3%17.9%27.8%35.4% Q445.5%40.0%57.4%42.4%50.0%40.0%29.4%50.0%49.0% Non-ScienceQ12.6%2.0%3.0%3.9%3.3%0.6%4.0%3.5%2.6% Q22.3%3.5%6.6%5.9%2.4%2.0%1.9%4.7%3.4% Q33.5%4.8%5.0%13.7%8.1%5.3%6.0%6.3%5.4% Q47.6%9.0%11.4%15.0%10.0%5.4%6.7%0.0%8.7% ShareGraduatingwithNon-ScienceMajor: ScienceQ147.1%35.3%37.2%30.8%42.8%35.3%32.7%35.7%36.9% Q249.8%35.4%34.4%32.9%33.6%34.1%40.0%32.5%36.7% Q331.8%34.8%34.1%21.6%28.8%21.7%32.1%33.3%30.7% Q423.1%33.3%23.4%20.3%25.0%33.3%35.3%25.0%25.8% Non-ScienceQ165.5%60.5%55.1%47.9%62.1%58.0%58.2%58.0%58.6% Q266.3%68.3%65.2%57.6%58.5%62.4%63.0%53.9%64.2% Q370.0%69.6%73.8%56.2%67.6%60.0%58.2%56.3%67.1% Q467.5%67.0%60.0%50.0%70.0%70.3%73.3%75.0%65.9% ShareGraduating,AnyMajor: ScienceQ157.5%50.8%56.9%43.9%60.1%53.6%49.4%51.2%52.8% Q264.4%62.8%66.5%54.8%60.1%61.6%61.7%61.4%61.9% Q369.4%69.5%70.7%61.4%57.7%63.0%50.0%61.1%66.1% Q468.7%73.3%80.9%62.7%75.0%73.3%64.7%75.0%70.8% Non-ScienceQ168.1%62.5%58.1%51.9%65.3%58.6%62.2%61.5%61.3% Q268.6%71.8%71.8%63.4%61.0%64.3%64.8%58.6%67.6% Q373.5%74.4%78.8%69.9%75.7%65.3%64.2%62.5%72.5% Q475.2%76.0%71.4%65.0%80.0%75.7%80.0%75.0%74.6%
Table5:UnadjustedSharesofMinorityStudentsGraduatingin4YearswithScienceorNon-ScienceMajors,by Campus,SATQuartile,andInitialMajor InitialSATSanSantaSantaAll MajorQuartileBerkeleyUCLADiegoDavisIrvineBarbaraCruzRiversideCampuses ShareGraduatingwithScienceMajor: ScienceQ10.6%2.2%5.9%1.4%4.9%6.1%7.7%8.2%4.5% Q25.5%6.5%14.7%5.3%8.4%12.8%11.7%16.9%9.0% Q319.7%12.3%18.3%19.3%15.4%21.7%14.3%22.2%17.0% Q423.1%20.0%23.4%25.4%28.6%26.7%29.4%50.0%24.3% Non-ScienceQ10.2%0.3%1.5%0.6%0.0%0.0%2.2%1.7%0.7% Q20.8%0.5%2.2%1.7%0.8%0.6%0.6%1.6%0.9% Q31.6%1.5%2.5%2.7%5.4%1.3%1.5%0.0%1.8% Q44.5%4.0%11.4%12.5%10.0%5.4%6.7%0.0%6.1% ShareGraduatingwithNon-ScienceMajor: ScienceQ114.4%6.5%13.8%7.6%11.8%12.2%16.7%12.7%11.3% Q222.4%11.6%16.1%13.2%9.1%14.0%16.7%16.9%14.6% Q312.7%13.4%17.1%10.2%9.6%13.0%10.7%22.2%13.1% Q49.7%17.3%12.8%6.8%7.1%26.7%23.5%25.0%12.5% Non-ScienceQ127.2%22.6%21.7%16.6%28.1%27.2%36.9%28.5%26.3% Q234.1%33.2%38.8%25.6%30.9%32.3%46.3%30.5%33.6% Q343.5%35.9%46.3%28.8%37.8%34.7%43.3%37.5%39.3% Q441.4%38.0%40.0%30.0%50.0%29.7%56.7%25.0%39.5% ShareGraduating,AnyMajor: ScienceQ114.9%8.7%19.7%9.0%16.7%18.3%24.4%20.9%15.7% Q227.9%18.1%30.8%18.4%17.5%26.8%28.3%33.7%23.6% Q332.5%25.7%35.4%29.5%25.0%34.8%25.0%44.4%30.1% Q432.8%37.3%36.2%32.2%35.7%53.3%52.9%75.0%36.8% Non-ScienceQ127.4%22.9%23.2%17.2%28.1%27.2%39.1%30.2%27.0% Q234.9%33.7%41.0%27.3%31.7%32.9%46.9%32.0%34.6% Q345.0%37.4%48.8%31.5%43.2%36.0%44.8%37.5%41.1% Q445.9%42.0%51.4%42.5%60.0%35.1%63.3%25.0%45.5%
3 Modeling Student Persistence in College Majors and Graduation
The descriptive statistics in Section 2 suggest that the match between the academic prepa- ration and the selectivity of the college may be important, particularly in the science and for minorities. We now propose a model that is flexible enough to capture these matching effects.
We model a student’s decision regarding whether to graduate from college and, if they do, their final choice of major. In particular, student i attending college k can choose to major and graduate in a science field, m, or in a non-science field, h, or choose to not graduate,n. Denote the student’s decision by dik, dik ∈ {m, h, n}. In what follows, the student’s initial choice of a college,k is taken as given. Note that this introduces a selection problem: students at Berkeley are likely strong not only on characteristics observed by the researcher but also along unobserved dimensions. We discuss the selection problem in more detail in section 3.2.
We assume that the utility student iderives from graduating with a major inj from college k depends on three components: (i) thenet returns she expects to receive from graduating with this major from this college; (ii) the costs of switching one’s major, if the student decides to change from the one with which she started college; and (iii) other factors which we treat as idiosyncratic and stochastic. The net returns from majoring in fieldjat collegek,Rijk, is just the difference between the expected present value of future benefits,bijk, of having this major/college combination, less the costs associated with completing it, cijk, i.e., Rijk = bijk −cijk.17 In particular, the benefits would include the expected stream of labor market earnings that would accrue to someone with this major-college combination (e.g., an engineering degree from UC Berkeley), where these earnings would be expected to vary with a student’s ability and the quality of training provided by the college.
The costs of completing a degree in fieldj atk depend on the effort a student would need to exert to complete the curriculum in this major at this college, where this effort is likely to vary with i’s academic preparation and the quality of the college and its students. With respect to switching costs, each student arrives on campus with an initial major, jint (as with the college
17For a similar approach to modeling the interaction between colleges and majors in determining college graduations in particular majors, see Arcidiacono (2004).
she attends, her initial, or intended, major,jint, is taken as given). The student may remain in and graduate with her initial major or may decide to switch to and graduate with a different major in which case the switching cost,Cijk, is paid. Finally, we allow for an idiosyncratic taste factor, ijk. It follows that the payoff function for graduating with major j at school k is given by:
Uijk = Rijk−Cijk+ijk (1) for j ∈ {m, h}. Below, we characterize the specific functional forms for Rijk and Cijk that we use in estimation.
Since discrete choice models depend on differences in payoffs, without loss of generality we normalize the student’s utility of not graduating from college k, denoted as Uink, to zero. It follows that the major/graduation choice of studenti attending college k is made according to:
dik = arg max
m,h,n{Uimk, Uihk,0} (2)
3.1 Net Returns
We assume that the net returns of a particular major/college combination, Rijk, varies with an index of a student’s academic preparation for major j, denoted by AIij, and that these net returns to AIij may differ across campuses. In particular, we assume that Rijk is characterized by the linear function:
Rijk=φ1jk+φ2jkAIij (3) The specification in (3) allows college-major combinations to differ in their net returns to the academic index with higher net returns associated with higher values of φj. As noted above, such differences in φ2jk may result from colleges gearing their curriculum in a particular ma- jor to students from a particular academic background which, in turn, produce differences in subsequent labor market earnings. Degrees in various majors from different colleges also may produce differing net returns that do not depend on a student’s academic preparation which is reflected in differing values of φ1jk. For example, the curriculum in majors at some colleges
(e.g., engineering at MIT) may have different course requirements that all students have to meet, regardless of their academic preparation, that impose differing effort and time costs to completing the major.
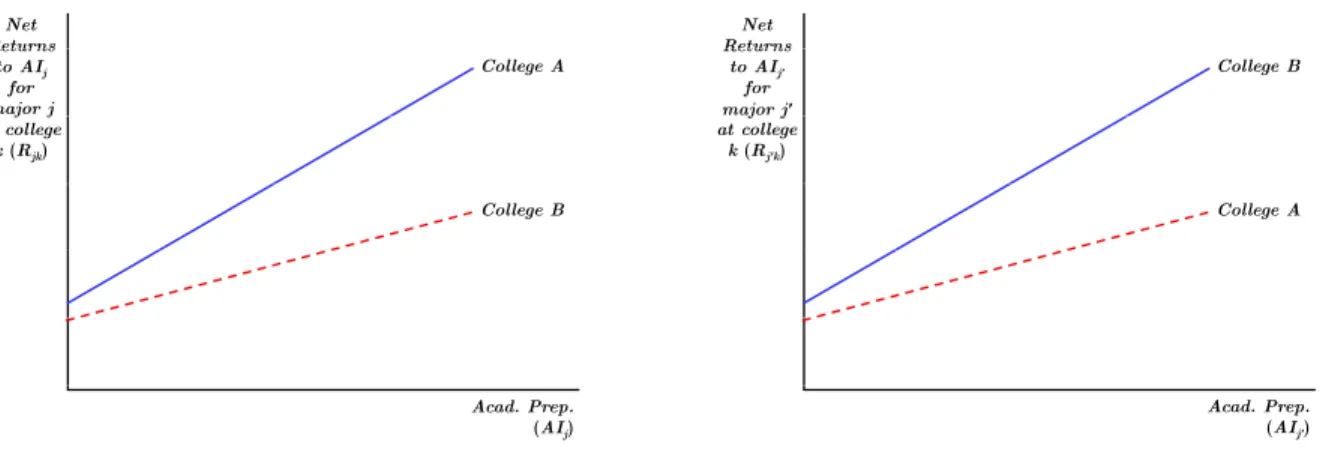
We are interested in how differences across colleges of differing quality, or selectivity, differ in their ability to educate and graduate students of differing academic preparation in various majors. To see how the specification of the net returns functions in (3) capture such differences, suppose that CollegeAis an elite, selective college (e.g., UC Berkeley, UCLA or UC San Diego), while College B is a less selective one (e.g., UC Santa Cruz or UC Riverside). One possibility is that highly selective colleges (A) have an absolute advantage relative to less selective ones (B) in the net returns students from any level of academic preparation would receive and that such advantage is true for all majors. This case is illustrated in Panel (a) of Figure 1, where the absolute advantage holds for all majors. Alternatively, selective colleges may not generate higher net returns for students with all levels of academic preparation in all fields. For example, selective colleges may have an absolute advantage in moving all types of students through its science curriculum, whereas less selective colleges (B) may have an absolute advantage in training students in the humanities. This case is characterized by Panels (a) and (b) in which elite colleges (A) have absolute advantage in getting students through major j, while less selective colleges (B) have an absolute advantage in graduating all students from major (j0). This second case might arise if colleges develop faculties and facilities to educate students in some majors, but not others, such as “technology institutes” (e.g., Caltech, Georgia Tech) which focus on their curriculum and research in science and technology.
But some colleges may produce higher net returns in some majorjfor less-prepared students, while others are geared to better-prepared students and produce higher net returns for the latter type of student. This case is illustrated in Panel (c) for majorj. At first glance, this differences- in-relative-advantage between highly selective and less selective colleges may account for the differential success UC Berkeley and UCLA had in graduating minorities versus non-minorities with STEM majors compared to lesser-ranked UC campuses, like UC Santa Barbara and UC Riverside. Below, we examine the empirical validity of this latter explanation, after explicitly accounting for differences in student preparation and student persistence in majors across the
Net Returns
College A Returns
to AIj
for major j j j at college
k (Rjk)
College B
Acad. Prep.
(AIj)
(a) Net Returns toAI of graduating in major j from CollegeAisgreater than fromB forall AIj.
Net Returns
College B Returns
to AIj′
for major j′j j at college
k (Rj′k)
College A
Acad. Prep.
(AIj′)
(b) Net Returns toAI of graduating in majorj0 from CollegeB isgreater than fromAforall AIj0.
Net Returns
College A Returns
to AIj
for major j
College B j j
at college k (Rjk)
Acad. Prep.
(AIj)
(c) Net Returns toAI of graduating in major j from CollegeAisgreaterthanBforbetter preparedstudents, butgreater fromB thanAforless prepared ones.
Figure 1: Differences in Net Returns to Student Academic Preparation (AI) by Major at Se- lective (A) and Non-Selective (B) Colleges
UC campuses.
3.2 Academic Preparation for Majors
We now specify how the student’s academic index is constructed. We assume that the various abilities of the student can be characterized by a set of characteristicsXi. These characteristics
are then rewarded in majors differently. For example, math skills may be rewarded more in the sciences while verbal scores may be more rewarded outside of the sciences. The academic index for major j ∈ {m, h}, AIij, is then given by:
AIij =Xiβj (4)
where βj allows for the weights on the various measures of preparation to vary by major.
Our estimation problem is analogous to that in the literature concerning the effects of college quality on graduation and later-life outcomes. In particular, whether a student remains in a major and graduates from a particular college is the result of student decisions that are influenced by the quality of the campus – in our case the campus-specific net returns to graduating with a major and the costs of switching a major – and by observed and unobserved dimensions of her academic preparation. To account for the selection effects in our context, we employ the approach used by Dale and Krueger (2002) by constructing a set of academic indices for each student that depend not only on observables, such as SAT math and verbal scores, but also on dimensions not fully captured by such measures but that are reflected in where a student applied and the rankings/quality of UC campuses to which she was admitted. The full set of characteristics,Xi, is given by: observed measures of academic preparation (Hi), which includes high school GPA, and SAT math and verbal scores; parental background (Bi), which includes dummy variables for each family income category and each parental education category; dummy variables for each of the schools in the UC system where the individual submitted an application, wheresik = 1 if the individual submitted an application to schoolk and zero otherwise; and an indicator variable of whether the individual was admitted to school k, aik. That is:
Xi =h
Hi Bi Si Ai i
where:
Si = h
si1 · · · siK i
Ai = h
ai1 · · · aiK
i
The academic index for individualiin major j,AIij, is then given by a major-specific weighted average of the characteristics in Xi as in (4). In this way, we allow the possibility that charac- teristics such as SAT math may be more important for science majors than non-science majors.
3.3 Costs of Switching Majors
Finally, we specify the cost of switching majors, Cijk. We allow these costs to depend on the individual’s academic index (AIij), a set of variables, Bi, that contain measures of parental support such as parental income and education, and a college specific component,α3k.
Cijk=
AIijα1j+Biα2+α3k if jint 6=j
0 if jint =j
(5)
3.4 Estimation
We specify the error structure such that it has a nested logit form, allowing the errors to be correlated among the two graduation options, i.e., graduating with a science major (m) and graduating with a non-science degree (h). In this way we account for shocks after the initial choice of school and major that may influence the value of continuing one’s education. For example, a shock to one’s finances or personal issues may make college in general unattractive.
Given our assumption regarding the error distribution, the probability of choosing to graduate fromk with major j, conditional onX and B (but not ), is given by:
pijk = P
j0exp u
ij0k
ρ
ρ−1
exp u
ijk
ρ
P
j0expu
ij0k
ρ
ρ
+ 1
(6)
for j =m, h and where the probability of choosing not to graduate fromk is given by:
pi0k = 1
P
j0expu
ij0k
ρ
ρ
+ 1
(7)
We estimate separate nested logit models for minority and non-minority students, as well as separate models for 4- and 5-year graduation outcomes.
4 Results
In this section we present estimates of the model of graduation/major choices. By modeling these choices, we attempt to account for cross-campus differences in academic preparation. To assess the consequences of adjusting for selection, we then examine how persistence in majors and overall graduation rates would differ from the rates presented in Section 2 if student academic preparation were equalized across the UC campuses. Finally, we calculate changes in STEM graduations for minority (and non-minority) students from reallocating students across the UC campuses. As we show below, these exercises imply sizeable gains in STEM major graduations among minorities from reallocating students, especially less-prepared ones, from higher-ranked UC campuses to lower-ranked ones.
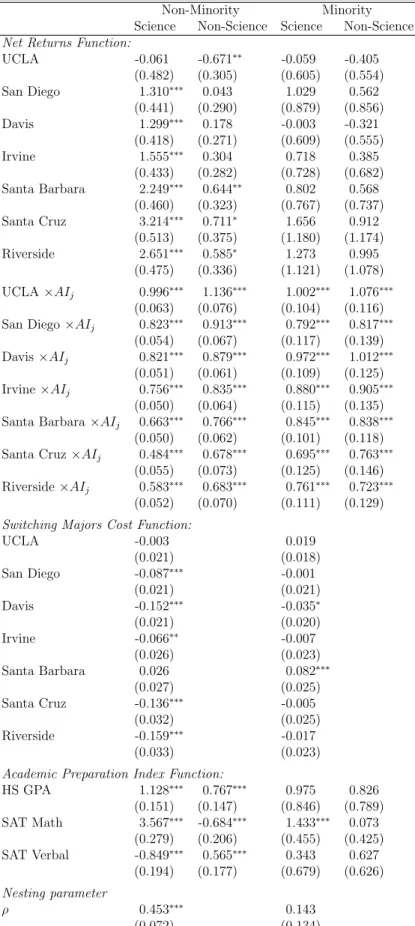
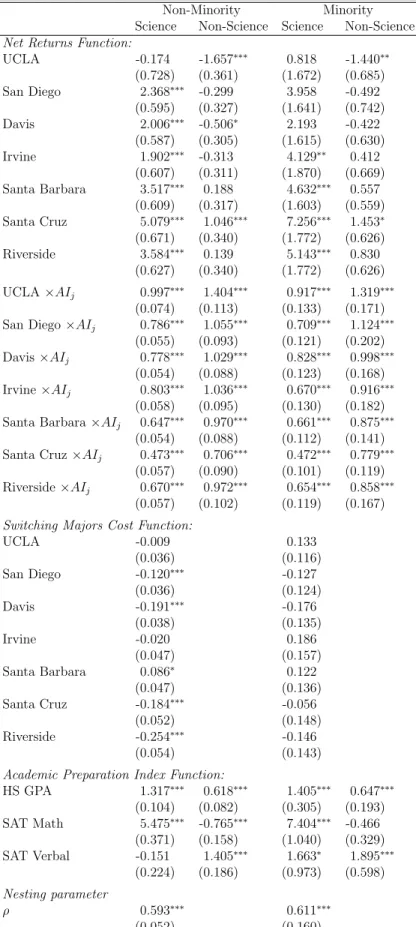
Estimates of the key parameters of based on graduation in 5 or less years for minorities and non-minorities are given in Table 6.18 We present estimates for the parameters of the net return functions in (3), the switching majors cost function in (5) and some of the indices of students’
academic preparation from (4) for science and non-science majors.19
Consider first the estimates for the indices of academic preparation found in Table 6. Among non-minorities, there are notable differences in the relative importance of particular measures of academic preparation across the two majors, with the SAT Math score being important for Science majors, while SAT verbal is more important for the non-sciences. A student’s high school GPA is important for both majors, but is relatively more important for Science than non-science. Similar patterns hold for minorities, although only the positive effect of SAT Math scores on the preparation index for science majors is precisely estimated.20
The coefficient estimates for the net returns function are displayed in Table 6. Note that the estimated campus intercepts and slope coefficients for the specification in (3) are measured
18The corresponding parameter estimates for data on four-year graduation rates are found in Table 14 in the Appendix and show similar patterns.
19The full model has 144 parameters. For ease of exposition, we do not report the coefficients in the academic index or the switching costs for each family income and parental education category. Nor do we report the Dale and Krueger controls.
20The lack of precision is driven by the flexibility of our specification. For example, using a less flexible function for the returns to parental income education, as opposed to dummying out each category, results in statistically significant effects for the main academic measures.
Table 6: Nested Logit Coefficients for Choice of Final Major based on 5-year Graduation Criteria†
Non-Minority Minority
Science Non-Science Science Non-Science Net Returns Function:
UCLA -0.061 -0.671∗∗ -0.059 -0.405
(0.482) (0.305) (0.605) (0.554)
San Diego 1.310∗∗∗ 0.043 1.029 0.562
(0.441) (0.290) (0.879) (0.856)
Davis 1.299∗∗∗ 0.178 -0.003 -0.321
(0.418) (0.271) (0.609) (0.555)
Irvine 1.555∗∗∗ 0.304 0.718 0.385
(0.433) (0.282) (0.728) (0.682) Santa Barbara 2.249∗∗∗ 0.644∗∗ 0.802 0.568
(0.460) (0.323) (0.767) (0.737)
Santa Cruz 3.214∗∗∗ 0.711∗ 1.656 0.912
(0.513) (0.375) (1.180) (1.174)
Riverside 2.651∗∗∗ 0.585∗ 1.273 0.995
(0.475) (0.336) (1.121) (1.078) UCLA×AIj 0.996∗∗∗ 1.136∗∗∗ 1.002∗∗∗ 1.076∗∗∗
(0.063) (0.076) (0.104) (0.116) San Diego×AIj 0.823∗∗∗ 0.913∗∗∗ 0.792∗∗∗ 0.817∗∗∗
(0.054) (0.067) (0.117) (0.139) Davis×AIj 0.821∗∗∗ 0.879∗∗∗ 0.972∗∗∗ 1.012∗∗∗
(0.051) (0.061) (0.109) (0.125) Irvine×AIj 0.756∗∗∗ 0.835∗∗∗ 0.880∗∗∗ 0.905∗∗∗
(0.050) (0.064) (0.115) (0.135) Santa Barbara×AIj 0.663∗∗∗ 0.766∗∗∗ 0.845∗∗∗ 0.838∗∗∗
(0.050) (0.062) (0.101) (0.118) Santa Cruz×AIj 0.484∗∗∗ 0.678∗∗∗ 0.695∗∗∗ 0.763∗∗∗
(0.055) (0.073) (0.125) (0.146) Riverside×AIj 0.583∗∗∗ 0.683∗∗∗ 0.761∗∗∗ 0.723∗∗∗
(0.052) (0.070) (0.111) (0.129) Switching Majors Cost Function:
UCLA -0.003 0.019
(0.021) (0.018)
San Diego -0.087∗∗∗ -0.001
(0.021) (0.021)
Davis -0.152∗∗∗ -0.035∗
(0.021) (0.020)
Irvine -0.066∗∗ -0.007
(0.026) (0.023)
Santa Barbara 0.026 0.082∗∗∗
(0.027) (0.025)
Santa Cruz -0.136∗∗∗ -0.005
(0.032) (0.025)
Riverside -0.159∗∗∗ -0.017
(0.033) (0.023)
Academic Preparation Index Function:
HS GPA 1.128∗∗∗ 0.767∗∗∗ 0.975 0.826
(0.151) (0.147) (0.846) (0.789) SAT Math 3.567∗∗∗ -0.684∗∗∗ 1.433∗∗∗ 0.073
(0.279) (0.206) (0.455) (0.425) SAT Verbal -0.849∗∗∗ 0.565∗∗∗ 0.343 0.627
(0.194) (0.177) (0.679) (0.626) Nesting parameter
ρ 0.453∗∗∗ 0.143
(0.072) (0.134)
†All campus dummies are measured relative to UC Berkeley (the omitted category).
relative to those for UC Berkeley (the slope for UC Berkeley is normed to one). We make three points about how the net returns functions vary with student academic preparation (AIj).
First, not surprisingly, the net returns to graduating with either major increase with AIj for minorities and non-minorities.21 Second, the net returns to academic preparation (the φ2jks) are larger for higher-ranked campuses, such as UC Berkeley and UCLA, compared to those for lower-ranked ones. This “return to college quality” holds for graduating with either a science or non-science major and for minorities and non-minorities. Third, our estimates for the net returns functions imply that, while higher ranked UC campuses like UC Berkeley and UCLA have a comparative advantage in graduating better prepared minority or non-minority students in either science or non-science majors relative to lower-ranked campuses, like UC Santa Cruz and UC Riverside, the lower-ranked campuses have a comparative advantage in graduating less- prepared students especially in the sciences. This is reflected in the positive intercept terms in the first panel when comparing all campuses except UCLA to UC Berkeley. This pattern is consistent with the relationship among colleges of different ranks illustrated in Panel (c) of Figure 1. Moreover, although not obvious from the coefficients themselves, the range of AIj scores for which lower-ranked campuses have this comparative advantage is greater in the sciences than in the non-sciences. These final two patterns suggest the potential for improving persistence rates of minorities in the sciences by re-allocating students from higher ranked to lower-ranked campuses. We develop this point in Section 4.2.
Finally, we turn to the estimates of the campus-specific components of the switching majors cost function in Table 6. Again these campus components are measured relative to those for UC Berkeley, which is normalized to zero. In contrast to the net returns, the costs of switching majors are not ordered according to campus rankings and differ by minority status. Among non-minorities, the costs of switching majors is highest at UC Berkeley but there is no pattern to the remaining coefficients. In contrast, minorities at Berkeley have similar switching costs to those at other campuses. Those only exception is UC Santa Barbara, which has slightly higher switching costs.
21The average of the campus-specific slopes of the net returns functions are remarkably similar, with 0.87 being the average for minorities of graduating with a science major and 0.77 for non-minorities and 0.89 being the average for minorities of graduating with a non-science major and 0.86 for non-minorities.
4.1 Adjusting for Selection and Equalizing Across-Campus Student Differences
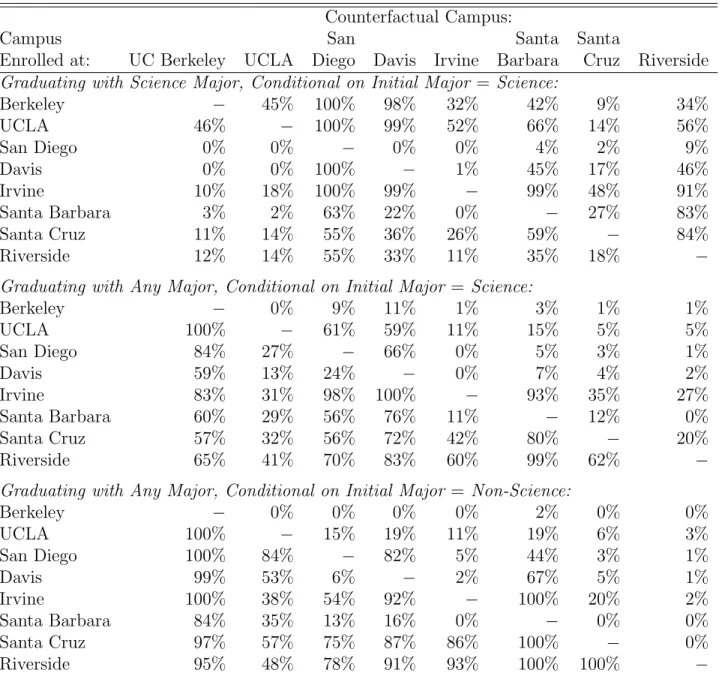
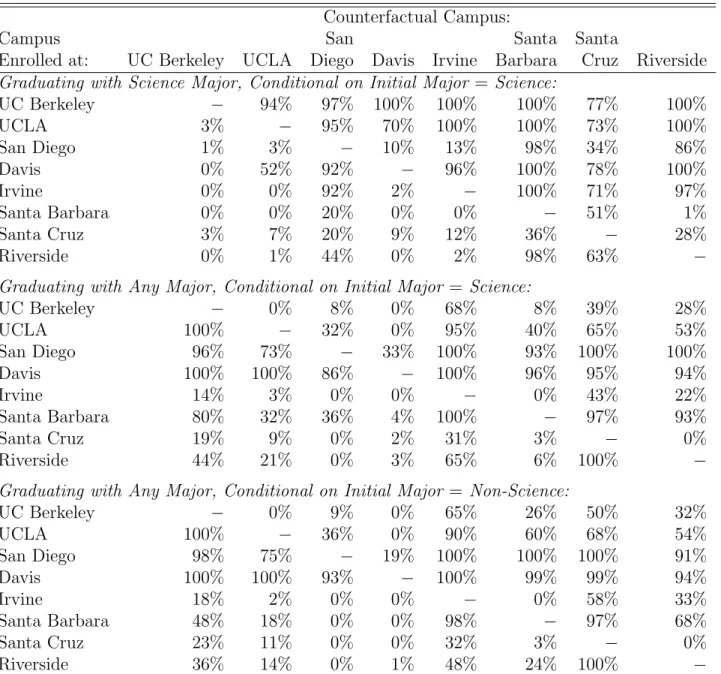
To further characterize the consequences of adjusting for selection for the across-campus differences in persistence and graduation rates of minorities and minorities, we use the param- eters of our model to predict these campus-specific rates for a common set of students, with the predictions then purged of selection. More precisely, we use the parameter estimates in Tables 6 and 14 to predict the shares of students who would graduate, in 5 and 4 years or less respectively, with a science major (di = m), a non-science major, (di = h), and any major (di = m or di = h) at each UC campus for each initial-major (jint) and SAT score quartile (Q) “cell.” Here we use all students who enrolled at one of the UC campuses and who are of that particular initial major and SAT score quartile. By using the same students in each cell to predict these shares for each campus, the resulting estimates are purged of the within-pair differences in students’ observed measures of academic preparation and family background that characterized the actual shares found in Tables 4 and 5, respectively. The selection-adjusted predicted shares based on a 5-year graduation criteria are found in Table 7 and in Table 8 for the 4-year graduation criteria. To facilitate their comparison with the observed (unadjusted) shares, the results in these tables are displayed in much the same format as is used in Tables 4 and 5.
We focus initially on the selection-adjusted shares for minorities in Table 7 that are based on the 5-year graduation criteria. In addition to the predicted shares by initial major and SAT quartile, we include in this table tabulations of the average differences in the selection-adjusted versus actual shares for each UC campus (“Ave. Diff.”) and of a measure of the differences in the across-campus heterogeneity of the shares (“Diff. in Across-Campus Hetero.”) for each quartile of the distribution of SAT scores.22 For almost every initial-major–SAT-quartile cell, adjusting for selection and equalizing the within initial-major–SAT-quartile cells student characteristics results in less across-campus heterogeneity in minority persistence rates in the sciences and non- sciences and in overall graduation rates compared to the shares actually observed at the UC campuses. More precisely, equalizing the within-cell differences in student academic preparation
22We use the coefficient of variation of shares for each SAT quartile to measure across-campus heterogeneity.
Note that this does not take into account differences in the size of the quartiles in the actual data.
and family background would tend toreduce the persistence rates at the higher ranked campuses and to increase them at the lower-ranked campuses. There are two notable exceptions to this pattern. Equalizing student preparation and family background of minorities would actually increase the across-campus heterogeneity in science persistence rates and the share of students switching into the sciences for those students in the bottom SAT quartile. This is due to the strong comparative advantage that less-selective campuses (i.e., UC Santa Barbara, UC Santa Cruz and UC Riverside) have over higher ranked ones (i.e., UC Berkeley and UC San Diego) in the net returns to graduating less-prepared minority students in the sciences.
The selection-adjusted shares based on a 4-year graduation criteria are displayed in Table 8.
There are several points to make about these estimates. First, as we found when comparing the actual persistence and graduation rates for minorities across the two graduation criteria (see Tables 4 and 5), the predicted science persistence and overall graduation rates for minorities are much lower when one uses a 4-year graduation criteria compared to the 5-year one. Furthermore, using the 4-year graduation criteria magnifies the comparative advantage that lesser-ranked campuses have over higher ones in graduating minorities in the sciences that would occur if minority student preparation and backgrounds were equalized across campuses. As seen in Table 8, our measure of across-campus heterogeneity increases with such equalization among students who initially select a STEM major for all but those in the top SAT quartile. While somewhat weaker, the same increase in across-campus differentiation would occur in the the non- STEM fields with such equalization. These findings suggest that the comparative advantage of lower-tiered campuses over higher-ranked ones in the net returns to minorities of persisting in the sciences is much stronger for “on-time” graduations.
Finally, the consequences of equalizing across-campuses differences in student preparation and family background within the initial-major–SAT-quartile cells for non-minorities are dis- played in Tables 15 and 16 for 5- and 4-year graduation outcomes, respectively. While the differences between the selected adjusted and unadjusted shares are qualitatively similar to those for minorities, the increase in heterogeneity is only found in the bottom quartile. The cross-race differences reflect in part the large differences between minorities and non-minorities across other dimensions besides SAT, such as parental income and education, and differences