DEEP STRUCTURE OF THE IONIAN SEA AND SICILY DIONYSUS
Cruise No. M111
October 10 - November 1, 2014, Catania (Italy) – Catania (Italy)
H. Kopp, M.-A. Gutscher, J. Crozon, D. Dellong, D. Graindorge, D. Klaeschen, I. Klaucke, F. Klingelhöfer, A. Krabbenhoeft, R. Kurzawski, T. Matthiessen, J. Mögeltönder, C. Papenberg, C. Peyronnet, C. Prunier, M. Rovere, H. Schröder, K.-P. Steffen,
D. Wehner, M. Wieprich, M. Wollatz-Vogt
Editorial Assistance:
DFG-Senatskommission für Ozeanographie
MARUM – Zentrum für Marine Umweltwissenschaften der Universität Bremen 2015
The METEOR expeditions are funded by the Deutsche Forschungsgemeinschaft (DFG) and the Bundesministerium für Bildung und Forschung (BMBF).
Editor:
DFG-Senatskommission für Ozeanographie
c/o MARUM – Zentrum für Marine Umweltwissenschaften Universität Bremen
Leobener Strasse 28359 Bremen
Author:
Prof. Dr. Heidrun Kopp Telefon: +49-431-600-2334 GEOMAR Helmholtz-Zentrum Telefax: +49-431-600-2922
für Ozeanforschung Kiel E-Mail: hkopp@geomar.de
Wischhofstr. 1-3, Geb. 8 24148 Kiel, Germany
Citation: H. Kopp, M.-A. Gutscher, J. Crozon, D. Dellong, D. Graindorge, D. Klaeschen, I. Klaucke, F. Klingelhöfer, A. Krabbenhoeft, R. Kurzawski, T. Matthiessen, J. Mögeltönder, C. Papenberg, C.
Peyronnet, C. Prunier, M. Rovere, H. Schröder, K.-P. Steffen, D. Wehner, M. Wieprich, M. Wollatz- Vogt (2015) DEEP STRUCTURE OF THE IONIAN SEA AND SICILY DIONYSUS – Cruise No.
M111 – October 10 – November 1, 2014 – Catania (Italy) – Catania (Italy). METEOR-Berichte, M111, 43 pp., DFG-Senatskommission für Ozeanographie, DOI:10.2312/cr_m111
_________________________________________________________________________________
ISSN 2195-8475
Table of Contents page
1 Summary ... 3
2 Participants ... 4
3 Research Program ... 6
3.1 Introduction and Aims of the Program ... 6
3.2 Tectonic Setting of the Ionian Sea and Surrounding Collision Zones ... 7
4 Narrative of the Cruise ... 11
5 Preliminary Results ... 13
5.1 Bathymetry ... 13
5.2 Seismic Surveys ... 19
5.2.1 Seismic Instrumentation ... 19
5.2.2 Seismic Refraction and Reflection Data ... 22
6 Ship’s Meteorological Station ... 36
7 List of Stations M111 ... 38
8 Data and Sample Storage and Availability ... 41
9 Acknowledgements ... 41
10 References ... 41
1 Summary
The origin of the Ionian Sea lithosphere and the deep structure of its margins remain a little investigated part of the Mediterranean Sea. To shed light on the plate tectonic setting in this central part of southern Europe, R/V METEOR cruise M111 set out to acquire deep penetrating seismic data in the Ionian Sea. M111 formed the core of an amphibious investigation covering the Ionian Sea and island of Sicily. A total of 153 OBS/OBH deployments using French and German instruments were successfully carried out, in addition to 12 land stations installed on Sicily, which recorded the offshore air gun shots.
The aim of this onshore-offshore study is to quantify the deep geometry and architecture of the Calabria subduction zone and Ionian Sea lithosphere and to shed light on the nature of the Ionian Sea crust (oceanic crust vs. thinned continental crust). Investigating the structure of the Ionian crust and lithospheric mantle will contribute to unravel the unknown ocean-continent transition and Tethys margin. Analyzing the tectonic activity and active deformation zones is essential for understanding the subduction processes that underlie the neotectonics of the Calabrian subduction zone and earthquake hazard of the Calabria/Sicily region, especially in the vicinity of local decoupling zones.
Zusammenfassung
Die Ionische See und die darunterliegende Lithosphäre sind bis heute ein wenig untersuchtes Gebiet im Mittelmeer. Für eine verbesserte Kenntnis der Plattengeometrie wurden im Rahmen der Meteor Ausfahrt M111 seismische Daten süd- und südöstlich von Sizilien und Kalabrien akquiriert. M111 formt das Kernstück eines amphibischen Experimentes mit Transekten, die vom Ionischen Tiefseebecken bis auf Sizilien führen. Insgesamt 153 OBS/OBH Einsätze mit französischen und deutschen Geräten wurden erfolgreich durchgeführt und durch zwölf Landstationen auf Sizilien ergänzt, um die Luftpulser-Schüsse zu registrierten.
Im Rahmen dieser küstenübergreifenden Studien soll die tiefe Geometrie und Architektur der kalabrischen Subduktionszone und Lithosphäre unterhalb der Ionischen See abgebildet werden und der Aufbau der Ionischen Kruste untersucht werden, um zwischen Charakteristika ozeanischer und ausgedünnter kontinentaler Kruste differenzieren zu können. Die Modellierung der Daten soll u.a. Hinweise auf die Lokation des Ozean-Kontinentübergangs liefern, sowie Einblicke in die Subduktionsprozesse und Neotektonik der kalabrischen Subduktionszone bieten und damit einen Beitrag zu regionalen Gefährdungsstudien in der Region Kalabrien/Sizilien leisten, insbesondere im Bereich aktiver Störungs- und Entkopplungszonen.
2 Participants
Name Institution
Prof. Dr. Heidrun Kopp Chief Scientist GEOMAR
Dr. Marc-André Gutscher Co-Chief Scientist IUEM
Jacques Crozon Seismics IFREMER
David Dellong Seismics IUEM
Dr. David Graindorge Seismics IUEM
Dr. Dirk Klaeschen Seismics GEOMAR
Dr. Ingo Klaucke Bathymetry GEOMAR
Dr. Frauke Klingelhöfer
Dr. Anne Krabbenhoeft Seismics
Seismics, Bathymetry IFREMER
GEOMAR Robert Kurzawski
Torge Matthiessen Jasmin Mögeltönder Dr. Cord Papenberg
Seismics, Tectonics Seismics
Seismics Seismics
GEOMAR GEOMAR GEOMAR GEOMAR Christophe Peyronnet
Christophe Prunier Dr. Marzia Rovere Henning Schröder Klaus-Peter Steffen
Seismics Seismics Bathymetry Seismics Seismics
IFREMER IUEM ISMAR-CNR GEOMAR GEOMAR
Daniel Wehner Seismics CAU
Margit Wieprich Seismics GEOMAR
Martin Wollatz-Vogt Seismics GEOMAR
Fig. 2.1: Participants of the METEOR Cruise M111.
Participating Institutions:
Christian-Albrechts Universität zu Kiel Christian-Albrechts-Platz 4
24118 Kiel, Germany
DWD Deutscher Wetterdienst Bernhard-Nocht-Straße 76 20359 Hamburg, Germany IFREMER
Dept. of Marine Geosciences ZI de la Pointe du Diable CS 10030
29280 Plouzané
GEOMAR
Helmholtz-Zentrum für Ozeanforschung Kiel Wischhofstr. 1-3
24148 Kiel, Germany ISMAR-CNR
Institute of Marine Sciences - National Research Council
Via Gobetti 101 40129 Bologna, Italy IUEM
Laboratoire Domaines Océaniques UMR6538, Univ. Brest/ CNRS
Place Nicolas Copernic 29280 Plouzané
3 Research Program
3.1 Introduction and Aims of the Program (H. Kopp, M.-A. Gutscher)
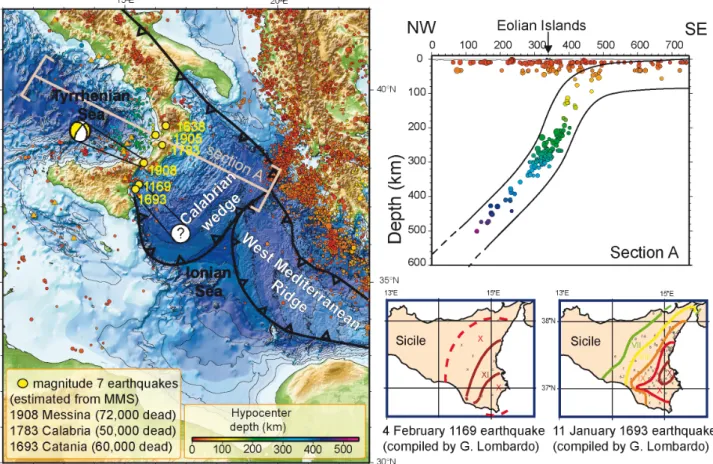
In the Central Mediterranean, Mesozoic oceanic lithosphere (formerly part of the Tethys) subducts beneath Greece and Southern Italy generating abundant seismicity. This part of the Mediterranean has been repeatedly struck by devastating earthquakes and tsunamis in the past 5 centuries and is one of the most seismically hazardous regions in Europe. The Catania earthquake of 1693 (60.000 victims) (Bianca et al., 1999) and the Messina earthquake of 1908 (72.000 casualties) (Bottari et al., 1989) both generated tsunamis with amplitudes of 5 to 10 m (Tinti et al., 2001; Billi et al., 2008). The origin of some of the most destructive earthquakes in the region remains uncertain. In addition, the exact location and deep geometry of the Calabria subduction zone, which is closely linked to the regional seismicity, remain unclear.
Furthermore, the nature of the Ionian Sea and its margins are the subject of ongoing debate, with two contradictory interpretations concluding that the Ionian Sea is floored I) by Tethyan oceanic lithosphere or alternatively II) by thinned continental crust.
Fig. 3.1 (left) Location map of Southern Italy with relief (topography and bathymetry), recent seismicity (USGS PDE Catalog M>4, 1973-2010) and large historical earthquakes. (upper right) Seismicity cross-section showing the NW dipping Wadati-Benioff zone related to the Calabria-Tyrrhenian subduction. (lower right) macro-seismic maps of the Catania earthquakes of 1169 and 1693 (intensity X - XI) (Barbano, 1985). The isoseismal pattern (open to the sea) as well as the observed tsunami suggests a source region offshore.
In summary, the scientific goals of this joint French-German-Italian cruise are to:
Obtain an image of the present day crustal and lithospheric architecture of the plate boundary region between Africa and Eurasia. Prior to cruise M111 there were no modern wide-angle seismic data available to image this plate boundary even though it is located in the heart of Europe. Our aim was to map the exact location or geometry at depth of the Calabrian subduction zone.
Unravel the transition from the continental domain to the oceanic portion of the Ionian Sea. The nature and thickness of the crust in the Ionian Sea and the Tethys margin remain unknown, despite the fact that this may be one of the oldest margins on the planet.
Image the present day wedge geometry and deformation pattern of the margin, including the geometry of the megathrust-fault at depth to improve the regional hazard assessment associated with seismic activity and tsunamigenic threats.
To shed light on these issues, we obtained seismic and hydro-acoustic images of the present- day architecture of the Ionian crust and adjacent Calabrian wedge and subduction This involved the acquisition of refraction seismic data with ocean-bottom hydrophones (OBH) and ocean-bottom seismometers (OBS) along five transects (DY-P01 through DY-P05) that cover nearly all Italian ZEE waters; from the Ionian abyssal plain to the Sicily and Calabrian coasts and from the Sicily Channel to the eastern Calabrian wedge. Two profiles (DY-P03 and DY-P04) continued onshore with seismometers deployed along two transects on northeastern and southeastern Sicily. This amphibious approach provided new coverage of the transition between Sicily and the Calabrian fold-and-thrust belt. Post-cruise work is foreseen to integrate the onshore seismic data, as well as existing geological data on the neo-tectonics of the Ionian Sea and its margins. Line DY-P03 covered the lower slope of the eastern Calabrian wedge from close to the intersection with the W Mediterranean Ridge to the mid-slope region and due to time constraints only 6 seafloor stations were deployed. The second long profile, DY- P01 begins in the Sicily Channel, crosses the Malta escarpment and trends in a WSW-ENE direction towards the eastern lobe of the accretionary wedge with a total of 52 seafloor stations deployed along the line.
3.2 Tectonic Setting of the Ionian Sea and Surrounding Collision Zones (M.-A. Gutscher, M. Rovere, D. Graindorge)
The Southern Italy region straddles the Africa (Nubia) - Eurasia plate boundary, where overall convergence is slow (<1cm/yr) and where a mosaic of micro-plates and blocks are thought to occupy the space between the two major plates (D’Agostino et al., 2011; Devoti et al., 2011;
Palano et al., 2012). According to the geodetic data, slow, but significant convergence (≥3mm/yr) occurs between the Hyblean platform (SE Sicily) and NE Sicily (the Peloritan Mountains domain) and slow (3-5 mm/yr) SE motion of the Calabrian block with respect to the Apulian and Hyblean domains. Most of this motion can be related to the Calabria subduction zone and to the SE-directed roll-back of the Calabria - Peloritan block. Yet uncertainty remains how these domains continue offshore, with one model proposing that the Ionian Sea, together
with the Hyblean plateau to the SW and the Apulian domain to the NE, forms one single domain (D’Agostino et al., 2011) (Fig. 3.2 left).
Fig. 3.2 Present day kinematics of the Sicily - Calabria - Ionian Sea region from GPS observations, (left) GPS displacement field in a Nubia fixed reference frame (D’Agostino et al., 2011). (right) GPS displacement field in a Hyblea fixed reference frame with a map of currently identified faults onland and offshore (Palano et al., 2012). These two studies, as well as another (Devoti et al., 2011) conclude that there is at least 3mm/yr of relative motion of the Calabria block towards the SE, with respect to the Hyblean platform
There is a general consensus that the geodynamic evolution of Southern Italy was largely controlled by a NW dipping subduction zone beneath S France and Iberia, which initiated around 35 Ma. As the slab of Tethys oceanic lithosphere between Africa and Europe retreated to the SE it opened a series of back-arc basins and left several small continental blocks in its wake (e.g.
Corsica-Sardinia) (Malinverno and Ryan, 1986; Faccenna et al., 2004). Today most of the oceanic lithosphere has subducted and there remains a narrow corridor (at most 300 km and perhaps as little as 150 km) connecting the (most probably) oceanic lithosphere beneath the Ionian Sea to the slab and Wadati-Benioff zone beneath the SE Tyrrhenian Sea (Wortel and Spakman, 2000; Neri et al., 2009; Giacomuzzi et al., 2012).
The present-day activity of the subduction is the subject of ongoing debate. Some researchers advocate slow but continuing subduction as the cause of recent deformation observed in shallow marine sediments at the seafloor (Gutscher et al., 2006; Polonia et al., 2011). However, other workers pointing out the absence of thrust type earthquakes in the forearc (Fig. 3.1) consider that subduction is no longer active. Indeed, it has been argued that slab detachment occurred recently, around 0.5 Ma (Goes et al., 2004) and which could provide an explanation for the rapid uplift of Quaternary marine terraces in Calabria (Westaway, 1993). Other explanations, related to mantle flow around a slab edge and the genesis of Mount Etna above this asthenospheric window have been offered as well (Gvirtzman and Nur, 1999). Thus, we can see that the current geodynamics of the subduction zone remains a topic of heated discussion.
The origin of the Ionian Sea and its margins are also the subject of debate. While many workers consider it to be Tethyan oceanic lithosphere (de Voogd et al., 1992; Faccenna et al., 2004;
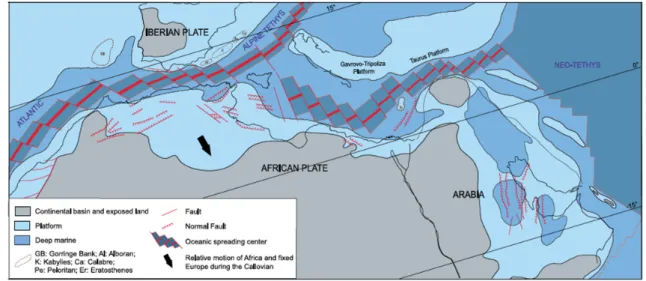
Gallais et al., 2011) others have argued for thinned continental crust flooring the Ionian Sea (Finetti, 1982, Hieke et al., 2005). Furthermore, the precise age and exact direction of rifting are also controversial, with some interpreting the Malta Escarpment as a major transform type fault (Frizon de Lamotte et al., 2011; Gallais et al., 2011) (Fig. 3). Other workers (Catalano et al., 2001; Chamot-Rooke et al., 2005) interpreted the Apulia escarpment to be the conjugate of the Malta escarpment, which means NE-SW directed rifting and seafloor spreading (roughly orthogonal to the other interpretation). For these two propositions, there are major differences for the expected width of the continent-ocean transition zone, the amount and location of crustal thinning (and possible mantle exhumation). These models will also have strong implications for the associated basins and their subsidence history and thus for the hydrocarbon potential of these very old (Mesozoic) continental margins. The most promising method to resolve these conflicting interpretations is a dedicated seismic refraction study of the Tethys margins of the Ionian Sea as conducted during the M111 cruise.
Fig. 3.3 Paleo-geographic reconstruction of the Tethys domain during the Triassic-Jurassic (Frizon de Lamotte et al., 2011). Note the Malta Escarpment (east of Sicily) is interpreted to be a transform margin, with NW-SE oriented seafloor spreading in the Neo-Tethys (modern day Central and Eastern
Mediterranean).
As noted above, the present day configuration of the Ionian Sea and Calabrian subduction is the result of the rollback of the Ionian Sea slab to its current position (Faccenna et al., 2004;
Polonia et al., 2011; Gallais et al., 2012). This evolution involved the detachment of the Ionian slab from the adjacent continental lithosphere of the Hyblean (SE Sicily – Malta) platform (Figure 3.4). However, the exact location of this slab-edge tear fault (STEP) is highly controversial (Argnani, 2009; 2014; Gallais et al., 2013; 2014).
One of the major objectives of this survey will be to determine the crustal scale architecture of the East Sicily margin and Malta Escarpment. There are several major faults mapped offshore, including the Malta escarpment and a possible lithospheric scale tear fault further east. Indeed, the location of the lateral slab tear allowing the Ionian Sea slab to separate from the adjacent continental domain (Hyblean platform) and descend into the mantle is the topic of debate (Fig.
3.4). Several authors consider the Malta Escarpment to be an active normal fault, and the current site of the slab-edge tear fault or STEP - Subduction Transform Edge Propagator fault (Govers and Wortel, 2005; Argnani and Bonazzi, 2005). Other workers consider this to be the likely source fault for the 1693 Catania earthquake (Piatanesi and Tinti, 1998 ; Tinti et al. 2001). Most agree that the Malta Escarpment is a major lithospheric structure marking the boundary between the unthinned continental crust of the Hyblean platform to the west and a deep marine domain further east (Makris et al., 1986; Nicolich et al., 2000; Argnani and Bonazzi, 2005).
Fig. 3.4 Schematic 3-D diagram showing how slab roll-back induces the propagation of a slab edge tear fault or STEP into the foreland, allowing the oceanic slab to detach itself from the adjacent continental domain (after Gallais et al., 2013).
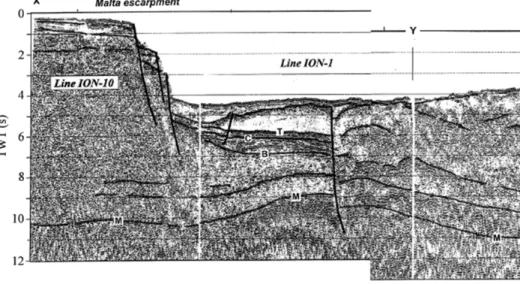
Numerous workers, however, think that the major slab edge tear fault (STEP) is located 20-50 km further east than the Malta escarpment along a major N150°E trending fault (Hirn et al., 1997; Nicolich et al., 2000; Gallais et al., 2013).
Fig. 3.5 Seismic profiles ION-10 et ION-1 (Nicolich et al., 2000) showing the Malta escarpment and a lithospheric scale slab-edge tear fault.
4 Narrative of the Cruise (H. Kopp, M.-A. Gutscher)
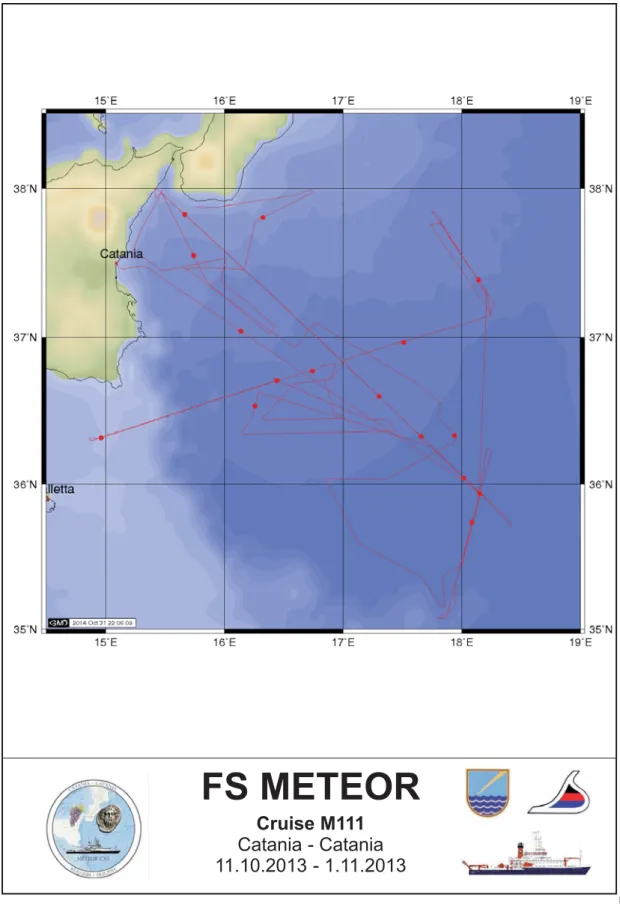
The cruise M111 started on October 10, 2014 whenFSMETEOR left the port of Catania, Italy at 09:00h. Onboard was an international group of scientists from Italy, France, and Germany. The cruise track is displayed in Figure 4.1. The 23 hour transit to our first seismic station on profile DY-P04 was used to test our release units and to conduct a sound-velocity profile using an expendable sound velocity probe (XSV-02) to a depth of 2000m. During transit, we were also able to fill some remaining gaps in the swath-mapping grid of the Ionian Sea. At 08:00h on Oct.
11, we began deploying 61 Ocean Bottom Seismometers and Hydrophones (OBS/OBH) along profile DY-P04 at an average spacing of 2.8 nm; all instruments (OBH401 to OBS461) were deployed within 26 hours. Subsequently, we continued our swath bathymetric survey of the Calabrian Arc. On Oct. 13, communication with our partners onshore in Italy verified that all onshore stations were ready for recording and that we could commence with the shooting. The air gun array consisting of 6 G-gun clusters with a total volume of 84 l was fired along the 174 nm long spread of seismometers with a trigger interval of 60 s at the ship’s average speed of 4.5 kn, resulting in a shot spacing of 110 m. In addition, a 4-channel streamer was deployed on all seismic profiles during cruise M111. Shooting started at 08:00h and was preceded by seismic survey mitigation measures for the protection of marine mammals. Shooting terminated at 06:20h on Oct. 15 and subsequently instruments along profile DY-P04 were recovered.
Recovery of OBH 447 failed and will be attempted again on Oct. 31 after the automated time release. All other instruments were recovered by 14:00h on Oct. 17 and have recorded properly.
After a short transit to profile DY-P03 we deployed 25 instruments at a spacing of 3.2 nm between Oct. 17, 19:30h and Oct. 18., 06:00h. Shooting above OBH301-325 along this 77 nm long profile was achieved between Oct. 18., 10:00h and Oct. 19., 08:00h. This line was also recorded by the onshore stations installed on Sicily. Communication with the scientists onshore verified the correct functioning of the onshore seismometers. Instrument recovery commenced on Oct. 19., 10:00h and lasted until Oct. 20., 02:00h. OBH 316 did not release and we will return to its position for the automated time release on Oct. 31, 2014.
After transit to profile DY-P01 we began instrument deployment on Oct. 20., 10:00h. A total of 52 seafloor stations were spaced at a distance of 3.3 nm along the 317 nm spread, which subsequently was shot starting on Oct. 21., 09:45h. Due to adverse weather conditions with gales up to 10 Bft in the Ionian Sea we interrupted the seismic survey on Oct. 22 at 11:00h and reverted to bathymetric swath mapping of a missing segment in the Ionian Sea seafloor map about 20 nm south of profile DY-P01. Weather conditions calmed on Oct. 23 so that we could recommence shooting and reflection seismic data acquisition along the southwestern segment of DY-P01 starting at 16:00h. Shooting was terminated the following day at 10:30h, followed by instrument recovery. On the track back along the seismic profile we reverted south on Oct. 25, 16:00h to finish the bathymetric coverage that we had commenced during the period of deteriorated weather. The following morning we continued the recovery of the seafloor stations, which was terminated on Oct. 27, 00:00h. After a four-hour transit to the northern termination of profile DY-P02 we deployed a total of 6 instruments at a spacing of ~6 nm between 04:00-
Fig. 4.1 Cruise track M111.
08:00h on Oct. 27. Shooting at 4.5kn commenced at 09:00h at a shot interval of 60 s; the streamer was deployed along the profile. Shooting along the 42 nm long line was terminated at 19:30h the same day, followed by instrument recovery. All 6 instruments were securely recovered by 04:00h, Oct. 28. Subsequently, we sailed south and after a transit of 6.5 hrs laid out
FS METEOR
Cruise M111 Catania - Catania 11.10.2013 - 1.11.2013
8 instruments spaced at 4 nm along profile DY-P05. This profile covers the Ionian Sea abyssal plain and shooting along the 84 nm transect was conducted between 19:30h on Oct. 28 and 10:00h on Oct. 29. Instrument recovery was completed by 22:00h on Oct. 29. Throughout the night and the following day we conducted swath bathymetric profiles to fill gaps in bathymetric coverage of the region. On Oct. 31 at 04:30h we returned to OBS 317 and OBH 447, both of which did not release during recovery of profile DY-P03 and profile DY-P04. The automatic time release for these stations was set to 05:30h UTC and 07:00h UTC, respectively.
Unfortunately, neither station appeared on the surface, despite additional efforts to release the anchor. We suspect a malfunction of the release unit. At 10:45h we returned to our bathymetric profile, which was terminated at 23:30h on Oct. 31.
On the morning of 01.11.14 at 08:00 the pilot entered the R/V METEOR, and soon after R/V METEOR berthed in Catania, terminating cruise M111.
5 Preliminary Results 5.1 Bathymetry
(I. Klaucke, M. Rovere, M.-A. Gutscher)
Two multibeam echosounder systems are available onboard R/V METEOR for bathymetric mapping of the seafloor: a KONGSBERG EM122 for deep-water operations and a KONGSBERG
EM710 for shallow water. During R/VMETEOR cruise M111 only the KONGSBERG EM122 has been used.
Basic components of the EM122 system are two linear transducer arrays in a Mills cross configuration with separate units for transmitting and receiving. The nominal sonar frequency is 12 kHz with an angular coverage sector of up to 150° and 256 beams per ping. The emission beam is 150° wide across track, and 1° along track direction. The reception is obtained from 256 beams, with widths of 2° across track and 20° along track. Thus, the actual footprint of a single beam has a dimension of 1° by 2°. Achievable swath width on a flat bottom will normally be up to six times the water depth depending on the character of the seafloor. The angular coverage sector and beam pointing angles may be set to vary automatically with depth according to the achievable coverage in order to maximize the number of usable beams. The beam spacing can be equidistant or equiangle at the seafloor. A high-density mode generating 432 independent depth soundings per ping is also available. Using 2-way-travel-time and beam angle known for each beam, and taking into account the ray bending due to refraction in the water column by sound speed variations, depth is calculated for each beam. A combination of amplitude (for the central beams) and phase (slant beams) is used to provide a measurement accuracy that is practically independent of the beam-pointing angle. The EM122 also has a dual-swath option, which means that two pings (rather than one) are simultaneously transmitted and recorded, one slightly tilted forward and one backward, thus enabling a denser bottom coverage along track, or allowing for a higher survey speed. Pulse generation modes can be either CW (continuous wave) in shallow modes or FM (frequency modulated) in deep modes. FM or “chirp” pulses transmit more energy to the water, thus enabling greater ranges of the beams, in turn leading to better across-track coverage of the seafloor, particularly at greater depths. On the other hand, systems using FM
pulses require better performance of the motion reference unit because the acoustic signals travel a longer time through the water while the vessel is moving. Consequently, the motion sensor of R/V METEOR was recently upgraded to a Seapath-300, an inertial motion-reference unit, which is improved by GPS-signals.
Multibeam Data Acquisition and Processing
Prior to bathymetric mapping with the Simrad EM122 system a sound velocity profile was acquired using an expendable XSV probe down to 2000 metres water depth, beyond which the profile has been extrapolated. The sound velocity profile (Fig. 5.1) shows a very smooth trend with high average sound velocity due to the high salinity of Mediterranean seawater. The profile is also in good agreement with average sound velocity profiles of the study area for the month of October (LEVITUS database).
Fig. 5.1 Sound velocity profile retrieved from an XSV probe (to 2000 m depth) and extrapolated using the LEVITUS database.
Multibeam data during R/V METEOR cruise M111 were mainly acquired during the deployment of the OBH/OBS and during seismic data acquisition. Multibeam data were also recorded during transit and during a few lines of dedicated bathymetric data acquisition. Survey speeds consequently varied between 4 kn during seismic data acquisition and 12 kn during transit. For most of the survey the swath angle was set to 130° in order to minimize noise on the outer beams and to increase ping rate, which further improves data quality. Due to mostly calm weather the data quality was generally quite good, but interference patterns could be observed at the transition to the outermost beam sector. The range of water depths encountered during the
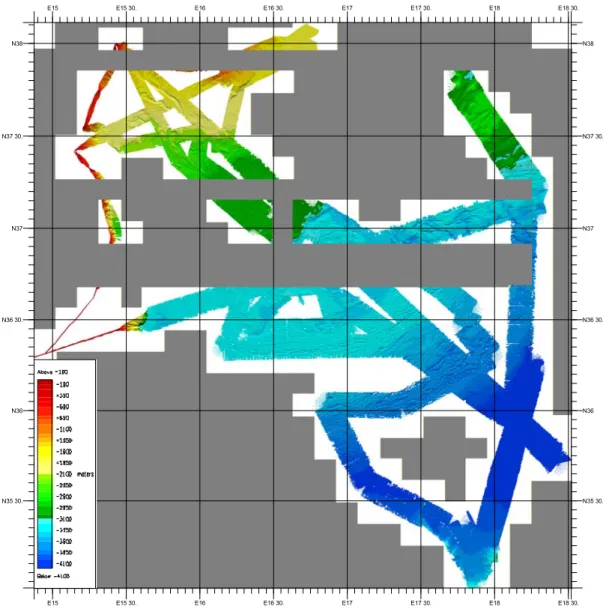
cruise ranged from 27 metres just off the coast of Sicily to about 4100 metres in the centre of the Ionian abyssal plain (Fig. 5.2). Both varying survey speeds and large depth range resulted in highly varying sounding densities. The multibeam data have been processed onboard using the Caraibes software package from IFREMER with a variety of different automated data cleaning functions as well as hand-picked data editing. The data have then been gridded to a 50 metres grid cell size, which slightly overestimates soundings density in deep water while soundings density in water depths shallower than 2000 metres would allow a smaller grid cell size.
Fig. 5.2 Swath bathymetric data acquired during cruise M111. Maximum depth is about 4100m in the abyssal plain in the SE corner.
E15 E15 30. E16 E16 30. E17 E17 30. E18 E18 30.
E18 30.
N35 30.
N36 N36 30.
N37 N37 30.
N38 N38
N37 30.
N37
N36 30.
N36
N35 30.
E15 E15 30. E16 E16 30. E17 E17 30. E18
Preliminary interpretation
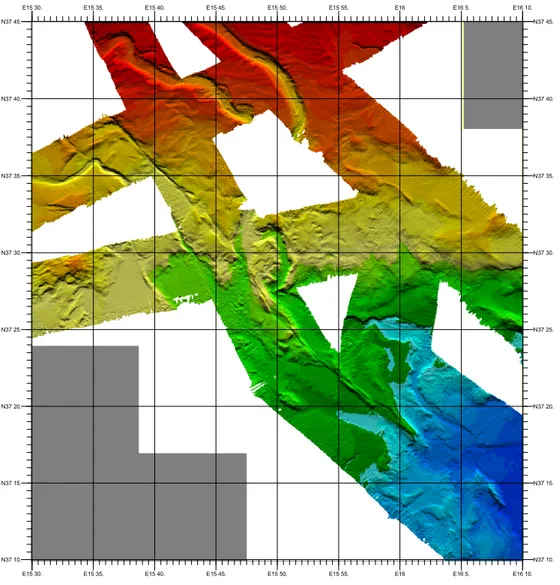
Bathymetric data were mainly acquired for the need of correctly locating the OBH/OBS positions as well as the airgun shotpoints and their resulting water wave. The bathymetric profiles therefore followed the seismic lines and show surface expressions of many of the features that compose the Ionian accretionary wedge. The southernmost profile crossing the accretionary wedge shows nicely the increasing degree of folding expressed as elongate, symmetrical salt-cored anticlines from the southeast to the northwest (Fig. 5.3). Initial folds in the southeast are only up to a few tens of metres high with narrow crests that extend beyond the surrounding seafloor. The crests can be correlated laterally for several kilometres. Further to the northwest the seafloor changes and shows up to 200 m deep, irregular and very elongate depressions that can be followed for up to several tens of kilometres. Even further to the northwest, the depressions are still visible but are quite rare and appear to be less continuous.
Fig. 5.3 Shaded hill relief map of the south central region surveyed showing the increasing degree of deformation in the Calabrian accretionary prism. In the south, NE-SW trending anticlinal ridges form by thrusting and folding in response to NW-dipping subduction and the SE-ward push of the Calabrian backstop towards the Ionian abyssal plain foreland. The morphology in the north is dominated by irregular elongate troughs, cutting through a plateau like seafloor.
E17 30. E17 35. E17 40. E17 45. E17 50. E17 55. E18
E18
N36 10.
N36 15.
N36 20.
N36 25.
N36 30.
N36 N36 5.
E17 30. E17 35. E17 40. E17 45. E17 50. E17 55.
N36 30.
N36 25.
N36 20.
N36 15.
N36 10.
N36 5.
N36
Much closer to Sicily and Calabria around 37°30'N / 16°E strike-slip faulting is well documented in the bathymetry (Fig. 5.4) and many of the faults appear to have guided the submarine canyons and channels dissecting this part of the slope. One of these faults that are characterized by either a clear step in the bathymetry or a small, very elongate depression cutting through various seafloor structures can be followed for at least 50 kilometres. Finally, at the foot of the steep Calabrian slope, a saucer-shaped structure with 1 km in diameter has formed (Fig. 5.5). The almost circular structure has a flat top with an outer rim that extends a few metres above the central area. The structure as a whole, extends for up to 30 metres above the surrounding seafloor that appears to form a much larger, gentle depression. This structure shows typical elements of a mud-pie type mud volcano, similar to those reported somewhat further east in earlier studies (Praeg et al., 2009; Ceramicola et al., 2014). Further to the west of the mud pie several irregular, doming structures that extend for up to 200 metres above the surrounding seafloor are also present at the foot of the Calabrian slope. Many of them show evidence of mass wasting (small submarine landslides) at their summit and southern flanks (Fig. 5.5). Some of them show the presence of a moat at the foot of the structure. Their elevation beyond the general slope trend suggests that these structures could be additional mud volcanoes or, at least structures that are underlain by salt or mud diapirs.
Fig. 5.4 Shaded hill relief map of the west-central region surveyed showing a 60 km long strike slip fault and linear to sinuous submarine canyons in the northern part of the map.
E15 30. E15 35. E15 40. E15 45. E15 50. E15 55. E16 E16 5. E16 10.
N37 45.
E16 10.
N37 45.
N37 10.
N37 15.
N37 20.
N37 25.
N37 30.
N37 35.
N37 40. N37 40.
N37 35.
N37 30.
N37 25.
N37 20.
N37 15.
N37 10.
E15 30. E15 35. E15 40. E15 45. E15 50. E15 55. E16 E16 5.
Fig. 5.5 Shaded hill relief map from the northern portion of the survey region near Calabria showing (on the right) a mud-pie style mud volcano (tentatively named Meteor MV) with a 1km diameter and rising about 30m above the surrounding seafloor. To the left a mound with an asymmetric semi-circular depression appears to be another mud volcano, with a slight trough (flexural moat) surrounding it on three sides (which we propose naming Dionysus MV).
5.2 Seismic Surveys
5.2.1 Seismic Instrumentation
(F. Klingelhoefer, C. Papenberg, J. Crozon, A. Krabbenhoeft, D. Graindorge, K.-P.
Steffen, T. Matthiessen, H. Kopp,)
A total of 32 MicrOBS+ from the IFREMER pool and 27 OBH and 3 OBS instruments from the GEOMAR pool were available for M111. These instruments were deployed at a total of 153 sites for refraction seismic profiling during the M111 cruise.
MicrOBS
In order to increase the number of Ocean Bottom Seismometers (OBS) available, in 2002 IFREMER began designing a new generation of small, low-cost ocean-bottom seismometers for wide-angle seismic use, which are easy to deploy (Figure 5.6).
Fig. 5.6 Left: MicrOBS+ on deck. Right: schematic diagram of MicrOBS+.
Four basic new ideas have emerged during the development of the new generation of MicrOBS as compared to the older OBS:
Integration of acquisition and instrument release: This integration is possible due to the use of a broadband hydrophone which allows recording of the low frequency signal from airgun shots or earthquakes (from 0.1 Hz up to several 100 Hz) as well as the high frequency release signal (about 10 kHz). This significantly reduces the weight of the instrument and therefore facilitates its handling.
Rechargeable batteries: To avoid the opening and resealing of the instrument, which remains a delicate operation at sea, a rechargeable battery pack is used in the MicroOBS.
Data download by USB cable: The data are downloaded from the instrument via a USB 1.1 cable connection, to avoid opening and closing the instrument between successive deployments at sea.
Size reduction: The substantial size reduction of the MicrOBS compared to the older OBS was possible due to the three points mentioned above, the integration of the electronics with the release, the reduction of the battery weight and the download of the data. Thus, it was possible to fit the complete instrument into a 13'' glass sphere. The complete mass of the instrument is only 20 kg plus 20 kg for the anchor.
In 2006 Sercel started producing a new generation of MicrOBS instruments with the objective to allow for longer deployments during wide-angle seismic surveys (Figure 5.6). In order to contain a larger amount of batteries, the instrument named MicrOBS+ is housed in a 17-inch glass sphere. The disk space was enlarged to 8 gigabytes resulting in a deployment length of up to 31 days with 24 days of recording at a sampling rate of 0.004 s. Acquisition electronics, geophone and hydrophone are identical with the original MicrOBS. The weight of the instruments is 30 kg and an anchor weight of 25 kg is used for the deployment. During the cruise 32 MicrOBS+ where deployed.
The GEOMAR OBH
The first GEOMAR Ocean Bottom Hydrophone was built in 1991 and tested at sea in January 1992. This type of instrument has proved to have a high reliability; there have been more than 6500 successful deployments since 1991.
The principle design and a photograph of the instrument during deployment are shown in Figure 5.7. The design is described in detail by Flueh and Bialas (1996).
Fig. 5.7 Principle design of the GEOMAR OBH (right panel, after Flueh and Bialas, 1996) and the instrument upon deployment (left panel).
The system components are mounted on a steel tube, which holds the buoyancy body on its top. The buoyancy body is made of syntactic foam and is rated, as are all other components of
the system, for a water depth of 6000 m. Attached to the buoyant body are a radio beacon, a flash light, a flag and a swimming line for retrieving from aboard the vessel. The hydrophone for the acoustic release is also mounted here. The release transponder is a model RT661CE or RT861 made by IXSea, or alternatively a K/MT562 made by KUM GmbH. Communication with the instrument is possible through the ship's transducer system, and ranges of 4 to 5 miles release and range commands are successful. For anchors, we use pieces of railway tracks weighing about 40 kg each. The anchors are suspended 1 to 2 m below the instrument. The sensor is a HTI-01-PCA hydrophone from HIGH TECH INC, and the recording device is an MLS recorder of SEND GmbH, which is contained in its own pressure tube and mounted below the buoyant body opposite the release transponder (see Fig. 5.8).
Seismic sources
During cruise M111 reflection seismic data were acquired simultaneously with wide-angle refraction data acquisition. The source was a 84-liter G-Gun array. Reflection data were recorded on a 4-channel streamer. Figure 5.8 provides an overview of the system setup during R/V METEOR Cruise 111.
Fig. 5.8: Deck with seismic gun and streamer setting during Cruise M111.
G-Gun Array
The source used during surveying was a G-Gun array manufactured by Sercel Marine Sources Division (former SODERA) and Seismograph Services Inc. and consisted of 2 sub-arrays (Fig.
5.8). Six guns were set up in 3 clusters. Each cluster comprises G-Guns of 4x8 liters and in the middle either 2x6 liters or 2x4 liters (see figure). The cluster arrangement provides a good primary-to-bubble signal ratio. Operating all twelve guns simultaneously provides a total volume of 84 liters (5440cu.in.). New airgun-deployment rails mounted on R/V METEOR prior to the cruise were used to deploy G-Gun sub-arrays on aft port and starboard sides of the ship. These rails were used for the first time on R/VMETEOR and they soon proved to be a major asset for handling the heavy gear during deployment and recovery operations. The arrays were towed 50 meters behind the ship's stern and 8 meters below the sea-surface. All guns were shot at ~190
Streamer Winch
2,645 m Meteor GPS 48,023 m
65 m, 4 channels Lead-In150 m
bar. Shooting interval was 60 seconds for all profiles resulting in a shot point distance of 110 meters at 4.5 knots. The guns worked very reliably during the entire cruise.
Trigger unit
To trigger the G-guns a time-signal was generated, and fed into the Longshot trigger box. In addition, the trigger pulses were stored on a MBS recorder and displayed in real time to obtain shot times. The Clock Time Break (CTB) of the Longshot device is a TTL pulse that is 5 ms wide and represents the aim-point or the time when the guns are fired. This aim-point was set to be 60 ms after the trigger pulse. All guns were operated in auto mode; thus, guns are automatically tuned to aiming point. Exact position calculation for each shot is done by later post-processing using shot times (stored in UTC time on the MBS recorder) and GPS coordinates from the ship’s database.
S.I.G. streamer
The mini-streamer was manufactured by S.I.G. (Service et Instruments de Geophysique, France).
The system comprises a 65 m long active part with 24 hydrophones spaced at 0.5 m. The lead-in cable is 150 m long and directly connected to the lab. The individual hydrophones are omnidirectional and have a flat frequency response from 10 to 1000 Hz. The sensitivity is –90 dB, re 1V/μbar, +-1 dB. The hydrophones are mounted in a oil filled polyurethane pipe of 25 mm diameter, with a nominal density of 1.13 g/cm3. The tow depth can to be controlled by supplying the lead-in cable with air or water and the depth can be monitored at the depth monitor integrated in the system with the power supply. During M111 it was towed at a depth of 8 m between the airguns (Fig. 5.8). The streamer was deployed and recovered manually. A four channel MBS data logger was used to record the seismic signals of the G-gun clusters.
5.2.2 Seismic Refraction and Reflection Data
(F. Klingelhöfer, D. Klaeschen, C. Papenberg, D. Dellong, M. Wieprich, A.
Krabbenhöft, H. Kopp)
The main research focus of cruise M111 was on refraction seismic profiling of the Calabrian accretionary prism and Ionian Basin seafloor. The Calabrian wedge has been investigated using multichannel seismic data, however, information on the deeper architecture and seismic velocities below the Messinian evaporate layer is missing to date. Furthermore, the deep structure of the sub seafloor in the Ionian Sea has never been investigated by a modern OBS survey and controversy still exists regarding the exact nature of the crust. To help resolve these aspects, deep crustal imaging of the study area aims to provide the missing structural information. To meet this goal, 5 combined wide-angle seismic profiles were acquired, using up to 62 seafloor instruments from GEOMAR and IFREMER. Two profiles were extended onshore by land stations from INGV. Table 1 provides the profile coordinates and Figure 5.9 displays the profile and instrument locations. The profiles were not shot in numerical order: DY-04 was acquired first, followed by DY-P03, because both of these profiles were extended onshore and required logistical communication with our onshore partners. Preliminary analysis of these two lines has shown that it is difficult to penetrate the deeper architecture of the accretionary wedge (largely independent of the presence of evaporites). Hence we continued by shooting profile DY- P01 next, which is mainly west-east trending from the Malta escarpment into the deep Ionian
Sea. Our decision to only place 6 instruments on profile DY-P02 to gain complementary information to the existing multichannel seismic data set has been affirmed by the limited depth penetration of seismic energy on the lower slope of the accretionary wedge. Instead, we included an additional profile DY-P05 in our working plan to verify the nature and structure of the crust below the Ionian abyssal plain.
Shot
number
Time Latitude Longitude Waterdepth
DY‐01 1 21/10/14 08:46:22 37.1487 018.2297 3403.9
2538 24/10/14 10:14:22 36.2975 014.8775 122.2
DY‐02 1 27/10/14 09:28:22 37.2295 018.2745 3342.1
574 27/10/14 19:01:22 37.8197 017.7754 2833.6
DY‐03 1 18/10/14 08:35:22 37.4200 015.1455 41.4
1293 19/10/14 06:07:22 38.0738 016.7598 1780.8
DY‐04 1 13/10/14 08:40:20 37.9994 015.4288 156.1
2626 15/10/14 04:25:20 35.7501 018.4017 4099.3
DY‐05 1 28/10/14 17:24:22 35.0823 017.8707 3603.4
946 29/10/14 09:09:22 36.2243 018.2499 4066.8
Table 1: Profile coordinates for refraction profiles DY-01 to DY-05.
Fig. 5.9 Location map of seismic lines DY-01 through DY-05 and R/V METEOR high-resolution bathymetry.
Wide-angle seismic Profile DY-01
On profile DY-01 52 seafloor instruments (26 MicrOBS, 25 Geomar OBH and one Geomar OBS) were deployed at a 5.98 nm interval; the complete profile length was 317 nm and a total of
2538 shots was fired along the profile. All instruments were successfully recovered. Only OBH 117 and OBH 133 could not be processed on board due to card reading problems.
Data quality
Data quality on the instruments located in shallow water on the western end of the profile is generally good, with useable data of up to 60 km offset correspond to sedimentary and crustal arrivals. Relocation was not possible for instruments in less than 100 m water depth as too few direct water wave arrivals are identifiable. Instruments on the Malta escarpment show a high asymmetry due to the steep slope of the escarpment. Further to the east usable offset decreased slightly to around 40-50 km, mostly showing sedimentary and upper crustal arrivals. From OBS 115 on some late arrivals probably corresponding to PmP reflections or Pn arrivals can be identified in the record sections on offsets up to 100 km towards the east. Similar arrivals are observed towards the west on instruments from position 124 on. Instruments between position 129 and 138 show mainly sedimentary arrivals including a stepback due to the presence of a high velocity salt layer. Most instruments show also short crustal arrivals. East of these, most instruments are again of high quality with crustal and sometimes upper mantle arrivals.
Preliminary tomographic inversion
The tomographic model for DY-01 is 410 km x 40 km with a 0.5 km grid cell size (Figure 5.10 (a)) and is based on a preliminary tomographic inversion using the 2D tomography code
‘Tomo2D’ (Korenaga et al., 2000). The starting model consisted of three layers: a water layer above the seafloor interface with a constant 1.5 km/s velocity; a layer from the seabottom up to 22 km depth with velocities ranging from 2.2 to 7.5 km/s; and a third layer from 22 to 40 km depth with velocities ranging from 8.05 to 8.2 km/s. 5 non-linear iterative steps, each testing 5 decreasing values of regularisation factor, were needed to converge toward an acceptable fit for the 23839 travel-times were picked on the 50 OBS records.
The final model (Figure 5.10 (a)) gives an RMS-error of 205 ms between picked and predicted travel-times. Taking the 4.5 km/s velocity contour as a proxy for the basement, this interface deepens slightly from the western end of the profile up to 250 km model distance.
Velocities east of 250 km increase, probably due to high velocity salt in the sedimentary column.
Here, the 4.5 km/s velocity contour might not correspond to basement depth. Moho depths were constrained to about 25 km in the west, rising to 20 km in the center of the profile and slightly deepening towards the east.
Ray density provides qualitative information on areas well or less constrained in the model (Figure 5.10 (b)). The velocity gradients (Figure 5.10 (c)) show one main interface around 10 km depth where velocities above show steep gradient and below velocities a low gradient. The fit between travel-time picks and theoretical arrival times indicate the quality of the model along its complete length.
Fig. 5.10 (A) Result of the tomographic inversion of profile DY-01 of first arrivals on a 0.5 x 0.5 km grid. The 4.5 km/s and 7.8 km/s isocontours represent proxies of the basement and the Moho, respectively. (B) Ray density of the final tomographic model (0.5 x 0.5 km). (C) Velocity gradients of the final velocity model. (D) Fits between picked (red dots) and calculated (black dots) travel-times. OBS locations are indicated by red circles.
Wide-angle seismic Profile DY-02
This 42 nm short profile was acquired coincident to an existing multichannel seismic profile which was pre-stack depth migrated at GEOMAR. Hence a priori information on tectonic structure and seismic velocities for the upper sedimentary sequences is available, however, this information is so far lacking for the deeper layers below the Messinian Evaporites. To fill this gap we deployed 6 OBS (3 MicrOBS+ and 3 Geomar OBS) along this transect, which is sufficient to penetrate the layers at depth over the extent of the accretionary wedge lower slope.
Preliminary onboard modeling was not attempted because this profile has been acquired with the goal to use the data to improve the results from pre-stack depth migration of the corresponding multichannel seismic profile.
Data quality
All 6 instruments have successfully recorded and show seismic phases to offsets of 40 km.
Preliminary analysis of the data reveals that the termination of the salt layer within the accretionary wedge going upslope is of transitional nature and does not occur abrupt. While some deeper phases exist, the profile has shown that it is difficult to shoot into the crust below the accretionary wedge. We have, however, gained information on the medium velocity-depth distribution along the lower slope, which is important to verify earlier results from investigations based on multichannel seismic data.
Wide-angle seismic Profile DY-03
25 seafloor instruments were deployed along this 77 nm long east-west oriented profile.
Instrument spacing was regular 3.22 nm. OBS 316 was not recovered and the data disk of OBS 307 could not be read onboard. All other instruments yielded usable data. A total of 1293 shots were used to acquire the profile starting several hundred meters west of the westernmost instrument and ending in the west towards the east ending 9.5 nm east of the last instrument.
This profile was also extended on land by 6 land stations.
Data quality
Data quality is generally good along the profile and increasing from the west to the east. OBS 301 to OBS 06 show mainly sedimentary arrivals and reflections from the basement. Some correlated unidentified noise was recorded on OBS 310 to 314, seismic arrivals can however be traced through the noise. Instruments located on the eastern end of the profile show late PmP or Pn arrivals on offsets up to 80-90 km.
Preliminary tomographic inversion
The tomographic model for DY-01 is 200 km x 40 km with a 0.5 km grid cell size (Figure 5.11 (a)). The starting model consisted of three layers: a water layer above the seafloor interface with a constant 1.5 km/s velocity; a layer from the seabottom up to 22 km depth with velocities ranging from 2.2 to 7.5 km/s; and a third layer from 22 to 40 km depth with velocities ranging from 8.05 to 8.2 km/s. 5 non-linear iterative steps, each testing 5 decreasing values of regularisation factor, were needed to converge toward an acceptable fit for the 23839 travel- times were picked on the 24 OBS records.
The final model (Figure 5.11(a)) gives an RMS-error of 255 ms between picked and predicted travel-times. The 4.5 km/s velocity contour is slighly deepening from the western end of the profile up to 30 km model distance and shallowing from there towards the east. Moho depth is not well constrained by the preliminary modelling but is probably around 25 km.
Ray density gives qualitative information about areas well or less constrained in the model (Figure 5.11(b)). The velocity gradients (Figure 5.11(c)) show one main interface around 10 km deep where above velocities show steep gradient and below velocities a low gradient.
Misfits between the modelled and the picked arrivals is highest for late arrivals picked between 80 and 130 km model distance (Figure 5.11(d)).
Fig. 5.11 (A) Result of the tomographic inversion of profile SL03 of first arrivals on a 0.5 x 0.5 km grid. The 4.5 km/s and 7.8 km/s isocontours represent proxies to the basement and the Moho, respectively. (B) Ray density of the final tomographic model (0.5 x 0.5 km). (C) Velocity gradients of the final velocity model. (D) Fits between picked (red dots) and calculated (black dots) travel-times. OBS locations are indicated by red circles.
Wide-angle seismic Profile DY-04
62 seafloor instruments were deployed along the 174 nm long profile resulting in an instrument spacing of 2.8 nm, except for OBH 460 and OBS 461, which were separated by a double interval of 5.6 nm. Shooting started in the NW of the first instrument and ended in the SE 15 nm from the last instrument. A total of 2626 shots were fired along the profile. It also was extended on land by 6 land stations from INGV. Several drops in compressed air supply occurred along the profile, without shots having to be stopped. All instruments recorded the air gun shots. OBH 447 could not be recovered.
Data quality
Seafloor stations 400 through 402 were positioned on the undeformed sedimentary cover of the Ionian abyssal plain, south of the deformation front. Adjacent stations 403 through 420 were placed on the lower slope of the accretionary wedge; OBH 421 through OBH 445 were deployed on the middle slope and OBH 447 through 460 on the upper slope of the prism. Seismic phases on the lower slope and south of the deformation front show the largest offsets along the profile, reaching 80 km. All of the stations deployed on the lower slope show clear mantle phases (e.g.
OBH 407 in Fig. 5.12), including Pn refractions and PmP reflections. These phases will allow imaging the oceanic crust and upper mantle and reveal the previously unknown tectonic structure and seismic velocity distribution in the crust, from which the nature of the crust (oceanic vs continental) may be deduced. Going upslope, Pn phases increasingly start to diminish and disappear completely on the middle and upper slopes. While many instruments on the middle slope show limited depth penetration through the thick and highly deformed accretionary prism, stations on the upper slope show deeper phases with seismic velocities around 6 km/s, which penetrate the continental block.
The transition from the lower slope to the middle slope is also the location where the thick evaporate layers of the lower slope abruptly terminates (around profile km -220). A 40 km wide basin marks the limit between lower and middle slopes. Figure 5.13 shows the record section of OBH 419, where the evaporate layer is clearly recorded on the lower slope (around profile km 260) . Here, the typical time offset characteristic for the low velocity zone is recorded. The time offset increases upslope (profile km 210), where the evaporate layer disappears. These results also correspond to the pre-stack depth migrated images of the coincident multichannel seismic data.
Fig. 5.12 Record section from OBH 407 RDF, Profile 04.
Fig. 5.13 Record section from OBH 419 RDF, Profile 04.
Wide-angle seismic Profile DY-05
This 84 nm profile crosses the Ionian Sea basin and its central part was covered by 8 seafloor stations (4 MicrOBS, 4 Geomar OBH) at a spacing of 4 nm. Hence shooting extended for approximately 20 nm beyond the first and last instrument in order to record long offsets from shots travelling through the subsurface (Fig. 5.14).
Fig. 5.14 Record sections from OBH 501 and OBS 508 RDF, Profile 05. Reverse shots are recorded on all stations along the profile.
Data quality
Offsets were recorded over the entire extent of the profile and further modeling of the data will reveal the thickness of the Ionian Sea crust as well as the depth of the crust-mantle boundary.
Mantle phases were recorded on all stations and will yield seismic velocities in the upper mantle.
Figure 5.14 shows reverse shots on two stations, OBH 501 and OBS 508. A thick evaporite layer is present underneath both stations, hence near-offset, early first arrivals are offset to deeper crustal phases. A long-offset, distinct mantle Pn phase is recorded in both offset directions, as well as PmP reflections. These phases contain information on Moho depth and upper mantle velocities.
In addition, a number of stations show distinct S-wave arrivals at offsets < 20 km (e.g. OBS 508 in the lower panel of Fig. 5.14). Detailed analysis of these phases will yield additional information on the sediments and crust in the Ionian Sea basin.
Multichannel Seismic Reflection Data
The S.I.G. mini-streamer was deployed along all seismic transects. The streamer served two aspects: it was used to control the correct functioning of the air guns and also provided information on the uppermost sedimentary structures in regions where seafloor roughness will not cause aliasing. For the refraction data processing the streamer proved very valuable, as a medium gun delay of 78 ms could be identified an all seismic profiles. In addition, on profile DY-P05 one gun fired out of sequence, which could only be recognized on the streamer data.
Shown here are two examples along profiles DY-P03 and DY-P04.
The upper accretionary wedge is displayed in the streamer section on Fig. 5.15. Stratified sediments and sedimentary basins dominate the upper accretionary slope offshore Sicily and Calabria.
Fig. 5.16 displays the mini-streamer section across the deformation front and lower accretionary slope of the Calabrian wedge. The top of the Messinian evaporite layer is recorded at offsets around -365 km to -360 km at 6 s TWT. It crosses a fault around -355 km offset, where it is offset to depths of 6.3 s TWT. The boundary cannot be traced further to the NW underneath the lower slope due to the inclined and heterogeneous seafloor. 0.2 s TWT of stratified sediment is increasingly folded and deformed towards the deformation front.
Fig. 5.15 Ministreamer section from str 300 RDF-Stack, Profile 03.
Fig. 5.16 Ministreamer section from str 499 RDF-Stack, Profile 04.
6 Ship’s Meteorological Station (A. Mickoleit)
RV Meteor left the port of Catania on Friday, October 10th around 07:00UTC. The working area consisted of five profiles between 36 N and 39 N and between 15 E and 19 E. The water temperature was between 21°C and 26°C and the visibility was mainly good.
During the first week a small-scaled high over the Ionian Sea dominated the weather in the working area. On the northwestern flank of the high light to moderate southwesterly wind prevailed. On the eastern flank northerly winds were recorded during the night to October 11th for a time. Near the high-pressure centre winds were light and variable. The wave height was below 0.5 m.
But on October 12th a small-scaled thermal low caused fresh winds for a time. Thereby the wave height increased up to 1 m. Afterwards mainly light to moderate southwesterly winds were registered again.
On Thursday, October 16th, a weak trough has crossed the research area eastwards. The wind veered from south to southwest to west and increased up to 5 Bft for a time. Ahead of the trough the wave height increased up to 1 m.
In the rear of the trough high pressure gained influenced again. On October 17th a high pressure zone extended from northern Algeria across the Ionian Sea towards Egypt. On the northern flank of the high at first a mainly light to moderate westerly wind prevailed. Later, due to weak pressure differences, the wind was light and variable in the sea area near Sicily. But local effects caused wind up to 5 Bft south of Strait of Messina. The wave height further was between 0.5 and 1 m.
During the next days the high pressure zone developed to a ridge of a new high pressure centre over Ukraine. In between this ridge and a trough, which extended from Russia across Cyprus to Greece, RV METEOR get in a northeasterly air flow. Thereby the wind increased close east of southern Italy up to 5 to 6 Bft during the night. While the pressure areas weakened, the wind dropped down till Monday, October 20th.
Afterwards a frontal trough of the Ex-Tropical-Storm Gonzales, which moved from the sea area north of Ireland to southeast, approached from north. This trough crossed the working area in the evening of October 22nd. Ahead of the trough the wind shifted west and increased up to 7 to 8 Bft. The significant wave height rose up to 4 m, but isolated waves reached above 5 m. Due to this expected conditions, all works was stopped on October 22nd during noon.
In the rear of the trough the wind veered northwest. During the morning of October 23rd winds up to 8 Bft with gusts up to 10 Bft were recorded. Afterwards during the forenoon the wind slowly decreased to 4 Bft. Also the wave height decreased. Therefore the research works were started again during the afternoon.
In a following trough, a new low developed over the Adriatic Sea. This low moved south- and later eastwards. In the area of the low the westerly to northwesterly wind increased up to 7 Bft during the evening of October 23rd. In the rear of the low the wind decreased again during forenoon of October 24th and veered northerly afterwards. On October 25th and 26th northerly wind between 3 and 5 Bft were recorded and the wave height was between 1 and 2 m. Under low pressure influence showers and thunderstorms were observed during the time from October 22nd to October 25th. Thereby the wind increased a little for a time in and near showers.
Till October 27th a new small-scaled low developed over the Ionian Sea. On the northwestern flank of the low northerly to northeasterly winds between 3 and 5 Bft were registered.
With sailing south, METEOR got on the southern flank of the low in a northwesterly airflow on October 28th. Thereby winds about 3 to 5 Bft were measured. During the following days the low will move eastwards and the wind will veer north. The wave height was between 0.5 and 2 m.
On October 31st a new small-scaled low developed over the Ionian Sea. In between this low and high pressure over the western Mediterranean Sea the northerly to northeasterly wind increased 6 to 7 Bft. Thereby also the wave height increased to 2 m.
In the unstable air mass further showers and thunderstorms developed up from October 27th.
In the morning of November 1st Meteor arrived at Catania with moderate northeasterly winds.