Intersegmental influences contributing to coordination
in a walking insect
Inaugural - Dissertation zur
Erlangung des Doktorgrades
der Mathematisch-Naturwissenschaftlichen Fakult¨at
der Universit¨at zu K¨oln
vorgelegt von Anke Borgmann
aus Herdecke
K¨oln
Dezember 2006
2
Berichterstatter:
Prof. Dr. Ansgar B¨ uschges Prof. Dr. Peter Kloppenburg
Tag der letzten m¨ undlichen Pr¨ ufung: 12.02.2007
Abstract
Locomotion depends on correct interaction of the nervous system, muscles and environ- ment. A key element in this process is the coordinated interplay of multiple body parts to achieve a stable and adapted behavior. Different aspects of intersegmental coordina- tion in the stick insect have been investigated in this thesis: the activation of the walking system, intersegmental information transfer in the connectives and the influence of load signals. I used a reduced preparation with only single intact front, middle or hind legs.
The intact leg(s) performed stepping movements on a passive treadmill, hence providing, both sensory feedback and central input from its active pattern generating networks to the other hemiganglia. The activity of protractor and retractor motoneurons (MNs) was simultaneously recorded extracellularly in the other segments. The preparation allows investigating intersegmental influence of stepping single leg(s) on motoneural activity in the other deafferented hemisegments.
The experiments revealed that the stick insect walking system is constructed in a modular fashion. Stepping of a single leg does not imply that the animal is in a locomotor state.
In the two leg preparation with two intact legs that stepped on two separate treadmills,
stepping of one leg did not imply stepping of the second leg. The legs stepped independent
of each other concerning coordination and frequency. In the single leg preparation stepping
of a single leg did not activate pattern generating networks in all other hemiganglia. The
different hemiganglia were obviously activated independently. Only forward stepping of
the front leg and, to a lesser extend, backward stepping of the hind leg, elicited alternating
4
activity in mesothoracic protractor and retractor MNs. Motoneural activity in the other hemisegments increased and was slightly modulated during stepping sequences. Activation of the metathoracic ganglion required both ipsilateral front and middle legs stepping.
Furthermore, the stick insect walking system is constructed asymmetrically on the neural level concerning the contribution and importance of the different legs for intersegmen- tal coordination. The influence of middle leg stepping was qualitatively different to the influence of front leg stepping. In the single leg preparation front leg stepping induced al- ternating activity in ipsilateral mesothoracic protractor and retractor MNs that was most probably shaped by pattern generating networks. Middle leg stepping did not induce al- ternating activity in MNs of its ipsilateral neighboring segments. In a two leg preparation with front and ipsilateral middle leg stepping the middle leg appears to have no influence on the timing of metathoracic motoneural activity whereas front leg stepping was able to entrain metathoracic MN activity.
The processing of intersegmental signals from other stepping legs appears to depend on the state of the receiving ganglion. Signals from the stepping front leg most probably reach the metathoracic ganglion as connective recordings show. If the metathoracic ganglion is active in the sense that the central pattern generating networks are active the signals from a stepping leg are treated differently. If the metathoracic ganglion was not active a general increase in motoneural activity was observed during front leg stepping. In case of an active metathoracic ganglion protractor and retractor MN activity alternated and was influenced by front leg stepping.
Sensory signals are particularly important for coordination of the legs in the stick insect. In
experiments in which middle leg campaniform sensilla were stimulated during single front
leg stepping sequences, mesothoracic levator and depressor motoneuron activity was cou-
pled to the campaniform sensilla stimulation. Stimulation of middle campaniform sensilla
pretends increased load on the leg and induced an increase in depressor and a decrease in
levator motoneuron activity. In mesothoracic protractor and retractor motoneurons front
leg stepping induced alternating activity. Depending on the phase of front leg step cycle
middle leg campaniform sensilla stimulation increased retractor and decreased protractor
motoneuron activity or the influence was reverse (around 180
°of step cycle).
Zusammenfassung
Fortbewegung ist abh¨angig von der Interaktion von Nervensystem, Muskeln und Umwelt.
Eine Schl¨ usselrolle nimmt dabei das koordinierte Zusammenspiel aller an der Bewegung beteiligten K¨orperteile ein. In der vorliegenden Arbeit wurden verschiedene Aspekte inter- segmentaler Koordination an der Stabheuschrecke untersucht: die Aktivierung des Lauf- systems, der Informationstransfer in den Konnektiven, und der Einfluss von Belastungssig- nalen. Es wurde ein reduziertes Pr¨aparat mit einem oder zwei intakten Vorder-, Mittel- oder Hinterbein(en) verwendet. Das intakte Bein bzw. die intakten Beine vollf¨ uhrten Schreitbewegungen auf einem passiven Laufband. Von diesen Beinen gehen somit sen- sorische Signale und der Einfluss aktiver Rhythmus generierender Netzwerke aus. Gle- ichzeitig wurde die Aktivit¨at von Protraktor und Retraktor Motneurone (MNe) der an- deren Hemiganglien extrazellul¨ar abgeleitet. Diese Pr¨aparation erlaubt es einzelne inter- segmentale Einfl¨ usse wie die Laufbewegung eines Beines auf die motoneuronale Aktivit¨at anderer deafferentierter Hemiganglien zu untersuchen.
Das Laufsystem der Stabheuschrecke ist auf neuronaler Ebene modular aufgebaut. Die
Schreitbewegung eines einzelnen Beines ist nicht hinreichend um das gesamte Laufsystem
zu aktivieren. In der Zweibein Pr¨aparation, bei der zwei Beine auf separaten Laufb¨andern
laufen und daher mechanisch entkoppelt sind, machten beide Beine unabh¨angig voneinan-
der Schreitbewegungen. Im Einbein Pr¨aparat aktivierte die Laufbewegung eines Beins
nicht die Rhythmus generierenden Netzwerke in de anderen Hemiganglien. Die einzelnen
Hemiganglien werden offensichtlich unabh¨angig voneinander aktiviert. Nur die vorw¨arts
6
gerichtete Laufbewegung eines Vorderbeins und in geringerem Maße die r¨ uckw¨arts gerichtete Laufbewegung eines Hinterbeins l¨osten alternierende Aktivit¨at in mesothorakalen Protrak- tor und Retraktor MNen aus, wohingegen in den anderen Hemiganglien ein Anstieg mo- toneuronaler Aktivit¨at zu beobachten war. Um das Metathorakalganglion zu aktivieren m¨ ussen sowohl das ipsilaterale Mittel- als auch Vorderbein intakt sein.
Desweiteren zeigte sich, dass das Laufsystem im Hinblick auf den Einfluss der einzel- nen Beine auf neuronaler Ebene asymmetrisch strukturiert ist. Die Schreitbewegungen eines einzelnen Vorderbeins l¨osten in mesothorakalen Protraktor und Retraktor MNen alternierende Aktivit¨at aus, die sehr wahrscheinlich auf die Aktivierung mesothorakaler Rhythmus generierender Netzwerke zur¨ uckzuf¨ uhren ist. Die Schreitbewegung des Mittel- beins l¨oste in keinem benachbarten Hemiganglion alternierende Aktivit¨at in MNen aus.
In der Zweibein Pr¨aparation mit laufendem Vorder- und ipsilateralem Mittelbein war das laufende Vorderbein in der Lage die Aktivit¨at metathorakaler Protraktor und Retraktor MNe anzukoppeln, unabh¨angig davon, ob das Mittelbein Schreitbewegungen vollf¨ uhrte oder nicht.
Wie intersegmentale Signale von anderen Beinen verarbeitet werden, scheint vom Status der Netzwerke des ”empfangenden” Ganglions abzuh¨angen. Signale des laufenden Vorder- beins erreichen sehr wahrscheinlich das Metathorakalganglion, wie Konnektivableitungen zeigen. Abh¨angig vom Status des Ganglions werden die Signale des laufenden Vorderbeins unterschiedlich verarbeitet. Waren die Rhythmus generierenden Netzwerke des Metatho- rakalganglions inaktiv, so f¨ uhrte die Laufbewegung des Vorderbeins zu einem gemeinsamen Anstieg der Aktivit¨at der Protraktor und Retraktor MNe. Waren sie aktiv, so alternierte die motoneuronale Aktivit¨at und wurden von den Schritten des Vorderbeins beeinflusst.
Sensorische Signale sind wichtig f¨ ur die Koordination der Beine. Stimulation der Cam-
paniformen Sensillen des Mittelbeins w¨ahrend Schrittsequenzen des Vorderbeins f¨ uhrte zu
einem Anstieg der Aktivit¨at in mesothorakalen Depressor MNen und einem Abfall der
Aktivit¨at in mesothorakalen Levator MNen. In mesothorakalen Protraktor und Retraktor
MNen f¨ uhrte die Stimulation der Campaniformen Sensillen abh¨angig von der Phase des
Schrittzyklus zu einem Anstieg der Aktivit¨at in den Retraktor MNen und einem Abfall
der Aktivit¨at in den Protraktor MNen oder umgekehrt (ca. 180
°des Schrittzyklus).
Contents
1 Introduction 1
2 Materials and methods 7
2.1 Experimental animal . . . . 7
2.2 Preparation and experimental setup . . . . 8
2.2.1 Preparation . . . . 8
2.2.2 Extracellular recordings and electromyograms . . . . 11
2.2.3 The treadmill . . . . 12
2.2.4 Piezoelectrical stimulation . . . . 14
2.2.5 Experimental setup . . . . 14
2.3 Data analysis . . . . 15
3 Activation of the walking system 19
3.1 Influences of single front leg stepping . . . . 20
3.1.1 Ipsilateral influences . . . . 20
3.1.2 Contralateral influences . . . . 27
3.2 Influences of single middle leg stepping . . . . 29
3.2.1 Ipsilateral influences . . . . 29
3.2.2 Contralateral influences . . . . 34
3.3 Influences of single hind leg stepping . . . . 36
ii Contents
3.4 Influence of the walking direction . . . . 37
3.5 Conclusions . . . . 40
4 Involvement of central pattern generators 41
4.1 Activation of the mesothoracic thorax coxa joint CPG . . . . 43
4.1.1 Activation of the mesothoracic ganglion by pilocarpine . . . . 43
4.1.2 Influence of front and ipsilateral hind legs stepping . . . . 47
4.2 Activation of the metathoracic thorax coxa joint CPG . . . . 51
4.2.1 Activation of the metathoracic ganglion by pilocarpine . . . . 51
4.2.2 Influence of front and ipsilateral middle legs stepping . . . . 57
4.3 Conclusions . . . . 67
5 Intersegmental signals in the connectives 71
5.1 Connective recordings during single front leg stepping . . . . 72
5.2 Origin of the tonic component . . . . 81
5.3 Origin of the phasic modulation . . . . 83
5.4 Conclusions . . . . 86
6 Coordination of two legs 89
6.1 Coordination of ipsilateral front and middle legs . . . . 90
6.2 Coordination of ipsilateral front and hind legs . . . . 95
6.3 Coordination of contralateral front and middle legs . . . . 100
6.4 Conclusions . . . . 102
7 Intra- vs. intersegmental influences 105
7.1 Influences of middle leg campaniform sensilla stimulation on front leg stepping106 7.2 Influences on mesothoracic protractor and retractor MNs . . . . 109
7.3 Influences on mesothoracic levator and depressor MNs . . . . 120
7.4 Conclusions . . . . 125
8 Discussion 129
8.1 Activation of the walking system . . . . 129
8.2 Involvement of central pattern generators . . . . 135
Contents iii
8.3 Intersegmental signals in the connectives . . . . 142
8.4 Coordination of two legs . . . . 146
8.5 Intra- vs. intersegmental influences . . . . 148
8.6 Conclusions on the organization of the stick insect walking system . . . . . 150
Bibliography 152
Appendix 167
Appendices 167
A Tables chapter 6 169
CHAPTER 1
Introduction
The ability to move is a characteristic trait of animals and humans. Locomotion emerges from a complex interplay of nervous system, muscles, sense organs and environment (Or- lovsky et al. 1999). There are various ways of locomotion throughout the animal kingdom.
Nevertheless, all ways of locomotion regardless if flying or swimming, walking or crawling meet the same principles. Locomotion is based on cyclic recurrent movements of specified body parts. This is achieved by coordinated, rhythmical contractions of antagonistic mus- cles that move the body, multijointed limbs or other appendages. Therefore, a complex rhythmic motor pattern has to be generated, coordinated intersegmentally and adapted to the environment. Rhythmic motor patterns are generated by neural networks within the central nervous system, called central pattern generators (CPGs) (Grillner 1985, 2003;
Pearson et al. 1993; B¨ uschges 2005). Besides the basic rhythmic motor output sensory
signals from various sense organs are crucial for a functional motor program as they es-
tablish the only connection between animal and environment. They monitor parameters
of behaviors and assure that movements are successfully and efficiently performed, they
2 1 Introduction
aid in adjusting posture and locomotion to variations in the environment and they de- tect perturbations and contribute to the development of compensatory adjustment (Pratt 1995; Clarac et al. 2000; Grillner and Wallen 2002; Pearson 2000, 2004; Zill et al. 2004;
B¨ uschges 2005). The degree of central and peripheral control for the coordination of mo- tor output varies with the way of locomotion and the surrounding environment. Central interactions are particularly well understood in swimming (crayfish (swimmerets): Paul and Mulloney 1986; Tschuluun et al. 2001; leech : Weeks 1981; lamprey: Cohen and Wall´en 1980; Grillner et al. 1981a, b; tadpole: Tunstall and Roberts 1990, 1994) whereas peripheral feedback has been thoroughly investigated in terrestrial locomotion (stick insect : B¨ uschges 2005 (review); crayfish : Clarac 1985; Cattaert and Ray 2001 (review); cat: Shik et al. 1966;
Grillner 1975; Wetzel et al. 1976; O. Andersson and Zomlefer 1978; Rossignol et al. 1981;
Andersson and Grillner 1983; Conway et al. 1987; Lam and Pearson 2002 (review)). In general peripheral feedback appears to be more important for terrestrial locomotion. Here the surrounding environment is more irregular and requires constant adjustment. Further- more, locomotor organs for terrestrial locomotion are often multi-segmented legs. Hence, in legged animals besides intersegmental coordination intrasegmental coordination of the leg segments is required.
”Model system” stick insect
A well established model system for slow walking behavior is the stick insect. Stick insects
have a simply organized nervous system that is easily accessible and show only a sim-
ple behavioral repertoire. They naturally walk and climb on bushes they feed on. They
have six multisegmented legs that have to be coordinated properly to achieve a stable
locomotion pattern. Adult stick insects walk in tripod or tetrapod or an intermediate
gait (Graham 1985b). During walking the cyclic pattern of a leg consists of the two
phases: stance (power stroke) and swing (return stroke). During stance phase the leg is
on the ground and yields propulsion to the body. During swing phase the starting position
of the leg is re-established to generate the next stance. Each phase requires the orderly re-
cruitment of specific muscles that move the different leg joints (Graham 1985b; B¨ uschges
and ElManira 1998; B¨ uschges 2005). The leg is equipped with different sense organs that
3
provide information about the relative position of the leg segments (hair plates and hair rows) (Wendler 1964c; Tatar 1976; B¨assler 1977), about load (femoral and trochanteral campaniform sensilla) (Tatar 1976; B¨assler 1977; Hofmann and B¨assler 1982; Akay et al. 2004) and the angle and movement of the femur tibia joint (femoral chordotonal organ) (Borchardt 1927; B¨assler 1965, 1967; F¨ uller and Ernst 1973).
Extensive behavioral studies have been performed on the stick insect. Observations and perturbations of the stepping pattern allowed proposing six rules that describe interseg- mental coordination (B¨assler 1979; Cruse 1979a, 1985; Graham 1985b; Cruse and M¨ uller 1986; Cruse and Schwarze 1988; Dean and Wendler 1983; Cruse 1990).
1. Rostrad influence: Return stroke inhibits start of return stroke.
2. Rostrad influence: Start of power stroke excites start of return stroke.
3. Caudad influence: Caudal positions excite start of return stroke.
4. Position influences position at end of return stroke(targeting).
5. a) Increased resistance increases force (co-activation).
b) Increased load prolongs power stroke.
6. Treading-on-tarsus reflex.
(adapted from Cruse et al. 1995b
These rules mainly serve the purpose to re-establish the walking pattern after perturba- tions (Cruse 1990) and are sufficient to generate a walking pattern that resembles closely to that of straight forward walking in the stick insect. This could be shown in simulation studies (Cruse et al. 1995b, a, 1996, 1998). Nevertheless, little knowledge exists about the neural basis of intersegmental coordination. From behavioral studies and amputation ex- periment it is known that sensory signals are important for intersegmental coordination.
Amputation of one middle leg leads to an immediate adaptation to a slightly changed
walking pattern (Hughes 1957; B¨assler 1972; Graham 1977). When the amputated
4 1 Introduction
middle leg is substituted by a stick that is glued to the coxa the original coordination is re-established (Wendler 1964c). In contrast, if the middle leg is immobilized instead coordination is destroyed (Graham 1977). Hence, sensory signals are necessary to assure coordination. Foth and B¨assler (1985a, b) used two treadmills with five legs walking on one treadmill with a given velocity and one leg walking on another treadmill with a dif- ferent velocity. All six legs were still coordinated and adapted to respective tread wheel velocity. This indicates that intersegmental coordination in the stick insect is not achieved primarily by central coupling between the legs. Mechanical coupling through the ground alone can also be excluded as coordination mechanisms. When the legs are decoupled by walking on a slippery surface still a coordinated walking pattern was observed (Graham and Cruse 1981; Epstein and Graham 1983).
The generation of a step in a single leg is well investigated on the neural level (B¨assler and B¨ uschges 1998; Ekeberg et al. 2004; B¨ uschges 2005). The coordination between different legs is not sufficiently described on the neural level so far. B¨ uschges et al. (1995) could show that each leg joint posses its own CPG. But no coupling of active CPGs in different segments could be observed (Ludwar et al. 2005a). Therefore the interaction between the CPGs appears to be comparably weak and is not responsible for intersegmental coordi- nation. Ludwar et al. (2005a) show that stepping of a single front leg induces alternating activity in antagonistic MN pools of the ipsilateral middle leg. Sensory signals of the front leg contribute to this influence. Stimulation of the front leg chordotonal organ increases the probability for mesothoracic protractor and retractor MNs to switch from protractor to retractor MN activity (Ludwar et al. 2005a).
Issues
This thesis deals with different aspects concerning the neural basis of intersegmental coor- dination in walking in the stick insect Carausius morosus. The experiments were conducted on reduced preparations that allowed investigating isolated intersegmental influences. The following issues were investigated:
1. The activation and maintenance of rhythmic motor activity in the walking system.
5
2. The information transfer contributing to intersegmental coordination.
3. The processing of intersegmental signals and local sensory signals.
The results are structured in several subchapters. Each subchapter contains a short in-
troduction that is focused on the specific topic of respective chapter. At the end of each
result chapter is a short summary of the conclusions.
CHAPTER 2
Materials and methods
2.1 Experimental animal
All experiments were conducted on female stick insects of the genus Carausius morosus (C. morosus). The stick insect C. morosus belongs to the family Phasmatidae. It was originally domiciled in India and is also known under the trivial name Indian stick insect.
Order:
Family:
Subfamily:
Genus:
Species:
Phasmatoptera Phasmatidae Lonchodinae Carausius C. morosus
Figure 2.1: Stick insect Carausius morosus on a blackberry leaf.
8 2 Materials and methods
Its wingless body is nearly cylindrical and varying in color from green to grey (B¨ uckmann 1979). The adult females reach a size of approximately 7,5 cm. Male stick insects are smaller and rangier reaching a size of approximately 5,5 cm. In adult animals the inner femur of the front legs is colored in bright red.
Male individuals occur rarely as stick insects mainly proliferate by pathogenesis. The oo- genesis takes four to eight months depending on the temperature. The larvae need another three months to develop to an imago.
C. morosus is crepuscular and nocturnal. Stick insects live on bushes and feed upon the leafs. There most important protective mechanism is twig mimesis. The twig-like form of their body masks them in the bushes and together with some behavioral components, such as catalepsy and rocking, this appears to reduce the probability of the insects being eaten (B¨assler and Wegner 1983; Rupprecht 1971).
The animals that were used for the experiments came from the breed of the Institute of Zoology at the University of Cologne exclusively. The animals were kept under con- stant conditions at temperatures between 20
°and 22
°and artificial light in a twelve hour rhythm of light and dark. They were fed with blackberry leafs of the sort Rubus fructiosus.
2.2 Preparation and experimental setup
The experiments were solely performed on adult female stick insects of the genus C. mo- rosus at room temperature and obscured light conditions. Aligned to the different exper- imental requirements different preparations were used.
2.2.1 Preparation
Single leg preparation
This semi-intact preparation allowed to study the influence of a single intact stepping leg
on the motoneural activity of the other hemiganglia. All legs except one intact front, mid-
dle or hind leg were cut in the middle of the coxa (Fig. 2.2(a)). The amputation of all legs
2.2 Preparation and experimental setup 9
foam platform
(a) (b)
silicone oil barrier
(c)
restriction
(d)
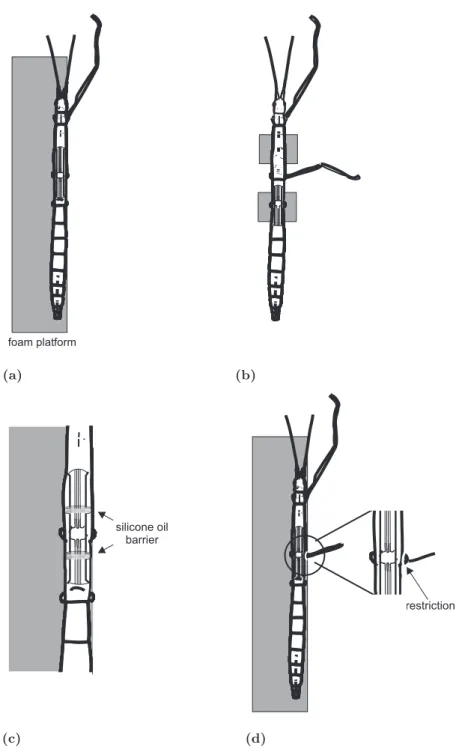
Figure 2.2: (a) Single leg preparation. (b) Two leg preparation. (c) Split bath preparation. (d) Preparation for middle leg campaniform sensilla stimulation during front leg stepping. In the enlarged part the restriction around the coxa is visible that restricts movements of the thorax coxa joint.
10 2 Materials and methods
except one made sure that sensory signals of these legs were eliminated. The animal was fixed dorsal side up on the edge of a squared foam platform with dental cement (Protemp II, ESPE). The intact leg could move barely restricted. The thorax was opened with a sagittal cut along the midline and the cuticle was opened with four 0,1 mm or 0,2 mm insect pins, two on each side of the animal. The gut was moved aside and connective tissue was carefully removed to expose the various hemiganglia and their leg nerves for extracellular recording. The ganglion that was recorded from was completely deafferented by either cutting or crushing the nerves. The body cavity was filled with saline (composi- tion according to Weidler and Diecke 1969). (Preparation modified after Karg et al. 1991;
Fischer et al. 2001).
Two leg preparation
In the two leg preparation two legs were left intact while all others were cut in the middle of the coxa. I used three different combinations of intact legs. Either front and ipsilateral middle legs or front and contralateral middle legs or front and ipsilateral hind legs were left intact. In this preparation the platform the animal was fixed on was reduced to two small platforms (Fig. 2.2(b)). One platform supported the body of the animal beneath the ganglion that was recorded from. The other platform was placed between front and middle legs or at the abdomen respectively. The animal was fixed dorsal side up and dissected as described for the single leg preparation. The use of two small platforms had the advantage that both legs moved freely in each joint and two treadmills were easily positioned around the animal, one under each leg.
Split bath preparation
In different sets of experiments one ganglion was superfused with saline containing pilo-
carpine. Pilocarpine is a muscarinic Acetyl choline agonist. It is known to activate central
pattern generating networks which elicit rhythmic activity in stick insect MNs. MNs to
antagonistic muscles start alternating with a slow frequency (B¨ uschges et al. 1995). For
the preparation the animal was fixed on a foam platform and dissected as described for the
2.2 Preparation and experimental setup 11
single leg preparation. To be able to superfuse only one ganglion with saline containing pilocarpine, half a centimeter rostral and caudal of respective ganglion a silicone oil barrier was built (Fig. 2.2(c)). Therefore two transversal sections were cut out of the cuticle, one rostral of the ganglion and one caudal. The connectives were left intact. The gap was kept dry and was completely filled with silicone oil (hochviskos, BAYER, Leverkusen). Three separate compartments were formed, one rostral and caudal of the ganglion in focus and one around the ganglion. Drops of stock solution with a pilocarpine concentration of 10
−2 mol·l−1were delivered into the compartment with the ganglion in focus, to reach a final concentration in the range of 10
−4 mol·l−1to 5
·10
−3 mol·l−1. The denoted concen- tration is known to reliably elicit a stable rhythm in respective MNs (B¨ uschges et al. 1995).
Preparation for campaniform sensilla stimulation
In one set of experiments middle leg campaniform sensilla were stimulated. The leg was cut at two thirds of the femur. Coxa and trochanter and the proximal part of the femur were shaved with a scalpel to cut of sensory hairs. The stimulation was achieved by bending the femur (Schmitz 1993). This lead to an unspecific stimulation of femoral and trochanteral campaniform sensilla. For the stimulation it was necessary to exclude movements in the thorax coxa joint. The thorax coxa joint was fixed in a position where the femur and the body of the animal formed an angle of approx. 85
°. The fixation was achieved with a small ring of dental cement around the coxa that prohibited pro- and retraction movements of the coxa (Fig. 2.2(d)). The front leg was left intact and the ipsilateral middle leg was prepared for campaniform sensilla stimulation (Fig. 2.2(d)). All other legs were cut. The further preparation was done analogous to the single leg preparation. The mesothoracic ganglion was deafferented (including nerves C1 and C2) except for the nervus cruris (ncr) that contains the campaniform sensilla afferents.
2.2.2 Extracellular recordings and electromyograms
Lateral nerves and connectives were recorded with extracellular hook electrodes (modified
after Schmitz et al. 1991) filled with silicone oil (hochviskos, BAYER, Leverkusen). The
12 2 Materials and methods
ganglion that was recorded from was completely deafferented by either cutting or crushing the nerves. The connectives were left intact. It was recorded from the lateral nerves nl2, nl5, C1 and C2 (nomenclature according to Marquardt 1940 and Graham 1985b) and from different connectives.
In some experiments electromyograms (EMGs) of the femoral muscles were done to moni- tor the movement of the leg. Therefore, two thin copper wires (diameter 50
µm, insulatedexcept for the tips) were inserted closely together through the cuticle of the proximal fe- mur. Depending on the insertion site, muscle potentials from the flexor tibiae muscle were recorded individually or together with potentials from the extensor tibiae muscle.
Both the extracellular recordings and the EMG recordings were amplified (500x - 5000x), filtered (250 Hz - 5 kHz, 50 Hz - 1 kHz) and digitized with a MICRO1401 A/D con- verter (sampling rate: 12,5 kHz) and recorded with SPIKE2 software (both CAMBRIDGE ELECTRONIC DESIGN, Cambridge, UK) on a personal computer.
2.2.3 The treadmill
The treadmill (Fig. 2.3(a)) consisted of two styrofoam drums (diameter 40 mm; width
28 mm) each mounted on a micro DC-motor (DC1516, FAULHABER, Sch¨onaich, Ger-
many) that had a center distance of 50 mm. Around them a belt made of light crepe
paper (35
g/m2) was placed. The tangential force that had to be applied to overcome
belt friction was 4,0
±0,3 mN. The moment of inertia of the system, which is determined
by the effective mass of the treadmill, was 1,1 g and thus equal to the mass of an adult
animal (Gabriel 2005). One of the DC-motors served as a tachometer. The output volt-
age, which was proportional to the belt velocity, was smoothed (first order low-pass filter,
time constant 20 ms) in order to eliminate voltage spikes. The tachometer was digitized
with a MICRO1401 A/D converter (sampling rate: 6,5 kHz) and recorded with SPIKE2
software (both CAMBRIDGE ELECTRONIC DESIGN, Cambridge, UK) on a personal
computer. With the other motor belt friction could be varied. By a voltage current
converter (Peter Heinecke, self construction) a current could be applied that generated
a torque and thereby changed the force required to move the belt without moving the
2.2 Preparation and experimental setup 13
AD/DA-Converter Personal Computer
recording of belt velocity
current command
(a)
stance beginning
end of stance maximum
velocity
1s
(b)
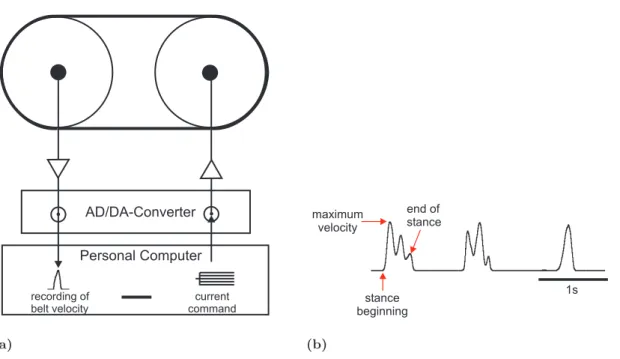
Figure 2.3: (a) Treadmill. The signal from the tachometer was filtered and digitized prior to recording. A current could be applied to the other motor to decrease or increase belt friction.
(Picture modified after Gabriel 2005). (b) Tachometer trace.
belt itself. By this, belt friction could be altered in a range from 1,5 mN to 6,5 mN. The
treadmill was positioned below the leg. The height was adjusted so that the angle of the
joint between femur and tibia was approximately 90
°in mid-stance. The tachometer trace
allowed determining the stance phase of a step (Fig. 2.3(b)). The beginning of stance was
defined as the beginning of the raising edge. The end of stance was defined as the last
maximum of the trace before it decreases back to zero. The falling edge is just determined
by the inertia of the treadmill and does not contain any information about the status of
the step. From the tachometer trace the maximum belt velocity was determined by the
maximum of the voltage trace of respective step as the voltage output is proportional to
the belt velocity. In all experiments not single steps were used for analysis but stepping
sequences. A stepping sequence was defined as a minimum of three consecutive steps that
had a maximum temporal distance of 3,5 s.
14 2 Materials and methods 2.2.4 Piezoelectrical stimulation
For the campaniform sensilla stimulation a piezoelectric element that was driven by a ramp generator (electronic workshop, University of Cologne) was used. In these prepara- tions, the left middle leg femur extended over the platform. The femur was attached to the piezoelectrical element. To adequately stimulate the campaniform sensilla, the femur was slightly bent horizontally (Schmitz 1993). The stimulation was carried out only in posterior direction. The ramp that was used had a fast 0,03 s rising edge followed by a 0,3 s plateau and a slow movement (1,5 s) back to zero. The amplitude was 530
µm.The stimulation was done with frequencies between 0,16 Hz and 0,7 Hz or single irregular stimulations.
2.2.5 Experimental setup
The experimental setup stood on damped table (MICRO-g, TMC, Peabody, MA, USA) surrounded by a Faraday cage. Next to the foam platform where the animal was mounted two to four micromanipulators were positioned for electrodes and the piezo element. A lamp with optical fibers illuminated the setup. Depending on the experiment one or two treadmills were positioned next to the platform under respective intact leg. The front leg treadmill was usually positioned in a approx. 40
°angle to the animal as this corre- sponds to the position of the front leg in a standing animal (Cruse 1976). The middle leg treadmill was either positioned in parallel to the animal or perpendicular. For the single middle leg preparation, experiments were performed with the treadmill perpendicular to the animal as well as in parallel to the animal. With the treadmill perpendicular to the animal the middle leg stepped sideways. This corresponds to the traditional fashion of the single middle leg preparation (Fischer et al. 2001; J.P Gabriel and B¨ uschges 2003).
This walking situation is most comparable to an inner middle leg during curved walking
or to front leg stepping. With the treadmill parallel to the animal the middle leg stepping
resembles more closely the kinematics during forward straight walking (Cruse and Bartling
1995). For the two leg preparation the middle leg treadmill was positioned parallel to the
animal. The animals performed spontaneous stepping sequences very seldom. Therefore
2.3 Data analysis 15
stepping sequences were elicited by gently touching the abdomen with a paintbrush. The paintbrush was removed as soon as the animal started a sequence of stepping movements.
2.3 Data analysis
The extracellular recordings and the tachometer trace were preprocessed in SPIKE2 for further data evaluation. Neuronal activity of the extracellular recordings and beginning and end of a stance phase in the tachometer trace were displayed as event channels. In order to estimate the gross activity of an extracellular recording the recording was rectified and smoothed (first order low pass filter, time constant
Ts= 70
ms). Custom SPIKE2script programs were written to analyze the recordings and prepare it for further advanced analysis with MATLAB 7.0 (The MathWorks, Inc., Natick, USA).
Circular statistics
Stepping is a cyclic recurrent behavior. Therefore I used circular statistics to describe and
evaluate motoneural activity in the step cycle and the relationship between two stepping
legs. Polar plots show the mean phase of MN activity or mean stepping activity in the
stepping legs step cycle. The vector length of the mean vectors was tested for significance
with the Rayleigh-Test (Batschelet 1981). The following symbols show the level of statis-
tical significance: ( ) not significant; (*) significant with
P <0, 05. N gives the number
of experiments or animals while n gives the number of steps. Phase histograms show the
distribution of MN activity in the step cycle. On top of the histogram the mean end of
stance phase is shown with the mean angular deviation (Batschelet 1981). This is equiv-
alent to the standard deviation in linear statistics. Furthermore, the phase of occurrence
of MN spikes in the step cycle was plotted against the step cycle duration to detect a
possible phase or time dependence. In this plot the frequency of steps over the step cycle
duration was plotted additionally. For a clearer illustration the curve was smoothed by a
moving average.
16 2 Materials and methods
Cross correlation and auto correlation analysis
Auto correlation analysis has been applied on rectified and smoothed extracellular traces to detect oscillations in the gross activity of the recording (see chapter 5).
Cross correlation analysis has been applied for different purposes. Cross correlation be- tween the event channels of extracellular recordings was done for the whole time of record- ing including the time between stepping sequences. The event channel was ”re-sampled”
in this case as the mean number of events was determined in consecutive non-overlapping windows of 50 ms. In this case no bounds of significance were quoted for the cross corre- lation function. Because of the irregular episodes of neuronal activity due to the irregular occurrence of stepping sequences the cross correlation function often showed a drift. Hence, the interesting range in the cross correlation function around 0 s time lag was not neces- sarily symmetrical around R = 0. Therefore, the bounds of significance have no meaning.
The cross correlation function between neuronal activities was calculated on the basis of the rectified and smoothed extracellular recordings for single stepping sequences only. Be- cause of the high number of data points due to the high sampling rate of 12,5 kHz this was reasonable only for small time windows as for large time windows it takes far too long to calculate the cross correlation function.
Averaged overdraws
The course of the rectified and smoothed or the unprocessed extracellular recording was averaged with reference to a certain trigger for example the beginning of stance phase.
The overdraws were done with respect to time as well as with respect to phase. The variance was indicated by the standard deviation.
Phase response curve (PRC)
A phase response curve (PRC) allows determining and characterizing the phase dependent influence of a stimulus on the timing of an oscillator (Fig.
??). The PRC was calculated byP RC
(
dmean(T p)
) =
mean(T p)−T mean(T p) .2.3 Data analysis 17
Tp 1s
d Tp T
Figure 2.4:Calculation of a phase response curve for front leg steps occurring during pilocarpine induced rhythm in mesothoracic MNs.
Statistics
Regression analysis was used to analyze linear correlation between two variables. The cor- relation coefficient was determined and tested for significance with the Fisher test (Sachs 1972).
Mean values were compared to zero or among each other using a t-test. Means, samples
and correlation coefficients were regarded as significantly different from zero or from each
other at
P <0, 05. The following symbols show the level of statistical significance: (n.s.)
not significant
P ≥0, 05; (∗)0, 01
≤P <0, 05; (∗∗)0, 001
≤P <0, 01; (∗ ∗ ∗)P < 0, 001. N
gives the number of experiments or animals while n gives the sample size.
CHAPTER 3
Activation of the walking system
The stick insect is a well established model system for slow walking behavior. Each of the six legs is driven by its own walking pattern generator for walking (e.g. Foth and B¨assler (1985a)), which contains at least three CPGs - one for each of the major leg joints (B¨assler and Wegner 1983; B¨ uschges et al. 1995). Intrasegmental coordination has been fairly well studied and is achieved by sensory feedback that couples the activities of each leg’s three joints (reviewed in B¨ uschges (2005)). In contrast, little is known about the neural mechanisms underlying intersegmental coordination among the individual legs. Behav- ioral experiments have led to the proposal of six rules that phenomenologically predict the interactions among the different legs (B¨assler 1979; Cruse 1979b, 1985; Cruse et al.
1995b; Cruse and Schwarze 1988; Dean and Wendler 1983; Graham 1979;
?). Theserules mainly serve to re-establish the stepping pattern in case of disturbances and present
evidence suggests that these rules act similar for all legs (D¨ urr et al. 2004). It remains
unclear, however, whether these behavioral rules emerge from all legs interchanging simi-
lar information with each other or whether leg specific differences in information transfer
20 3 Activation of the walking system
exist. Resolving this issue requires investigating how single leg stepping affects the other legs. Ludwar et al. (2005a) first addressed this issue by investigating the influence of a single stepping front leg on the ispilateral middle leg. Front leg stepping induced alter- nating activity in antagonistic motoneuron (MN) pools of the ipsilateral mesothoracic hemiganglion with a clear coupling to front leg activity. This may indicate that there are phasic influences from each walking leg on its neighbors, as previously suggested by the coordination rules. I investigated what influence single front, middle and hind leg forward and backward stepping has on motoneural activity in the other hemiganglia.
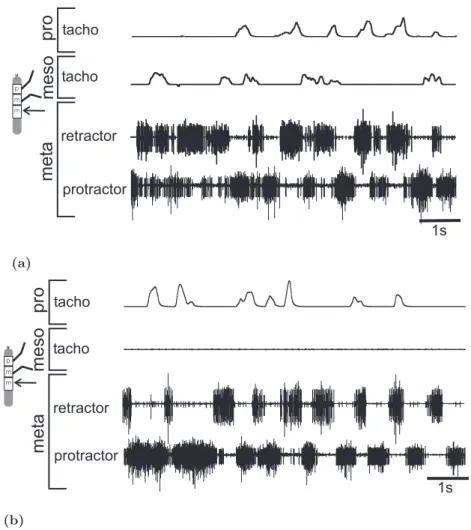
The animal walked with a single intact front, middle or hind leg on a passive treadmill while in the other hemisegments the activity of protractor and retractor coxae MNs was recorded extracellularly. In intact animals during forward walking protractor coxae MNs induce forward movement of the leg and are active mainly during swing, while retractor coxae MNs induce backward movement and are active mainly during stance (Graham and Wendler 1981; Graham 1985b). The recordings show that in the resting animal in nerves nl2 and nl5 of all hemisegments small units were tonically active (?Graham and Wendler 1981). With the beginning of a walking sequence activity in both nerves increased (data not specifically shown but see Fig. 3.2(a)). Shortly after the end of stepping the neural activity decreases back to tonic activity of few small units as before the stepping sequence.
3.1 Influences of single front leg stepping
3.1.1 Ipsilateral influences
Single front leg stepping induces a general increase of activity in all mesothoracic leg MN
pools (Ludwar et al. 2005a, b), with protractor MN activity decreasing and retractor MN
activity increasing during stance (Ludwar et al. 2005a). I extended this work by deter-
mining whether the occurrence of protractor and retractor MN activity in the front leg
step cycle is phase or time dependent and whether a systematic coupling between protrac-
tor and retractor MN activity exists. Data are shown for one representative experiment
(Fig. 3.1).
3.1 Influences of single front leg stepping 21
Extracellular recordings from mesothoracic lateral nerves nl2 and nl5, containing protrac- tor and retractor MNs, showed alternating activity during front leg stepping (Fig. 3.1(a)).
Plots of protractor and retractor MN spike phase against step cycle period (Fig. 3.1(b), 3.1(c)) showed that, regardless of step cycle period, the protractor and retractor MNs were active in preferred phases of the front leg step cycle, as indicated by the dense horizontal bands in the plots. Protractor MN spikes primarily occurred between 180
°and 360
°of front leg step cycle and retractor MN spikes between 0
°and 180
°, independent of the actual step cycle duration. The red curve in figure 3.1(b) shows the frequency of steps over the step cycle durations. A clear peak is visible that shows that most of the steps had a step cycle duration around 1,5 seconds.
The histogram gives the distribution of protractor and retractor MN spikes in front leg step cycle for 58 steps (Fig. 3.1(d)). Retractor MN activity was maximal between 30
°and 60
°of front leg step cycle and sharply decreased at phase angles greater than 180
°. Protractor MN activity increased at 180
°of step cycle and was maximal between 270
°and 300
°. The mean end of stance was at 146
°of the step cycle, as indicated by the black square (error bar is mean angular deviation after Batschelet (1981)) at the top of the histogram. Retractor MNs were thus active primarily during stance and protractor MNs during swing.
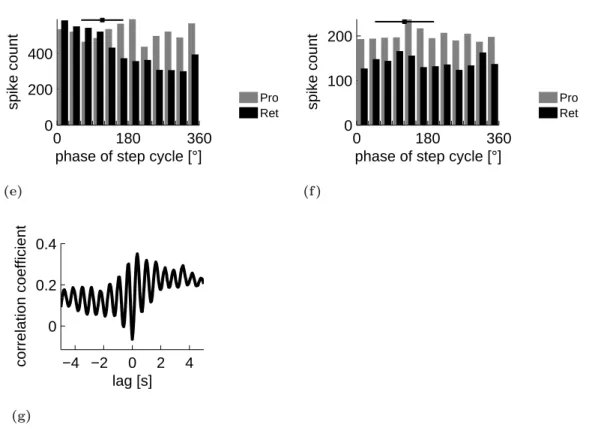
To investigate whether a systematic relationship between protractor and retractor MN activity existed, protractor and retractor MN activity were cross correlated (Fig. 3.1(e)).
In the cross correlation function a clear oscillation is visible with a maximal negative cor- relation at 0 seconds time shift, indicating an alternating coupling between protractor and retractor MN activity. Although this analysis is independent of step cycle phasing, this alternating coupling is not surprising considering the phase dependency of protractor and retractor MN activity on front leg steps and the fact that the distribution of step cycle periods had a relatively sharp peak at 1,5 s (Fig. 3.1(b)). Nevertheless, it is important to show for comparison to the other data of the following experiments. Similar coupling was observed in nine of eleven experiments.
Figures 3.1(f) and 3.1(g) show polar plots of the mean vectors of protractor and retractor
22 3 Activation of the walking system
p m m
flex. EMG tacho
retractor protractor
1s
pro meso
(a)
1 2 3 4
0 180 360
step cycle duration [s]
phase of spikes [°]
n=58
(b)
1 2 3 4
0 180 360
step cycle duration [s]
phase of spikes [°]
(c)
0 180 360
0 200 400
phase of step cycle [°]
spike count Pro
Ret
(d)
−4 −2 0 2 4
−0.5 0 0.5
correlation coefficient
lag [s]
(e)
0.25 0.5 30
210
60
240
90 270
120 300
150 330
180 0
* *
*
*
*
*
*
*
*
(f )
0.25 0.5 30
210
60
240
90 270
120 300
150 330
180 0
* ** * *
*
*
* *
(g)
3.1 Influences of single front leg stepping 23
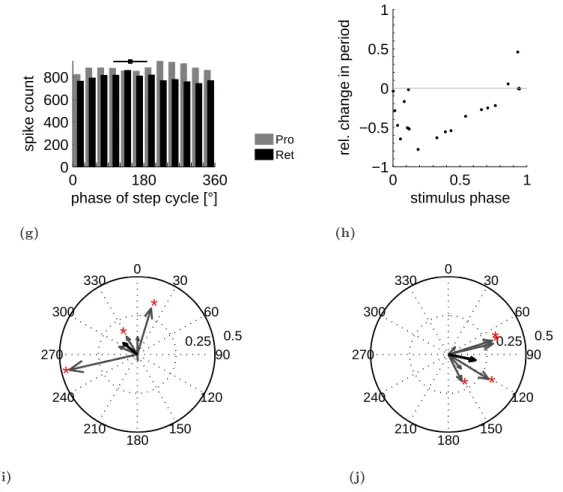
Figure 3.1:(a) Mesothoracic retractor and protractor coxae MN activity recorded from nerves nl5 (retr.) and nl2 (protr.) while the ipsilateral front leg performed walking movements on a passive treadmill. Front leg flexor EMG and treadmill velocity were monitored. The end of stance phase is marked for two steps by black arrows. Phase of (b) protractor and (c) retractor MN spikes in front leg step cycle (beginning of stance to beginning of next stance) plotted against step cycle duration.
Protractor MN spikes occurred between 180° and 360° of front leg step cycle and retractor MN spikes between 0° and 180°, independent of step cycle duration. The red curve (smoothed) shows the frequency of steps over the step cycle duration in arbitrary units. (d) Distribution of protractor (grey) and retractor (black) MN activity in front leg step cycle for 58 steps. Black square at top marks average end of stance phase, error bars are mean angular deviation. Protractor MN activity had a maximum between 270° and 300°. Retractor MN activity had a maximum during front leg stance phase between 30° and 60°. (e) Cross correlation function showing alternating coupling between protractor and retractor MN activity. Similar coupling observed in 9 of 11 experiments.
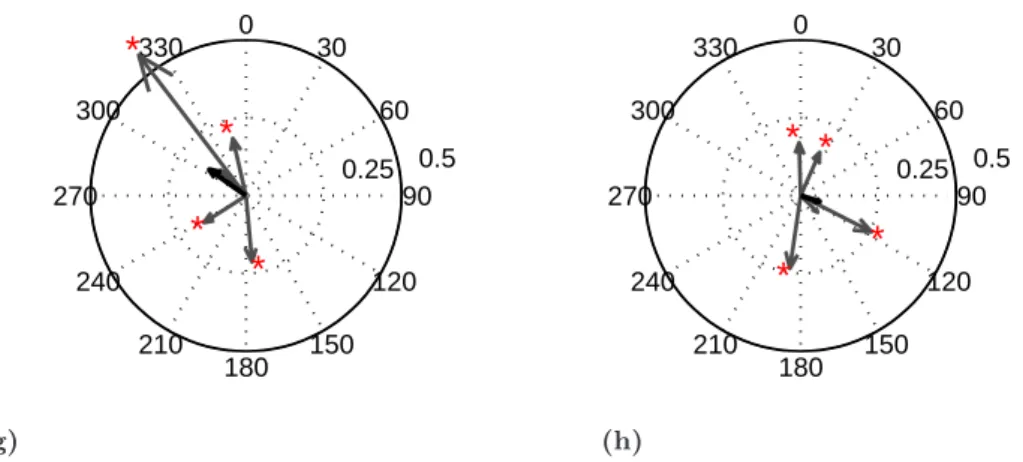
Polar plots of (f ) protractor MN activity and (g) retractor MN activity in front leg step cycle for eleven experiments (grey arrows) and mean vector of all experiments (black arrows) (radius of cycle = 0,5). Each vector points in direction of the mean phase of spike activity in front leg step cycle. Consistently for all experiments protractor MN activity had an overall mean phase of about 246° (182° - 315°) and retractor MN activity of about 86°(58°- 135°). Red stars mark significant vectors.
24 3 Activation of the walking system
MN activity in front leg step cycle for all eleven experiments. The plot summarizes the data from the experiments not shown in detail and shows how consistent the observed results were across the experiments. Each grey vector corresponds to one experiment and the black vector is the mean vector of all experiments. Each vector points in direction of the mean phase of activity and its length is between 0 and 1. The radius of the circle is 0,5.
A vector length of one indicates that all the data points coincide. The mean phase of pro- tractor and retractor MN activity was consistent throughout the experiments. Protractor MN activity covered an angle from 182
°to 315
°with a mean phase for all experiments of 246
°. Retractor MN activity covered a range from 58
°to 135
°with an overall mean phase of 86
°of front leg step cycle.
In summary, front leg stepping elicited alternating activity in ipsilateral mesothoracic pro- tractor and retractor MNs. This pattern was phase coupled to the front leg step cycle.
Middle leg retractor MNs were active during front leg stance and protractor MNs during front leg swing phase. Thus, front leg stepping had a patterning influence on mesothoracic protractor and retractor MNs.
Next, it was investigated whether and how single front leg stepping affected ipsilateral hind leg MN activity. During front leg stepping metathoracic protractor and retractor MN activity increased (Fig. 3.2(a)) (N=7), but this activity was less clearly structured than in the mesothoracic protractor and retractor MNs (Fig. 3.1(a)). The phase plots show that protractor and retractor MN spikes were widely distributed over front leg step cycle at all of step cycle lengths (Fig. 3.2(b), 3.2(c)) (that is, obvious no horizontal ”bands”
are present, compare to Fig. 3.1(b), 3.1(c)). The frequency of steps over the step cycle du- ration (red curve in figure 3.2(b)) shows a clear peak around one second step cycle period.
The histogram (Fig. 3.2(d)) for 49 front leg steps reveals that protractor MN activity was maximal between 240
°and 270
°of the front leg step cycle and retractor MN activity was maximal at the beginning of stance phase between 0
°and 30
°.
The cross correlation function (Fig. 3.2(e)) is dominated by a broad peak around zero.
This is due to the fact that activity in both MN pools increased together during front leg stepping sequences. No clear oscillation can be seen in the cross correlation function al- though front leg stepping was regular and had a dominant step cycle period (Fig. 3.2(b)).
This indicates that protractor and retractor MN activity was not permanently and sys-
3.1 Influences of single front leg stepping 25
tacho
retractor
protractor
1s
p m m
pro met a
(a)
1 2 3 4
0 180 360
step cycle duration [s]
phase of spikes [°]
n=49
(b)
1 2 3 4
0 180 360
step cycle duration [s]
phase of spikes [°]
(c)
0 180 360
0 200 400
phase of step cycle [°]
spike count Pro
Ret
(d)
−4 −2 0 2 4
0 0.5 1
correlation coefficient
lag [s]
(e)
0.25 0.5 30
210
60
240
90 270
120 300
150 330
180 0
*
*
*
(f )
0.25 0.5 30
210
60
240
90 270
120 300
150 330
180 0
* *
*
*
*
(g)
26 3 Activation of the walking system
Figure 3.2:(a) Metathoracic protractor and retractor MN activity during front leg stepping. No clear bursts are visible but a modulation of the motoneural activities. Phase of (b) protractor and (c) retractor MN spikes in front leg step cycle plotted against step cycle duration. No obvious phase or time dependence of MN activity on front leg step cycle is present. The red curve (smoothed) shows the frequency of steps over the step cycle duration in arbitrary units. (d) Distribution of metathoracic protractor and retractor MN activity in front leg step cycle for 49 steps. Retractor MN activity had a maximum between 0° and 30°. Protractor MN activity had a maximum between 240° and 270°. (e) The cross correlation function is dominated by a broad peak around zero, indicating that activity in both MN pools increased together during front leg stepping sequences.
No clear oscillation can be seen in the cross correlation function indicating that protractor and retractor MN activity was not permanently and systematically phase coupled with a constant phase shift. Polar plots of mean phases of (f ) protractor and (g) retractor MN activity in front leg step cycle for six experiments (grey arrows) and mean vector of all experiments (black arrows). Mean phases of protractor MN activity were variable between the experiments with an overall mean phase of 151° (71° - 240°). Retractor MN activity had an overall mean phase of 74° (38°- 92°) of front leg step cycle.
tematically phase coupled with a constant phase shift.
The polar plots for the seven experiments show mean phases of activity for protractor and retractor MNs. The spike distribution is not normal (Fig. 3.2(d)) but unimodal, and as a consequence the mean vector does not point exactly in the direction of the maximum of the distribution. Nevertheless, this analysis shows the preferred phase of activity and the similarity between experiments. The polar plot reveals an overall mean phase for protrac- tor MN activity at 151
°(Fig. 3.2(f)), but the mean phases of the different experiments covered an angle from 71
°to 240
°. For retractor MNs the polar plot (Fig. 3.2(g)) reveals an overall mean phase at 74
°of front leg step cycle with mean phases between 38
°and 92
°for the different experiments. Compared to the polar plots of mesothoracic protractor and retractor MN activity (Fig. 3.1(f), 3.1(g))), vector direction is much more variable, and vector length is generally shorter, indicating that each experiment’s data points were less concentrated in one direction.
In summary, in metathoracic protractor and retractor MNs there was an increase in activ-
ity during front leg stepping. However, no rhythmic activity pattern was present, although
3.1 Influences of single front leg stepping 27
protractor and retractor MN activity increased with the beginning of a stepping sequence and was slightly modulated by the steps. No systematic coupling between protractor and retractor MN activity was observed. Thus, on the ipsilateral side the influence of front leg stepping appeared to decrease from rostral to caudal.
3.1.2 Contralateral influences
Front leg stepping likewise induced in the coxal MNs of all three contralateral hemiganglia a simultaneous activity increase that was slightly modulated with the steps. No systematic coupling between protractor and retractor MNs was observed for any of the contralateral hemiganglia. Only the polar plots for protractor and retractor MN activity in the front leg step cycle are shown (Fig. 3.3).
Front leg: Protractor and retractor MN activity showed a consistent and nearly identical
phase preference in front leg step cycle throughout the four experiments (Fig. 3.3(a), 3.3(b)).
The overall mean phase for protractor MN activity was 88
°with the individual experiment mean phases covering angles between 39
°and 125
°(Fig. 3.3(a)). Retractor MN activity had an overall mean phase at 71
°with individual mean phases between 38
°and 111
°for the different experiments (Fig. 3.3(b)).
Middle leg: Contralateral mesothoracic protrac-tor MN activity had an overall mean phase of 158
°covering a range from 120
°to 210
°(N=7) (Fig. 3.3(c)). The overall mean phase for retractor MN activity was 48
°of front leg step cycle, with mean phases for the individual experiments between 357
°and 138
°(Fig. 3.3(d)).
Hind leg: Metathoracic protractor MN activity had a mean phase of fourexperiments of 78
°(73
°to 187
°) (Fig. 3.3(e)). Retractor MN activity had an overall mean phase of 119
°(21
°to 114
°) (Fig. 3.3(f)). Comparing the range of mean phases of protractor and retractor MN activity for the different contralateral ganglia shows that they overlap around 120
°for protractor MN activity (Fig. 3.3(g)) and around 60
°for retractor MN activity (Fig. 3.3(h)).
Taken together, these data show that front leg forward stepping had a strongly modulat-
ing influence eliciting alternating activity only on ipsilateral mesothoracic protractor and
retractor MNs. In all other hemisegments front leg stepping lead to a general activity
28 3 Activation of the walking system
0.25 0.5 30
210
60
240
90 270
120 300
150 330
180 0
*
*
(a)
0.25 0.5 30
210
60
240
90 270
120 300
150 330
180 0
*
* p
m m p m m
(b)
0.25 0.5 30
210
60
240
90 270
120 300
150 330
180 0
* * *
(c)
0.25 0.5 30
210
60
240
90 270
120 300
150 330
180 0
* *
* *
p m m p m m
(d)
0.25 0.5 30
210
60
240
90 270
120 300
150 330
180 0
*
*
(e)
0.25 0.5 30
210
60
240
90 270
120 300
150 330
180 0
*
** p
m m p m m
(f )
(g) (h)
3.2 Influences of single middle leg stepping 29
Figure 3.3: Polar Plots summarizing influence of front leg stepping on protractor and retrac- tor MNs of the hemiganglia contralateral the walking front. The radius of each circle is 0.5.
(a), (b): Polar plots of mean phases of prothoracic (a) protractor and (b) retractor MN activity in front leg step cycle (N=5). The overall mean phase of protractor MN activity was 88°(39°- 125°).
The overall mean phase of retractor MN activity was 71°(38°- 111°). (c), (d): Polar plots of mean phase of mesothoracic (c) protractor and (d) retractor MN activity in front leg step cycle (N=7).
The overall mean phase of protractor MN activity was 158° (120° - 210°).The overall mean phase of retractor MN activity was 48°(357°- 138°). (e), (f ): Polar plots of mean phases of metathoracic (e) protractor and (f) retractor MN activity in front leg step cycle (N=4). The overall mean phase of protractor MN activity was 78° (73° - 178°).The overall mean phase of retractor MN activity was 119°(21°- 114°). (g), (h): The ranges of mean phases for (g) protractor and (h) retractor MN activity in each of the contralateral hemiganglia (light grey: prothoracic contralateral hemiganglion;
grey: mesothoracic; dark grey: metathoracic) and the sector where they overlap (red).
increase that was slightly modulated with the steps.
3.2 Influences of single middle leg stepping
3.2.1 Ipsilateral influences
We next investigated the effect of middle leg stepping on the various hemiganglia. The single stepping middle leg experiments were performed with two different single leg prepa- rations. In the first the middle leg stepped sideways on a treadmill perpendicular to the body axis, the traditional fashion for the single middle leg preparation (Fischer et al.
2001; J.P Gabriel and B¨ uschges 2003) (N=5). In the second the treadmill was positioned parallel to the animal’s body axis of resulting in walking more resembling natural forward walking (N=6).
In the first preparation, activity in ipsilateral metathoracic protractor and retractor MNs
increased but no clear activity pattern was present (Fig. 3.4). Depending on the exper-
iment, the increase in activity could be stronger in one of the two MN pools than the
other. For instance in the 26 steps analyzed in figure 3.4(b), protractor MN activity in-
creased during stance phase with a maximum between 30
°and 60
°of middle leg step cycle
30 3 Activation of the walking system
tacho retractor
protractor
1s
p m m
metameso
(a)
0 180 360
0 50 100 150
phase of step cycle [°]
spike count ProRet
(b)
0.25 0.5 30
210
60
240
90 270
120 300
150 330
180 0
*
** *
*
(c)
0.25 0.5 30
210
60
240
90 270
120 300
150 330
180 0
*
*
* *
(d)
tacho retractor
protractor
1s
p m m
metameso
(e)
0 180 360
0 20 40 60
phase of step cycle [°]
spike count Pro
Ret
(f )
0.25 0.5 30
210
60
240
90 270
120 300
150 330
180 0
* *
*
*
* (g)
0.25 0.5 30
210
60
240
90 270
120 300
150 330
180 0
*
*
* *
*
*
(h)
3.2 Influences of single middle leg stepping 31
Figure 3.4: (a) Metathoracic protractor and retractor MN activity during sideways middle leg stepping. (b) Distribution of protractor (grey) and retractor (black) MN activity in the middle leg step cycle for 26 sideways steps. Protractor MN activity was maximal during middle leg stance phase between 30° and 60°. Retractor MN activity was in this experiment averaged 20% of protrac- tor MN activity and was maximal between 0°and 30°. Polar plots of mean phases of (c) protractor MN activity and (d) retractor MN activity for five experiments (grey arrows) and mean vector of all experiments (black arrow) for the sideways stepping preparation. The overall mean phase of protractor MN activity was 72° (45° - 107°). Retractor mean phase was highly variable with an overall mean phase of 9°. (e) Recording of metathoracic protractor and retractor MN activity during parallel middle leg stepping. It was often observed that either protractor or retractor MN activity was much higher during a walking sequence. (f) Distribution of protractor (grey) and re- tractor (black) MN activity in middle leg step cycle for 24 parallel steps. Metathoracic protractor MN activity was maximal between 90°and 120°. Retractor MN activity increased at the beginning and the end of the stepping cycle with a maximum between 30° and 60°. Polar plots of mean phases of (g) protractor MN activity and (h) retractor MN activity in the middle leg step cycle for five experiments (grey arrows) and mean vector of all experiments (black arrow) for the parallel stepping preparation. The overall mean phase of protractor MN activity was 202° (154° - 206°).
Mean phases of retractor MN activity were again highly variable between experiments.