ANAL YSIS
Assessment of the Philippine Social Protection Floor Policies
XXXXXXXXXXXXXXXXXXXXX
Published by:
Diakonisches Werk der EKD e.V.
for Brot für die Welt Stafflenbergstraße 76 D-70184 Stuttgart Germany
Phone: ++49 711/2159-568 E-Mail: info@brot-fuer-die-welt.de www.brot-fuer-die-welt.de
Author: Dr. Axel Weber
Editorial staff: Dr. Lucimara Brait-Poplawski, Jörg Jenrich, Dorothea Körner, Christine Lottje Layout: Don Design
Responsible: Thomas Sandner Cover photo: Christof Krackhardt Art.Nr.: 129 601 270
Stuttgart, June 2012
Dr. Axel Weber
Abbreviations 9
Preface 11
1 Introduction 12
2 Context 12
2.1 Geography and Administration 12
2.2 Population 12
2.3 Labor Market 13
2.4 The Economy 14
2.5 Government Expenditure 16
2.6 Health 16
2.7 Poverty and Inequality 19
3 Description of Social Protection in the Philippines 21
3.1 Labor Market Programs 21
3.1.1 Unemployment Benefits 21
3.1.2 The Public Employment Service Office 22
3.1.3 Promotion of Rural Employment (PRESEED) 22
3.1.4 Kalinga sa Manggagawa (Workers Microfinance Program) 23
3.1.5 Kasanayan at Hanapbuhay (KasH) 23
3.1.6 Tulong Alalay sa Taong May Kapansanan 24
3.1.7 Training Programs 24
3.2 Social Insurance Programs 25
3.2.1 Social Security Security System (SSS) and Government Service
Insurance System (GSIS) 25
3.2.2 Loans and Pension Program 27
3.2.3 Health insurance 27
3.3 Social Assistance and Welfare Programs 32
3.3.1 Pantawid Pamilyang Pilipino Program (4Ps) 32
3.3.2 Senior Citizens Medicine and Food Discounts 33
3.3.3 Rehabilitation Centers (AVRC and NVRC) 34
3.3.4 The Social Amelioration Program (SAP) 34
3.3.5 Disaster/Emergency Relief 34
3.3.6 The Philippine Charity Sweepstakes Office (PCSO) 35
3.3.7 The Tindahan Natin 35
3.4 Micro Programs 36
3.4.1 The Kapit Bisig Laban sa Kahirapan (KALAHI-CIDSS) 36 3.4.2 Self-Employment Assistance – Kauniaran project (SEA-K) 36
3.4.3 Microfinance 36
3.4.4 Micro-insurance 39
3.4.5 Agricultural insurance 41
3.5 Child Protection 41
3.5.1 The Food for School Program 41
3.5.2 Residential Centers for Children 42
3.5.3 Child Protection Services 42
4 Gap Analysis 44
4.1 Financial Assessment 44
4.2 Coverage of Social Protection Programs 45
4.3 Health Insurance Support Value 46
4.4 Lending Based on Pension Entitlements 47
4.5 Gaps of Social Assistance (4P) 47
5 Costing Exercise 50
5.1 Health 50
5.2 Unemployment Insurance 52
5.3 Pension 54
5.4 Social Assistance 54
5.5 Summary 55
6 Conclusion and Recommendations 57
References 58
Figures
Figure 1: Employed Persons by Industry Group 13
Figure 2: GINI in the Philippines 1985-2005 16
Figure 3: Expenditure Structure of PhilHealth 18
Figure 4: PhilHealth Membership Structure 28
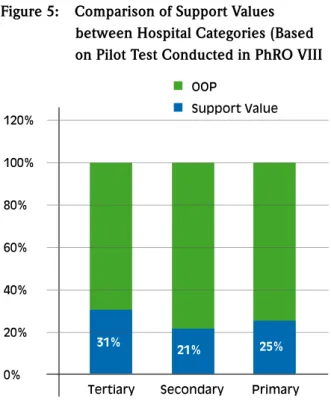
Figure 5: Comparison of Support Values between Hospital Categories
(Based on Pilot Test Conducted in PhRO VIII 30
Figure 6: Support Values of Different Benefit Items 30
Tables
Table 1: Philippine Labor Market 13
Table 2: Unemployment and Underemployment Rates 2009 14
Table 3: Size of Establishments Formal Sector 2007 15
Table 4: Number of Establishments by Employment Size and Sector, 2007 15
Table 5: Public Budget Philippines, 2009-2012 17
Table 6: Health Expenditure in Selected Countries, 2006 17 Table 7: Health Expenditure Structure in the Philippines 19
Table 8: Poverty Incidence Philippines 19
Table 9: Benefits from Statutory Social Insurance Coverage 25
Table 10: Social Security System Benefits 26
Table 11: SSS Membership and Expenditures, 2003-2005 27
Table 12: Enrolment 2008 and Target ( estimates) 29
Table 13: Coverage According to Regions, January 2009 29
Figure 7: Relative Consumption 31
Table 14: Development of 4P, 2007-2011 32
Table 15: Institutional Framework for Microfinance 37
Table 16: MBA Membership as of 31 December 2005 39
Table 17: Features of CARD’s Micro-insurance Scheme 40
Table 18: Residential Centers for Children and Youths 42 Table 19: Bantay Bata Services in Manila and Davao, Dec. 2005 42
Table 20: SP Expenditure by Category and % 2010 44
Table 21: Beneficiaries of Social Protection Programs in the Philippines 45 Table 22: Social Protection Target Groups, Types of Social Protection
Programs and Reference Populations 45
Table 23: Target Group Coverage Rates (2010) 46
Table 24: Largest SP Programs in Terms of Beneficiaries 46 Table 25: Shortages for Critical School Inputs, SY 2011-2012 49
Table 26: Costs per Case Philippines, 2008 50
Table 27: PhilHealth Expenses 2009 51
Table 28: Sensitivity Test 51
Table 29: Household Income Distribution 52
Table 30: Parameters of Simulation 52
Table 31: Contribution Rates under Different Levels of Evasion and
Duration of Benefits 53
Table 32: Contribution Rates under Different Take-up Rates and Benefit
Duration; Assumed Monthly Benefit Level 50 Percent of AMSC 53 Table 33: Contribution Rates under Different Take-up Rates and Benefit
Duration; Assumed Monthly Benefit Level 60 Percent of AMSC 53 Table 34: Contribution Rates Different Levels of Unemployment
(Benefit Level 50 percent) 54
Table 35: Estimate of Costs Pensions 54
Table 36: Estimate of Costs Social Assistance 55
Table 37: Current and Expected Coverage Rates 55
Table 38: Estimated Costs 56
ABS-CBN Alto-Broadcasting System-Chronicle Broadcasting Network ADB Asian Development Bank
AMSC Average Monthly Salary Credit
ARMM Autonomous Region of Muslim Mindanao ASEAN Association of Southeast Asian Nations AVRC Area Vocational Rehabilitation Center BLES Bureau of Labor and Employment Statistics BMBE Barangay Micro Business Enterprise
CARD Center for Agriculture and Rural Development CBO Community-Based Organization
CCT Conditional Cash Transfer
CEA Certificate of Educational Assistance CWSN Children with Special Needs DBM Department Budget Management DOH Department of Health
DOLE Department of Labor and Employment
DSWD Department of Social Welfare and Development EC Employee Compensation
ECC Employee Compensation Commission ECF Employee Compensation Fund FDI Foreign Direct Investment FSP Food for School Program GDP Gross Domestic Product
GFI Government Financial Institutions
GOCC Government-Owned and Controlled Corporation GSIS Government Service Insurance System
GTZ Gesellschaft für Technische Zusammenarbeit HDMF Home Development Mutual Fund
HMO Health Maintenance Organization
I-CARE Invigorating Constituent Assistance in Reinforcing Employment ILO International Labor Organization
IMP Iskolar ng Mahirap na Pamilya (Scholar of Poor Family) IPP Individually Paying Program
JBIC Japan Bank for International Cooporation JSDF Japan Social Development Fund
KasH Kasanayan at Hanapbuhay (training and capacity building program) LBP Land Bank of the Philippines
LGU Local Government Unit MBA Mutual Benefit Association
MCF Mentoring for Commercialization Funding
MFI Micro Finance Institution
MILF Moro Islamic Liberation MMR Maternal Mortality Rate
NAPC National Anti-Poverty Commission NCC National Credit Council
NCR National Capital Region
NDHS National Demographic and Health Survey NEC National Epidemiology Center
NEDA National Economic and Development Authority NGO Non-Governmental Organization
NHIP National Health Insurance Program NLSF National Livelihood Support Fund NPA New People’s Army
NSCB National Statistic Coordination Board NSO National Statistics Office
NVRC National Vocational Rehabilitation Center ODA Official Development Assistance
OFW Overseas Filipino Workers OOP Out Of Pocket Payment OSI Other Social Insurance
PCFC People’s Credit and Finance Corporation PCIC Philippine Crop Insurance Corporation PCSO Philippine Charity Sweepstakes Office PESO Public Employment Service Office PHP Philippine Peso
PhRO PhilHealth Regional Office PO People’s Organization PWD Persons with Disability RHU Rural Health Unit
SAP Social Amelioration Program SEPO State Economic Planning Office SONA State of the Nation Address SIP Social Inclusion Project SP Sponsored Program SSS Service Security System SUC State Universities and Colleges
TESDA Technical Education Skills Development Authority TVET Technical Vocational Education and Training
UNICEF United Nations International Children’s Emergency Fund
US-AID United States Agency for International Development
WAP Work Appreciation Program
ANAL Preface
The issue of social security has recently started to attract increasing attention in the development policy debates, dues to the encouraging experiences of various develop- ing and emerging countries that have succeeded in ab- sorbing the social impacts of global crisis by expanding their public social services. The hope that an adequate social participation of broad segments of the popula- tion is guaranteed solely by economic growth is gradu- ally fading. For recent developments have shown: the gradual deregulation and opening of economies indeed strengthen the global exchange of information, capital and goods; but at the same time it is also aggravating social inequalities.
The food, energy, and financial crises of recent years have disenchanted long-established doctrines. In 2009, due to those crises the number of people suffering from hunger has for the first time increased to over one bil- lion. In particular the majority of the poorer countries in the Global South see themselves not capable of financ- ing national programs in order to strengthen the pur- chasing power. On the other hand, the budgetary flex- ibility of the western industrialized countries is equally put under significant pressure by the disruption of the financial markets. However, some middle income coun- tries succeeded in improving the food security of poor people and in strengthening the purchasing power of lo- cal markets due to the expansion of social programs and the increasing of the minimum wages. In the context of the global crisis, high-level committees of the United Nations and the G20 have taken up these promising developments. The stabilizing effect which a systematic creation of a basic social protection has both on food se- curity of the most vulnerable groups and on the national economy, is generally acknowledged.
Moreover, this state obligation can be fulfilled by every country, even by the poorer nations. Therefore, the United Nations Chief Executives Board for Coordination (UNCEB) and the International Labour Organization (ILO) launched the “Social Protection Floor”-Initiative as a human rights-based approach to social security.
In order to extend the coverage of social protection to all human beings, some essential issues have first to be clarified: An inventory of the existing social programs is necessary to prevent the fragmentation of the programs.
At the same time, the modernization of government in- stitutions and the provision of a national budget for a non-contributory system of social security are indispen- sable. Even the new models of non-contributory social systems are still based on the principles of social security and market economy. With regard to indigenous people, these models therefore need a fundamental adaptation to their cultural realities.
The “Social Protection Floor” concept provides a model for the expansion of the coverage in order to ensure a minimum level of social protection for the entire popu- lation of a country – especially for the most vulnerable groups like women, children, elderly and disabled peo- ple, as well as to the unemployed and underemployed.
With regard to the demographic structure of countries in the Global South, this concept also provides a basis for investments in the empowerment of young people.
The „Assessment of the Philippine Social Protection Floor Policies” – a study commissioned by “Brot für die Welt” in cooperation with the International La- bour Organization (ILO) – is a contribution to realize the initiative on a global level. Even though ensuring the human right to social security is primarily a state responsibility, the results of the study shall be used to enter into dialogue with civil society in order to expand the system of social security; not only in the Philippines, but in other countries as well. With this publication, we hope to give fresh impetus for further studies in several countries and regions all over the world with a different economic development status.
We would like to express our gratitude to the Inter- national Labour Organization for the cooperation and especially to the author of the study, Dr. Axel Weber, for his in-depth research and valuable results.
Dr. Lucimara Brait-Poplawski
Brot für die Welt
ANAL YSIS 32
1 Introduction
This study is meant as a contribution to the discussion about social protection in the Philippines. It has been in- spired by a series of previous studies and contributions, mainly by ILO and ADB.
The Government has undertaken major efforts in the last decade, namely the introduction of the 4-P CCT scheme, the enlargement of the sponsored membership of PhilHealth and the ongoing discussions about the in- troduction of an unemployment scheme inspired by the example of e.g. Vietnam.
Nevertheless this analysis highlights gaps and deficien- cies in order to strengthen the general trend in the country to improve coverage and benefits of social pro- tection. We would be happy to get a broad and criti- cal feedback, and maybe even better up-to date data than the one we used, though we are sure that our conclusions are relevant and valid. We encourage all readers to provide us with additional data and informa- tion in order to improve the report. We are confident that the report as it is reflects well the situation in the Philippines and the existing gaps in social protection.
2 Context
2.1 Geography and Administration
The Philippines is a group of islands in southeastern Asia between the Philippine Sea and the South China Sea, east of Vietnam. It has three major island groupings – Luzon, Visayas and Mindanao. It has a land area of 300,000 sq km
2. and an extensive coastline of about 36,289 km.
By virtue of the “Integrated Reorganization Plan” issued by President Ferdinand E. Marcos in 1972 the country
was divided into eleven administrative and planning regions, each with a regional center or capital. Today the number of regions has grown to seventeen. Key ministries then (now called departments) and other government agencies were regionalized and decentral- ized. Within each region, there are local government units at the provincial, city, municipal and barangay
1levels. As of the year 2010, the Philippines has 79 provinces, 117 cities, 1,505 municipalities and 41,974 barangays.
In terms of the country’s political structure, the Philip- pines has a presidential form of government with three separate branches: the executive, the two-chamber legislature and the judiciary. The president is both the head of state and the head of government within a multi-party system. The executive power is exercised by the government under the leadership of the president.
Legislative power is vested in both the government and the two-chamber congress – the Senate (the upper chamber) and the House of Representatives (the lower chamber). Judicial power is exercised by the courts with the Supreme Court of the Philippines as the highest judicial body.
2.2 Population
The current population (2011) of the Philippines is 95.6 million making it the world’s 12th most populous country. The country has one of the highest population growth rates in East Asia, exceeded only by Cambodia and Laos. From an annual rate of 2.36 percent in 1995 – 2000 population growth rate decelerated to 1.6 percent in 2010. Population is projected to grow at an average rate of 1.5 percent from 2011 to 2015. By 2015 the country’s population reaches 110 million.
The country has one of the youngest populations among Asian countries with those in the age 25-39 bracket comprising the dominant group; the median age is just 22.5 years. Amongst Asian countries only Malaysia, In- dia and the Philippines show positive growth on the age
1 Barangays or villages are the smallest political units.
ANAL
group below 25 years old whilst all the other countries in the region are experiencing an ageing population. Pro- jections show that people over 65 years old will account for only 8 percent of the Philippine population in 2030.
The Philippines is rated as one of the fastest urbanizing developing countries in Asia. About 54 percent of the country’s population live in the urban areas, compared to less than 50 percent in Indonesia, around 50 percent in China and 33 percent in Thailand. The urban growth rate has averaged around 4 percent annually for the last 50 years – substantially above the overall population growth rate. This trend results from factors such as high natural increase, rapid rural-urban migration and reclas- sification of local government units.
26 out of the country’s 65 cities were classified as 100 percent urban in 1995. By the year 2000 the total number of Philippine cities has grown to 100 and there are now 117 cities. By 2030, it is projected that three out of every four Filipinos will live in cities.
2.3 Labor Market
The working age population in the Philippines is 62 mil- lion (2011). The labor force, based on a participation rate of 66.3 percent is 41.2 million. Out of these, 6.4 percent are unemployed. Another 19.1 percent are un- deremploye (Table 1).
The largest employer is the service sector (see Figure 1), mainly wholesale and retail, transport, public sector, education and private households. The share of employ- ment in industry is shrinking, while those in agriculture and services are on the increase.
Services
Agriculture
Industry
Figure 1: Employed Persons by Industry Group
35%
50%
15%
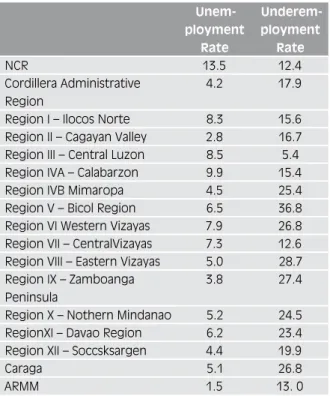
Table 2 shows the unemployment and underemploy- ment rates in the different regions in the Philippines which vary considerably. The highest unemployment rate is in the National Capital Region (13.5 percent), the lowest in Region II (Cagayan Valley, 2.8 percent) and ARM Mindanao (1.5 percent).
The largest group of the unemployed are young people between 15 and 24 (50 percent of all unemployed). In- terestingly, nearly 85 percent of the unemployed have a high school or college diploma. Only very few have no education at all or elementary school only.
Overall unemployment in the Philippines has been so far stable (2011) compared to the previous years. Un- deremployment has even slightly decreased (see Table 1) and it lies within the longer lasting trend.
In the wake of the global financial crisis, the most vul- nerable workers are those in the export-oriented indus- tries such as electronics, call centers and textile manu- facturing. Indeed, several companies reported either laying off workers or cutting working hours as the crisis reduced demand for Philippine exports. The Philippine Labor Department reported that some 40,000 workers were retrenched, 33,000 workers experienced shorter working hours while over 5,400 overseas Filipino work- ers were displaced because of the financial crisis. The figures compared to total employment are small. In addi- tion, the economy was kept afloat by the steady flow of
2010 2011
Population 15+ 61,169,000 62,165,000
Participation Rate 64.20 66.30
Unemployment Rate 7.10 6.40
Underemployment Rate 19.60 19.10
Table 1: Philippine Labor Market
Source: National Statistics Office 2011
ANAL YSIS 32
Table 2: Unemployment and Underemploy- ment Rates 2009
Unem- ployment
Rate
Underem- ployment
Rate
NCR 13.5 12.4
Cordillera Administrative Region
4.2 17.9
Region I – Ilocos Norte 8.3 15.6
Region II – Cagayan Valley 2.8 16.7 Region III – Central Luzon 8.5 5.4
Region IVA – Calabarzon 9.9 15.4
Region IVB Mimaropa 4.5 25.4
Region V – Bicol Region 6.5 36.8
Region VI Western Vizayas 7.9 26.8 Region VII – CentralVizayas 7.3 12.6 Region VIII – Eastern Vizayas 5.0 28.7 Region IX – Zamboanga
Peninsula
3.8 27.4
Region X – Nothern Mindanao 5.2 24.5
RegionXI – Davao Region 6.2 23.4
Region XII – Soccsksargen 4.4 19.9
Caraga 5.1 26.8
ARMM 1.5 13. 0
NCR = National Capital Region
ARMM = Autonomous Region of Muslim Mindanao
remittances despite forecasts by the international finan- cial institutions that these would decline. The National Economic and Development Authority (NEDA) forecast that in a pessimistic scenario as much as 200,000 work- ers may be laid off, as the crisis continues to hurt the local economy. But this has not yet materialized and there are signs of an economic recovery. Even pessimis- tic forecasts expect the unemployment level not to hit the double-digit levels recorded several years ago.
Nevertheless, an unemployment rate between 7 per- cent and 8 percent of the Philippine workforce is one of the highest rates in Asia (the Asian average lies around 5 percent). Also, the labor force in the Philippines is grow- ing fast due to specific demographic reasons, so that net
employment needs to increase substantially every year in order to avoid unemployment growing.
Little is known about the nature of unemployment but it is very likely that most of it is short term unemploy- ment. Firstly, there is a high level of fluctuation in the labor market in the Philippines due to relatively rigid labor laws (after six months of employment it is practi- cally impossible to retrench someone, which leads to the fact that many employers retrench workers before the completion of their six months of contract); and, secondly, there is hardly any worker in the Philippines who can afford long term unemployment, given the fact that there is practically no unemployment ben- efit.
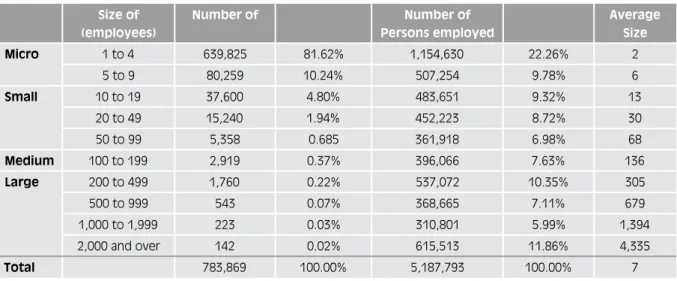
The Philippine labor market is to a large extent not for- malized. Only 9.5 million people or 25 percent (7.5 mil- lion employees and 2 million self-employed) out of 38 million workers are covered by social insurance (pub- lic and private sector). About 30 percent of the labor force in the formal sector in the Philippines works in establishments with less than ten employees (the aver- age establishment has seven employees, see also Table 3 and Table 4). Including the informal sector, nearly 70 percent of workers are in establishments of less than ten employees.
2.4 The Economy
The Philippine economy is marked by slow growth and inequity. From underperformance between the years 1998 to 2001 Gross Domestic Product grew to 4.3 percent in 2002, 4.7 percent in 2003, and about 8.9 percent in 2010.
“Coming from a high base erected by election relat- ed expenditures last year, the domestic economy continued to decelerate, posting a 3.4 percent growth during the second quarter of 2011. This is less than half the booming 8.9 percent growth in 2010”.
2Source: Bureau of Labor and Employment Statistics, 2009
2 http://www.nscb.gov.ph/sna/2011/2nd2011/2011hi2.asp
ANAL
Aside from remittances from OFW (Overseas Filipino Workers) the other drivers of growth include services which are highly dependent on telecommunications and agriculture which is vulnerable to weather distur- bance. Analysts say that these industries create little im- pact on employment generation in terms of the creation of permanent jobs for the working age population.
Analysts also project that it will take a higher, sustained growth path to make appreciable progress in poverty al- leviation given the Philippines’ high annual population growth rate and unequal distribution of income. With a population growth of 2 percent a real growth rate of 2 percent is needed to keep the per capita income con- stant. In 2003, the poorest 10 percent had 2.3 percent share in total consumption while the richest 10 per- Source: National Statistics Office 2007
Table 4: Number of Establishments by Employment Size and Sector, 2007
Total Micro Small Medium Large
Agriculture 5,765 4,190 2,303 0,160 0,152
Industry 121,832 107,288 12,116 1,241 1,187
Services 656,272 609,181 44,244 1,518 1,329
Total 783,869 720,659 58,663 2,919 2,668
% 100.0 91.9 7.5 0.4 0.3
Source: National Statistics Office 2007
Table 3: Size of Establishments Formal Sector 2007
Size of (employees)
Number of Number of
Persons employed
Average Size
Micro 1 to 4 639,825 81.62% 1,154,630 22.26% 2
5 to 9 80,259 10.24% 507,254 9.78% 6
Small 10 to 19 37,600 4.80% 483,651 9.32% 13
20 to 49 15,240 1.94% 452,223 8.72% 30
50 to 99 5,358 0.685 361,918 6.98% 68
Medium 100 to 199 2,919 0.37% 396,066 7.63% 136
Large 200 to 499 1,760 0.22% 537,072 10.35% 305
500 to 999 543 0.07% 368,665 7.11% 679
1,000 to 1,999 223 0.03% 310,801 5.99% 1,394
2,000 and over 142 0.02% 615,513 11.86% 4,335
Total 783,869 100.00% 5,187,793 100.00% 7
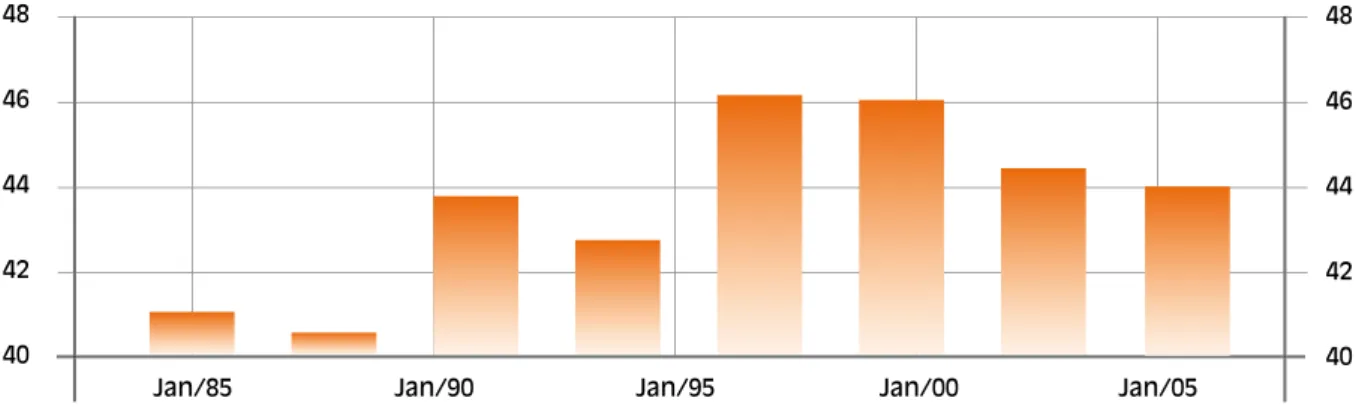
cent had about 32 percent of the total, which shows the unequal distribution of income in the country (the GINI lies above 0.40, see Figure 2). Per capita income grew by 2.9 percent in 2005 down from 3.8 percent in 2004.
Foreign direct investment has been sluggish indicating
low investor confidence on the economic and political
situation. Foreign direct investment in 2004 leveled off
at US$ 1 billion, well below the US$ 3 billion to US$ 4
billion of other ASEAN countries. For the private sector,
the investment climate is adversely affected by compli-
cated procedures, high transaction costs, infrastructure
constraints, uncertain regulation, weak financial inter-
mediation and growing competition among neighbor-
ing countries for foreign direct investment (FDI) (Amer-
ANAL YSIS 32
ican Chamber of Commerce of the Philippines 2004).
Among the top investors in the country are the United States America, Japan, China and the Netherlands.
2.5 Government Expenditure
Since 2003, the Congress passed a re-enacted budget.
3The legislated re-enacted budgets mainly comprised the primary obligation of the national government which are debt servicing and maintenance of the government bureaucracy. The bulk of the government’s debts went to debt servicing in large, unprofi table public enterprises, especially in the energy sector. Only about an average of 15 percent of total expenditures was allocated to the improvement of infrastructures and delivery of social services. The Philippines’ external debt against GDP was one of the highest amongst developing countries.
4The government has considered adopting measures to deal with huge defi cits and to source new funds for government for infrastructures, for example, cutting its sovereign bond offering. 2007 the government has ap- proved the reduction in the offshore bond issuance plan
and decided to tap cheaper offi cial development assist- ance loans and domestic borrowings. The government also plans to source a much bigger portion from ODA assisted program and project loans which have lower interest rates and longer repayment terms rather than the more expensive commercial borrowings (Dumlao 2006). 2009-2012 the public borrowing in percent of GDP went down (see Table 5).
2.6 Health
Estimated life expectancies at birth in 2005 were 68.72 and 74.74 for males and females respectively (2011 est.).
5Offi cial estimate on the infant mortality rate was about 19.34 for every 1,000 live births (2011 est.) which shows a better picture compared with the rate of 36 ten years earlier.
Much of the country’s population resides in thousands of dispersed rural villages. Local midwives and com- munity health workers therefore play an important role Source: World Bank Indicators. See http://www.tradingeconomics.com/philippines/gini-index-wb-data.html
48 46 44 42 40
48 46 44 42
40
Jan/85 Jan/90 Jan/95 Jan/00 Jan/05
3 A re-enacted budget means that mandatory expenditures of debt service, personnel expenses and internal revenue allotment for the previous years are carried on and adjusted for requirements in the ensuing budget year. The President of the Philippines as provided by the Constitu- tion reallocates line item amounts budgeted in the previous years for projects that are completed or for other reasons do not require the funds in the following year.
4 Bangko Sentral ng Pilipinas
5 http://www.indexmundi.com/philippines/life_expectancy_at_birth.html
Figure 2: GINI in the Philippines 1985-2005
ANAL
Source: Department of Finance (2012)
Table 5: Public Budget Philippines, 2009-2012
* 2010 Preliminary Actual
Source: NSCB, PhilHealth
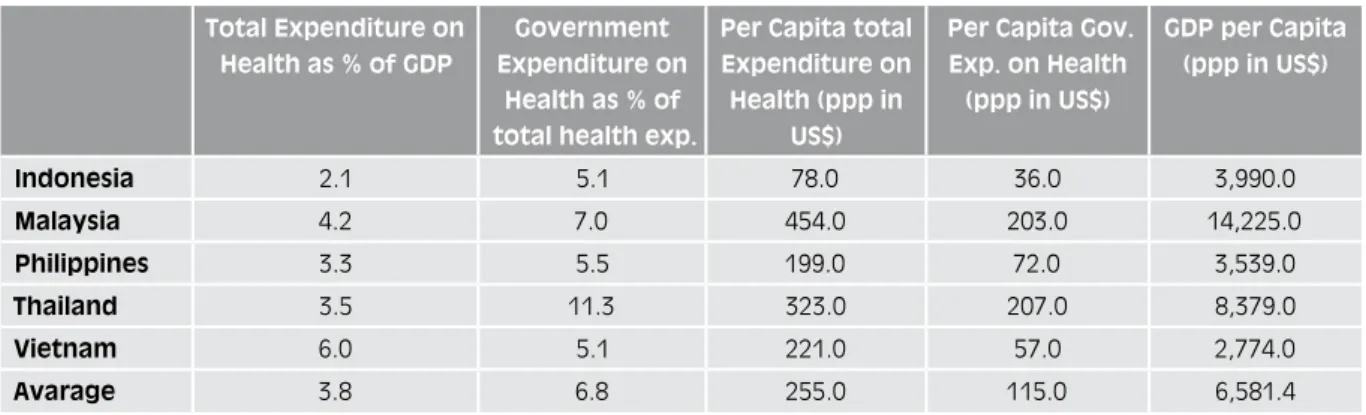
Table 6: Health Expenditure in Selected Countries, 2006
Levels (In Billion Pesos) As Percent of GDP
Particulars 2009
Actual
2010
Preliminary
2011
Revised
2012
BESF
2009
Actual
2010
Preliminary
2011
Revised
2012
BESF
Public Sector Borrowing Requirement
(329,852) (383,111) (329,682) (317,738) (4.1) (4.3) (3.3) (2,9)
National Government (298,532) (314,458) (300,000) (286,000) (3.7) (3.5) (3.0) (2.6)
CB Restructuring (8,759) (7,689) (6,095) (6,081) (0.1) (0.1) (0.1) (0.1)
Monitored Government-Owned and Controlled Corporations (GOCCs)
(19,300) (71,007) (42,035) (28,031) (0.2) (0.8) (0.4) (0.3)
Adjustment in Net Lending and Equity to GOCCs
(3,261) 9,927 18,449 2,373 (0.0) 0.1 0.2 0.0
Other Adjustment – 0.116 – – – 0.0 – –
Other Public Sector 89,706 20,285 88,265 83,755 1.1 0.2 0.9 0.8
SSS/GSIS/PHIC 44,500 39,268 39,160 30,873 0.6 0.4 0.4 0.3
Bangko Sentral ng Pilipinas (BSP) (0,168) (63,722) 1,000 1,000 (0.0) (0.7) 0.0 0.0 Government Financial Institutions 10,800 7,939 11,190 11,577 0.1 0.1 0.1 0.1
Local Government Units 34,695 33,525 * 36,915 40,305 0.4 0.4 0.4 0.4
Timing Adjustment of Interest Payments to BSP
(0.328) 0.395 – – (0.0) 0.0 – –
Other Adjustment 0.207 2,880 – – 0.0 0.0 – –
Consolidated Public Sector Surplus/(Deficit)
(240,146) (362,826) (241,417) (233,984) (3.0) (4.0) (2.4) (2.1) Nominal GDP (in billion pesos) 8,026.143 9,003.480 9,932.508 11,011.181
Total Expenditure on Health as % of GDP
Government Expenditure on
Health as % of total health exp.
Per Capita total Expenditure on Health (ppp in
US$)
Per Capita Gov.
Exp. on Health (ppp in US$)
GDP per Capita (ppp in US$)
Indonesia 2.1 5.1 78.0 36.0 3,990.0
Malaysia 4.2 7.0 454.0 203.0 14,225.0
Philippines 3.3 5.5 199.0 72.0 3,539.0
Thailand 3.5 11.3 323.0 207.0 8,379.0
Vietnam 6.0 5.1 221.0 57.0 2,774.0
Avarage 3.8 6.8 255.0 115.0 6,581.4
ANAL YSIS 32
in birth deliveries in addition to that played by doctors in the hospitals and clinics. About 68 percent of births were attended by skilled health staff, about 27 percent by trained midwife and about 4 percent by untrained hilots (traditional birth attendants/TBAs, who are often- times untrained or unskilled) from the villages (NEC- DOH). Among the poor about 21 percent of births were attended by skilled health staff compared to 92 percent in the richest quintile (WB).
Maternal mortality ratio (deaths of women from preg- nancy-related causes per 100,000 live births) has de- creased from 209 in 1990 to 150 in 2010 (NSCB).
If we compare the Philippines to similar countries in the region, it can be seen that even taking into account dif- ferent GDP levels health expenditure in percent of GDP in the Philippines is among the lowest (Table 6). This corresponds to the fi ndings of the “ADB social protection index”
6. On the other hand, coverage is among the best.
6 The study showed that the level of social protection in the Philippines is below the average of Asia. Indicators were Social Protection expendi- ture as share of GDP, coverage, distribution of benefi ts and level of benefi ts. See Baulch, Weber, Wood: Social Protection Index for Committed Poverty Reduction. Volune 2: Asia. Manila 2008.
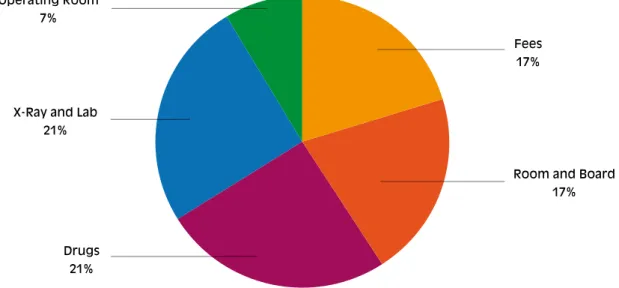
Figure 3: Expenditure Structure of PhilHealth
Source: Phil Heath
Operating Room 7%
X-Ray and Lab 21%
Drugs 21%
Fees 17%
Room and Board 17%
Total expenditure on the mainstream programs of Phil- Health in 2008 was around PHP 21.3 billion (US$ 450 million). The reserve that PhilHealth accumulated, amounted to about PHP 50 billion (US$ 1.1 billion)/PHP 90 billion (US$ 2 billion) total assets, which is more than two/four annual incomes. If we look at the total health expenditure in the Philippines, we see that Phil- Health plays a relative subordinate role (see Table 7) with out of pocket payments (OOP) representing around 48 percent of the total expenditure.
This shows that there is still room for expanding Phil- Health fi nancing. The average support value of Phil- Health benefi ts (meaning the average percentage of the amounts of medical bills reimbursed) is higher in some provinces; it is lower in secondary level facilities and in Metro Manila.
The reason for this is that the PhilHealth benefi ts are
capped and there are no effi cient cost controls in place.
ANAL
This means that maximum amounts are paid depending on the level of the facility (primary up to tertiary) and the diagnosis. These maximum amounts rarely cover the actual medical bill.
2.7 Poverty and Inequality
Under the Social Reform and Poverty Alleviation Act, the poor are defined as those families and individuals whose income falls below the poverty threshold and who cannot afford to provide for their minimum basic needs in a sustained manner.
Poverty thresholds (or poverty lines) are determined an- nually for urban and rural areas to provide both for food requirements and other basic needs. Nationally, the 2009 poverty threshold was set at PHP 16,841 (which is still valid), of which 67 percent was intended for sus- taining food needs and the balance of 33 percent was for other basic needs. In urban areas, the poverty threshold was a bit higher than in rural areas. The impact of infla- tion on incomes is important. People who had managed to make ends meet in one year had to earn 5-6 percent
more income the following year to remain above the poverty line.
Despite the low rates of GDP per capita increase over the last 20 years, and perhaps reflecting the impact of remittances on household incomes, poverty rates in the Philippines substantially reduced between 1985 and 1997 in both urban and rural areas. Poverty has contin- ued to remain higher in rural areas; and the gap appears to be widening. In all years, poverty in the National Capital Region (Metro Manila) has been substantially less than in other urban areas of the country. The pov- erty trend since 1997 is harder to estimate owing to changes in the methodology consequent revision of the 2000 estimates.
77 See www.adb.org/Documents/Books/Poverty-in-the-Philippines/executive-summary.pdf, and
http://www.worldbank.org.ph/WBSITE/EXTERNAL/COUNTRIES/EASTASIAPACIFICEXT/PHILIPPINESEXTN/0,,menuPK:332992~pa gePK:141132~piPK:141107~theSitePK:332982,00.html.
Source: NSCP Official Poverty Statistics, 2009 Table 8: Poverty Incidence Philippines Table 7: Health Expenditure Structure in the
Philippines
Source: WHO 2008
2005
National Government 16%
Local Governments 13%
Philhealth 11%
OOP 48%
Private Insurance 2%
HMOs 4%
Employers 3%
Privat Schools 1%
Others 1%
Total 100%
Poverty incidence among families
Region 2003 2006 2009
Philippines 20.0 21.1 20.9
Caraga 37.6 36.9 39.8
ARMM 25.0 36.5 38.1
Region IX 40.5 34.2 36.6
Region V 38.0 36.1 36.0
Region VIII 30.2 31.1 33.2
Region X 32.4 32.7 32.8
Region VII 32.1 33.5 30.2
Region XII 27.2 27.1 28.1
Region IV-B 29.8 34.3 27.6
Region XI 25.4 26.2 25.6
Region VI 23.5 22.1 23.8
Region I 17.8 20.4 17.8
CAR 16.1 18.6 17.1
Region II 15.2 15.5 14.5
Region III 9.4 12.0 12.0
Region IV-A 9.2 9.4 10.3
NCR 2.1 3.4 2.6
ANAL YSIS 32
The general situation appears to be that poverty rates are again decreasing following a significant rise between 1997 and 2000 following the Asian financial crisis. In 2009 there were 3.85 million poor families in the Phil- ippines, which corresponds to about 20 percent of the population (see Table 8).
Given the country’s high population growth rates and
presence of a big proportion of poor people, the country
has to make significant progress in poverty alleviation
and undertake programs that protect the poor and the
vulnerable.
ANAL 3 Description of Social Protection in the Philippines
Unlike in most Asian countries, the term ‘Social Protec- tion’ is known and used in the Philippines. In 2005, the National Anti-Poverty Commission (NAPC), a coor- dinating body for poverty reduction oriented programs, convened a consultation meeting with agencies. During that meeting a definition of social protection was pro- posed based around three elements and/or approaches:
(i) management of risks and vulnerability; (ii) protection of the welfare of the poor and vulnerable, and (iii) im- provement of their capacities to confront and deal with risks. Based on these, the following operational defini- tion of social protection was proposed:
“Social protection constitutes policies, pro- grams, and interventions that seek to reduce the susceptibility of the poor and vulnerable to risks: through the promotion and protection of livelihood and employment, improvement in their capacity to manage risks and their protec- tion from disruption or loss of income, loss of welfare and diminished wellbeing.”
The management of risks implies the capacity to fore- see, measure, deal/manage risks before and especially when it happens for both provider and recipient. Ca- pacity constitutes organizational, financial and technical capabilities to carry out the management of risks with respect to providers or implementers such as govern- ment, local governments, firms, communities. Capacity on the part of the poor implies access to social protec- tion instruments and information to better prepare them for any eventuality.
While the proposed definition of social protection in the Philippines is evolving, it is, in most respects, very simi- lar to the definition adopted by ADB and World Bank, involving as it does the following categories of programs:
labor market interventions, social insurance, social wel- fare and social safety nets. It should however be noted that micro-credit/finance schemes are also included in the ADB definition given their importance to the liveli-
hoods of poor people in many Asian countries and in- volve a mobilization (if not direct transfer) of funds to individual households.
The majority of the information was gathered from the ADB Social Protection Index Study and related studies as well as from ILO Studies (Baulch et al. 2008).
3.1 Labor Market Programs
The Department of Labor and Employment (DOLE), in coordination with other agencies and private organiza- tions, undertakes programs that could provide bridging or transition opportunities, especially to the vulnerable sectors to help them obtain productive and formal em- ployment or livelihood.
The implementation and enhancement of labor market programs consist of capacity building, livelihood genera- tion, employment assistance, scholarship grants for indi- gent families to pursue technical or vocational courses, and others. The most important of these programs are summarized in the following paragraphs.
3.1.1 Unemployment Benefits
The current situation in the Philippines is that workers, who lose their jobs, mostly (except GSIS-means public sector social insurance members) have no unemploy- ment insurance. However, there is a variety of laws and benefits that give workers some kind of protection:
Public employees can avail of a regular unemploy-
ment benefit from GSIS (50 percent of the average monthly compensation, maximum 6 months, see also GSIS Act in the attachment). This, however, is little known by employees and consequently hardly prac- ticed. The condition is, however, that he or she at the time of separation is a permanent employee. To date, many public employees are on fixed term contracts, so they are not protected by this provision.
Employers are obliged to pay for each year of con-
tract one month of severance pay. This, however, is
mostly practiced in the formal sector. Especially in the
ANAL YSIS 32
informal sector and in small enterprises (less than 10 employees), most employers tend to neglect this obliga- tion.
Formal sector employees can avail of a loan (80
percent of the savings) from PAG-IBIG Fund to bridge the period of unemployment. This, however, is only a substantial amount if workers have fulfilled a number of years of contract. In terms of optimal social policy outcomes, this is also limited.
Formal sector employees can avail of a loan from
SSS (maximum PHP 24,000) based on their pensions savings.
All workers can avail of 3 months contribution-free
health insurance (PhilHealth) coverage as long as they have paid their premiums.
Unemployed workers can obtain assistance from
PESO offices and from TESDA (job facilitation and train- ing).
For the rest, most of the unemployed depend on family support if they have no savings or their own means.
To lose a job in most cases also means a loss of regular income for the family.
3.1.2 The Public Employment Service Office
The Public Employment Service Office or PESO is a free of charge employment service facility initiated by the Department of Labor and Employment pursuant to Republic Act No. 8759 otherwise known as the PESO Act of 1999. The PESO facility has been established in many capital towns of provinces, key cities, and other strategic areas to expand the existing employment facili- tation service machinery of the government particularly at the local levels. The PESO is maintained largely by local government units (LGUs) and a number of non- governmental organizations (NGOs) or community- based organizations (CBOs) and state universities and colleges (SUCs). The regional offices of the DOLE pro- vide coordination and technical supervision among the PESO offices.
The PESO aims to provide timely and efficient delivery of employment service and information of other DOLE pro- grams. It provides jobseekers/clients with adequate infor- mation on employment and labor market situation in the area; and networks with other PESOs within the region on employment for job information exchange purposes.
Employers are encouraged to submit to the PESO on a regular basis a list of job vacancies in their respective establishments, administer testing and evaluation in- struments for effective job selection, training and coun- seling; conduct employability enhancement trainings/
seminar, provide occupational counseling and other re- lated activities.
Among the activities and events that PESO supports are jobs fairs, livelihood and self-employment bazaars, extend Special Credit Assistance for Placed Overseas Workers , Special Program for Employment of Students and Out-of-School Youth, Work Appreciation Program (WAP), Workers Hiring for Infrastructure Projects (WHIP) and other programs/activities developed by DOLE to enhance provision of employment assistance to PESO clients, particularly for special groups of dis- advantaged workers such as persons with disabilities (PWDs) and displaced workers.
In 2010, some 1 million jobseekers were employed with the help of PESO. For the same year DOLE Central Office allocated PhP 10 million to support the various PESO activities. LGUs and other PESO supporters aug- mented the funds coming from the central office for the implementation of the various activities of PESO but the amount of this money at the local units could not be ascertained
3.1.3 Promotion of Rural Employment (PRESEED)
PRESEED, a centerpiece project of the DOLE, was de-
veloped in response to the limited wage employment
opportunities in the rural areas. The program assists in
job creation or expansion of livelihood projects from cli-
ent development and training, to technical assistance
and consultancy services. DOLE regional offices form
ANAL
partnerships with accredited partners like NGOs, pri- vate sector, private voluntary organizations, labor un- ions, cooperatives, local government units and others to implement the PRESEED project.
Individuals and organizations are eligible to participate in the program. The unemployed or underemployed, with family incomes below the poverty threshold and have passed entrepreneurial tests administered by the accredited partners and validated by the DOLE regional offices are eligible for participation.
Organizations that are interested to participate must have a legal constitution, demonstrate the attributes of a functional organization, e.g. conducting regular meetings, have at least a minimum amount of organi- zational funds to sustain the current operational level of its existing activities and projects (funds from dues, membership fees, and other income generating projects) and have at least two years of continuing experience in successful projects (SEPs), mobilization or any project – simple or complex – planning and implementation and evaluation.
For 2010, the number of jobs created by PRESEED amounted to 10,000.
3.1.4 Kalinga sa Manggagawa (Workers Microfinance Program)
This program aims to help workers fund livelihood projects for workers whether in private, public or infor- mal sectors and their organizations. DOLE, SSS, GSIS, DBM and ECC have contributed PHP 25 million each to this facility for the workers.
Among the beneficiaries of the program are the dis- placed workers in the formal and informal sectors or those who are not employed or fully employed, work- ers with existing micro enterprise venture needing ex- pansion, workers with no existing micro enterprise and have participated in a livelihood training. To participate in the program one must:
Have at least one year residency in the area;
The micro enterprise should have weekly or daily
income;
Must be 18-65 years old;
One member per household can apply;
Not presently employed or has no fulltime employ-
ment;
No existing loan with MFI/PCFC;
Household monthly income of not more than PHP
10,000 or below the poverty threshold.
For 2010, there were some 2000 beneficiaries of the program.
3.1.5 Kasanayan at Hanapbuhay (KasH)
KasH is a training and capacity building program for the vulnerable sector to help them graduate into more productive, or more formal employment or livelihood.
It is an apprenticeship and employment program that provides a bridging mechanism for new entrants to the labor force by giving them the opportunity to acquire basic skills and work experiences needed by employers in hiring new employees.
The program matches jobseekers with available jobs and ensure that there are qualified skilled workers based on industry needs. Any unemployed person 15 years old and above can apply for apprenticeship with any participating enterprise that should be duly registered with appropri- ate government authorities and has ten or more regular workers. The enterprise shall accept apprentices of not more than 20 percent of its total regular workforce.
Apprenticeship programs run to six months. Many em-
ployers have been dissatisfied with the provision of the
apprenticeship law (Executive Order 11) and proposed
to amend the law to waive the apprentice allowance
level of 75 percent of the minimum wage to what em-
ployers can realistically afford and to allow employers
with less than ten workers to employ apprentices.
ANAL YSIS 32
As at end November 2010 there were some 100,000 apprentices trained. The cost of partnering between the government and the various enterprises in 2010 could not be determined but was considered minimal.
3.1.6 Tulong Alalay sa Taong May Kapansanan
This program has been developed to assist in the integra- tion of persons with disability in the mainstream of soci- ety through training and employment. Selected govern- ment and private training institutions would undertake training programs suited to their interests, potentials and circumstances to enhance the employability of persons with disabilities (PWDs). The PWDs have the option to choose from any of the following training areas: indus- trial skills, livelihood skills and entrepreneurship skills.
PWDs whose qualifications are suited for wage employ- ment are referred to private companies or government agencies where job vacancies are made available for them. For this purpose, a skills pool of PWDs as well as list of prospective employers shall be maintained for quick reference. PWDs who are inclined towards self- employment shall be encouraged to set up their own self-employment projects either individually or in group.
Technical as well as financial assistance shall be extend- ed to them in coordination with government livelihood agencies and financing institutions and non-government organizations. No figures on the cost of assistance and other expenditures were provided.
3.1.7 Training Programs
The Technical Education Skills Development Authority (TESDA) is the national leader in technical vocational education and training (TVET). TESDA provides direc- tion to the TVET in the country by setting standards and developing systems adopted in the sector. It also exercises technical supervision over the various public and private TVET providers, builds capacity of providers and provides scholarships and other student assistance programs to deserving beneficiaries.
One of the programs undertaken by TESDA is the Iskolar ng Mahirap na Pamilya (IMP) or the Scholar of
Poor Family. The program provides financial assistance to one qualified child per indigent family to equip him with skills for employment. A Certificate of Educational Assistance (CEA) is issued to the head of the family giv- ing him the right to decide whom to send among the children to post-secondary education. Said Certificate is accepted in any of TESDA administered institution for a two-year vocational technical course. One of the unique features of the CEA is that it has no expiry date and works like an educational voucher plan that can be used at the time it is needed for TVET. For SY 2005-2006, a total of 44 qualified scholars have been provided with financial assistance out of the TESDA budget.
The I-Care Program, also known as Invigorating Constit- uent Assistance in Reinforcing Employment, is designed to create jobs. Commencing early part of 2005, I-CARE works as financial sharing scheme between TESDA and the external partners to increase education and train- ing funds for the latter’s chosen beneficiaries. Partners in this program included legislators, LGUs, NGOs, in- dustry associations and other TVET stakeholders. These stakeholders forged strategic partnerships with TESDA to address the specific skills requirements of unique job markets and locations.
Based on regional reports as of December 2005, the I- CARE Program generated fund commitments/pledges of PHP 232 million from legislators, LGUs, NGAs, NGOs and private sector partners. Breakdown of the amount is as follows: legislators committed 89 percent or PHP 207 million out of their Program Development Assist- ance Fund while LGUs, partners, and other organiza- tions committed 11 percent or PHP 25 million. Funds will be allocated to:
community based skills and livelihood training:
30 percent,
scholarship assistance: 34 percent,
infrastructure development: 30 percent,
competency assessment and certification: 1 per-
cent.
ANAL
Absolute figures on the amount of realized pledges could not be obtained. An estimated amount of pledges real- ized for training, scholarship assistance and competency certification was 50 percent of the total. Allocation for infrastructure development could constitute about 30 percent and the remaining balance of 20 percent was unrealized or deferred to the following year.
3.2 Social Insurance Programs
3.2.1 Social Security Security System (SSS) and Government Service Insurance System (GSIS)
The social security mechanism in the Philippines has the following characteristics:
Participation is compulsory for all formal sector
workers and public employees.
Benefit schemes are financed from contributory pay-
roll taxes levied on both workers and public employees.
Contributions are accumulated in special funds out of which benefits are paid. Any excess funds are invested to earn further income.
In kind (health) benefits are capped.
Cash benefits (and contributions as well) are directly
related to the level of earnings and/or length of employ- ment.
A person’s rights to benefits is secured by his or
her record of contribution without any need of test of means, except for health care, where there is a means tested sponsored program.
Retirement benefits are designed to meet ”minimum
income needs” and are paid (e.g. monthly) until death.
In the Philippines, three government agencies deliver social insurance. The Social Security System (SSS) pro- vides social insurance benefits for those employed, self- employed and those who had retired from the private sector, private corporations or companies. Government Service Insurance System (GSIS), on the other hand,
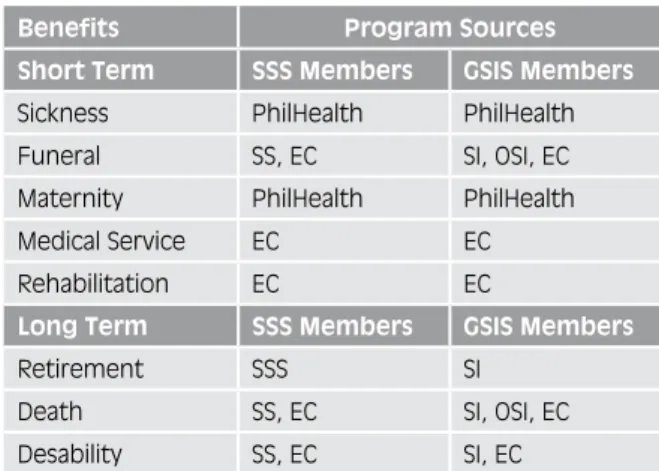
provides the same benefits for government employed and previous qualified members who had retired from public service. PhilHealth provides health insurance for all. Furthermore, there is an Employee Compensation Fund (EC) that provides medical service and rehabilita- tion in case of work accidents. Table 8 shows the distri- bution of sub-components of the social security system and institutional responsibilities.
Membership in the GSIS and the SSS requires subscrip- tion or payment of monthly contributions based on in- come. All GSIS and SSS-registered employers and their employees are compulsorily covered under the Employ- ees’ Compensation program. An employer on behalf of his employees pays monthly contributions on Employ- ees’ Compensation for as long as the employee works for him. The obligation of the employer ceases when an employee is separated from employment or, if the employee dies during employment. When a covered employee becomes disabled during employment, his employer’s obligation to pay the monthly contribution arising from the employment will be suspended during such months that he is not receiving salary or wages.
SSS has expanded its coverage to include self-employed members and workers in the informal sector. Self-em- ployed includes the regular self-employed or those who
SS = social security; EC = employees’ compensation;
SI = social insurance; OSI = other social insurance.
Table 9: Benefits from Statutory Social Insurance Coverage
Benefits Program Sources
Short Term SSS Members GSIS Members
Sickness PhilHealth PhilHealth
Funeral SS, EC SI, OSI, EC
Maternity PhilHealth PhilHealth
Medical Service EC EC
Rehabilitation EC EC
Long Term SSS Members GSIS Members
Retirement SSS SI
Death SS, EC SI, OSI, EC
Desability SS, EC SI, EC
ANAL YSIS 32
operate businesses, farmers and fishermen, overseas contract workers and non-working spouses. The infor- mal sector workers include unincorporated enterprises, that consist of both informal own account enterprises and enterprises of informal employers, labor relations are contractual and without employers. Groups clas- sified as informal workers are those with irregular in- come, the underemployed, small vendors such as side- walk vendors; cigarette, balut/egg and peanut vendors;
watch-your-car boys, hospitality girls, tricycle operators and drivers, pedicab and jeepney drivers, and many more. It is estimated that depending on which defini- tion is chosen about 55 percent of the workers are in the informal sector.
The Department of Labor and Employment together with the Philippine Savings Bank, Development Bank of the Philippines and accredited banks implement the program for informal workers. The program is known as the DOLE Social Protection Program for the work-
ers in the informal sector. The informal sector refers to the households that are unincorporated enterprises consisting of both informal own account enterprises and enterprises of informal employers. The informal sector operates with a low level of organization. There is no division between labor and capital as factors of production and labor relations are based on casual em- ployment, kinship or personal and social relations rather than formal or contractual arrangements. To enroll in the program informal workers should be a member of an association or organization; should register with SSS;
and should pay a premium monthly through any of the SSS accredited banks.
As of 2010, there were a total of 50,000 informal work- ers enrolled in Social Security System, most of them in PhilHealth, 600 in PAG-IBIG and some in Philippine National Red Cross. Private partners like the San Miguel Corporation Polo Brewery and Asahi Corporation have been tapped as cooperators.
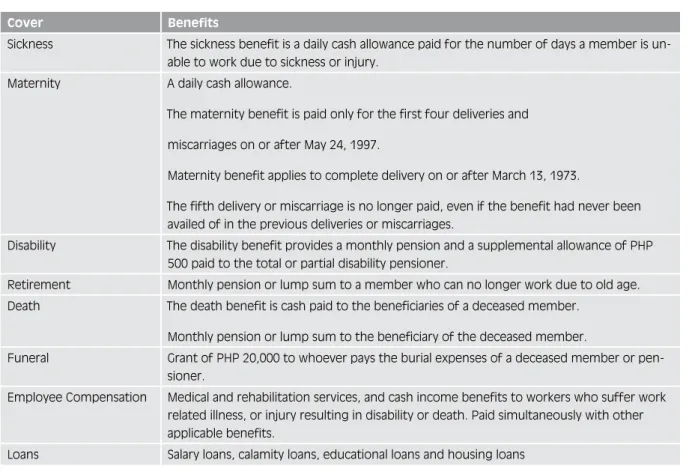
Table 10: Social Security System Benefits
Cover Benefits
Sickness The sickness benefit is a daily cash allowance paid for the number of days a member is un- able to work due to sickness or injury.
Maternity A daily cash allowance.
The maternity benefit is paid only for the first four deliveries and miscarriages on or after May 24, 1997.
Maternity benefit applies to complete delivery on or after March 13, 1973.
The fifth delivery or miscarriage is no longer paid, even if the benefit had never been availed of in the previous deliveries or miscarriages.
Disability The disability benefit provides a monthly pension and a supplemental allowance of PHP 500 paid to the total or partial disability pensioner.
Retirement Monthly pension or lump sum to a member who can no longer work due to old age.
Death The death benefit is cash paid to the beneficiaries of a deceased member.
Monthly pension or lump sum to the beneficiary of the deceased member.
Funeral Grant of PHP 20,000 to whoever pays the burial expenses of a deceased member or pen- sioner.
Employee Compensation Medical and rehabilitation services, and cash income benefits to workers who suffer work related illness, or injury resulting in disability or death. Paid simultaneously with other applicable benefits.
Loans Salary loans, calamity loans, educational loans and housing loans
ANAL
SSS directly administers two programs:
Social security (SS) which includes maternity, disa-
bility, retirement, death and funeral services. It provides replacement income in times of death, sickness, disabil- ity, maternity and old age.
Employees’ compensation (EC) which includes
medical services, rehabilitation services and income cash benefit beginning on the first day of disability or sickness, permanent total disability, medical services and appliances.
Table 10 summarizes the benefits granted by these pro- grams while Table 10 gives the total number of mem- bers and annual expenditures for 2003 to 2005.
Table 11 shows the membership and expenditures of SSS. What is interesting is that in spite of a substantially grown expenditure on benefits and an increase of the labor force the number of members has stagnated.
The GSIS is composed of 1.6 million active members who are employed with the 10,000 government offices nationwide. There is a total of 250,000 pensioners, those who had reached the age of 60 and those who had retired due to disability.
3.2.2 Loans and Pension Program
In addition to GSIS regular social insurance programs, it administers a pension program which is the newest loan
Source: SSS
* SSS EstimatesTable 11: SSS Membership and Expenditures, 2003-2005
Membership 2005 2011
Employees 20,835,897 20,009,890
Self-Employed 5,391,739 5,780,998
Expenditure (million PHP) 2005 2011
On Benefits 46,269.8 82,000*
Operating Expenses 5,638.4 7,300*
window for the elderly and the disabled pensioners.
Qualified retirees under Republic Act 660, Presidential Decree 1146 or Republic Act 8291 are granted the op- portunity to borrow one to six times the amount of their monthly pension but not exceeding PHP 100,000.
The loan window is open to old age and disability pen- sioners who do not have any outstanding stock purchase loans, at an interest rate of 8 percent per annum. The monthly amortization is paid in 12 or 24 months through auto-matic deduction from the regular pensions. Loans may be renewed after full payment. The program was created in 2001 as a loan facility that will answer the needs of pensioners who become unwilling victims of usurious lending. For this type of loan, the GSIS lends an amount of over PHP 1 billion, a doubling of pension loans released in two years owing to the improved loan processing time.
3.2.3 Health insurance
The Philippine Health Insurance Corporation or Phil- Health, a government agency, implements the National Health Insurance Act of 1995 (Republic Act 7875) through the National Health Insurance Program (NHIP).
NHIP replaced and improved the old Medicare Program introduced 23 years earlier. Its mandate is to provide all citizens with the mechanism to gain financial access to health services, in combination with other government health programs.
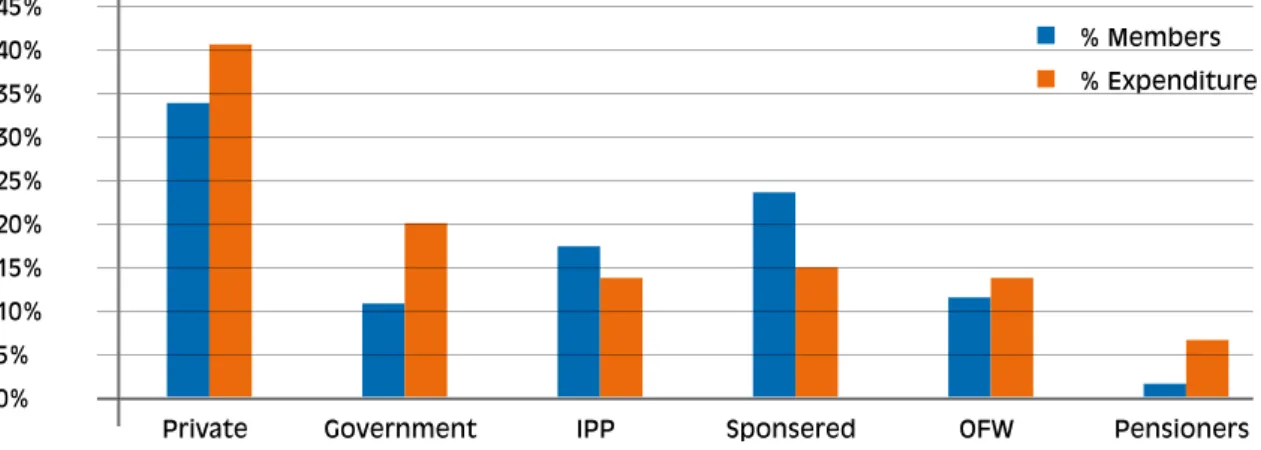
Under the National Insurance Act all citizens of the country are required to enroll in the NHIP to become PhilHealth members to avoid adverse selection and social inequity. Members are assigned with a perma- nent and unique PIN or PhilHealth Identification Number. There are several categories of members (see also Figure 4):
Employees (private sector and Government), who
are compulsory members, contributions being paid half by the employer (PHP 100-750 per month);
Individually paying members (IPP), mainly self em-
ployed and informal sector, who are voluntary members
ANAL YSIS 32
and have to pay 100 percent of the contribution (PHP 1,200 per year);
Sponsored members, the poor, for whom the contri-
bution 100 percent is paid by the state;
Overseas Filipino Workers (OFW), (PHP 900 per
year);
Retirees over 65, who are enrolled free of charge if
they have at least 120 months prior enrollment;
Family members, who are insured with the mem-
bers free of charge.
In the context of this study it is important that people the moment they get unemployed lose their PhilHealth entitlement unless they do become IPP and pay the contribution on their own. There is no cushioning like special transition regulations for people getting unem-
ployed. (Usually the employees keep their membership for three months as the contributions paid entitle for three months).
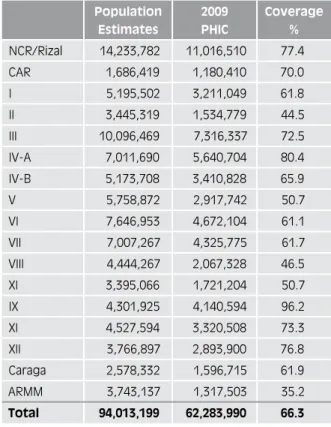
To date total coverage is estimated to be around 66 percent of the population, where the coverage in the formal sector is close to 100 percent
8and in the infor- mal sector around 50 percent (see Table 12). Coverage varies very much according to regions and is highest in Manila and lowest in ARMM (Muslim Mindanao, see Table 13). Comparing the different population groups, coverage is the lowest in the group of the informal sec- tor non-poor (individually paying members). The formal sector includes about 45 percent of the population in the Philippines and is covered by PhilHealth already.
The informal sector can be divided into:
Those being part of the informal sector, but not poor
(app. 30 percent of the population and 12 percent Phil- Figure 4: PhilHealth Membership Structure
Source: PhilHeath
OFW 12%
Individually Paying (IPP) 18%
Private 34%
Government 11%
Pensioner 1%
Poor (sponsored) 24%
8 There are no exact estimates as to in how far compulsory membership is enforced. There are estimates that there is an evasion of about 10 percent. This is why coverage rate is estimated with 90 percent.