June 2011
Document of the World Bank Report No. 53282-IN
India
Vulnerability of Kolkata Metropolitan Area to Increased Precipitation in a Changing Climate
Environment, Climate change and Water Resources Department South Asia Region
Document of the World Bank
Public Disclosure AuthorizedPublic Disclosure AuthorizedPublic Disclosure AuthorizedPublic Disclosure Authorized
i
Currency Equivalents
(Exchange rate effective April 1, 2010) Currency Unit = Indian Rupee (Rs)
US$1.00 = 44.8 Rs
Fiscal Year July 1 – June 30
Vice-President: Isabel M. Guerrero
Country Director: N. Roberto Zagha
Sector Director: John Henry Stein
Task Team Leader: Maria Sarraf
ii
A
CKNOWLEDGEMENTSThis report was prepared by a team consisting of Ms. Maria Sarraf (Task Team Leader), Dr. Susmita Dasgupta (Co-Task Team Leader), Dr. Subhendu Roy (Sr. Environment Consultant) and Ms. Arati Belle (Sr. Environment Economist, Consultant). The report benefited from substantial input, including the hydrological and hydraulic modeling, provided by INRM under the leadership of Dr. Ashvani Gosain and Dr. Sandhya Rao.
The team would like to thank Mr. Debal Ray (Department of Environment, Government of West Bengal), Mr. Ardhendu Sen (Chief Secretary, Government of West Bengal), Dr. A. Senthilvel (Additional Director, Ministry of Environment and Forests), Mr. R. R. Rashmi (Joint Secretary, Ministry of Environment and Forests), Mr. Sushit K Biswas (Kolkata Environmental Improvement Project), Mr.
Nilangshu Basu (Kolkata Municipal Corporation) and Mr. Samar Ghosh (Secretary Health and Family Welfare Department, Government of West Bengal) for providing substantial guidance.
The report benefited from input from Mmes/Messrs.: Harinath Appalarajugari (Environment Specialist), Dan Biller (Lead Economist), Adriana Damianova (Lead Environment Specialist and TTL at concept stage), Tapas Ghatak (Consultant), Nobuo Mimura (Ibaraki University), Megumi Muto (Research Fellow at JICA Research Institute and Peer Reviewer), Anna C. O’Donnell (Social Development Specialist), John Pethick (Coastal Geomorphologist, Consultant), Bradfort R. Philips (Climate Change, Consultant), Poonam Pillai (Sr. Environment Specialist), Giovanna Presnnushi (Economic Advisor), Neeraj Prasad (Lead Carbon Finance Specialist and Peer Reviewer), Jack Ruitenbeek (Climate Change, Consultant), Sonia Sandhu (Sr. Environment Specialist), Masahiro Sugiyama (University of Tokyo), Akimasa Sumi (University of Tokyo) and Walter Vergara (Lead Engineer and Peer Reviewer). The team is grateful for the administrative support provided by Mmes. Poonam Rohatgi (Program Assistant) and Lakshmi Narayanan (Team Assistant).
Financial support for the preparation of this study was provided by Trust Fund for Environmentally Socially Sustainable Development supported by Finland and Norway.
This volume is a product of the staff of the International Bank for Reconstruction and Development/ The World Bank. The findings, interpretations, and conclusions expressed in this paper do not necessarily reflect the views of the Executive Directors of The World Bank or the governments they represent. The World Bank does not guarantee the accuracy of the data included in this work. The boundaries, colors, denominations, and other information shown on any map in this work do not imply any judgment on the part of The World Bank concerning the legal status of any territory or the endorsement or acceptance of such boundaries.
The report has been discussed with the Government of India but does not bear their approval for all its contents, especially where the Bank has stated its judgment, opinion and policy recommendations.
iii
T
ABLE OFC
ONTENTSEXECUTIVE SUMMARY ... VII
CHAPTER 1. INTRODUCTION ... -1-
1.1 Background ... - 1 -
1.2 Objective ... - 2 -
1.3 Scope ... - 3 -
1.4 Approach and Methodology ... - 4 -
1.5 Preparation process ... - 5 -
1.6 Organization of the Report ... - 6 -
CHAPTER 2. KOLKATA –A-PROFILE ... -7-
2.1 Geographic and Physiographic Characteristics of the Study Area ... - 7 -
2.2 Climate ... - 8 -
2.3 Demography ... - 9 -
2.4 Economy ... - 11 -
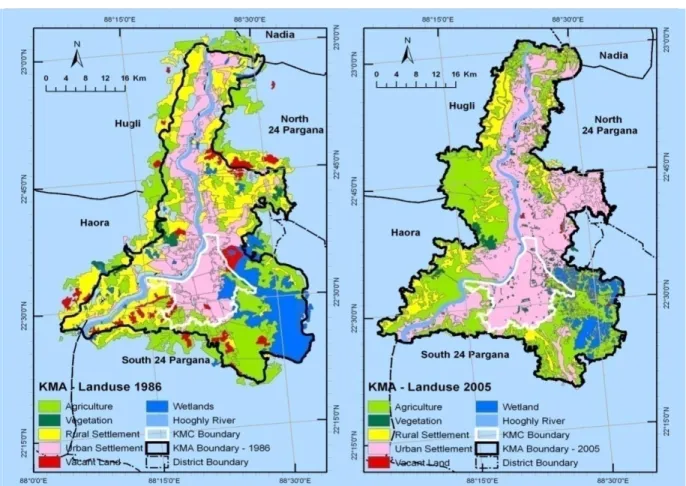
2.5 Land Use ... - 13 -
2.6 Infrastructure ... - 14 -
2.6.1 Transport ...- 14 -
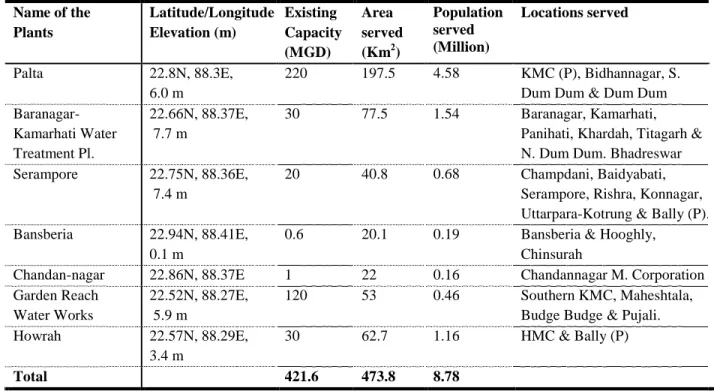
2.6.2 Water Supply ...- 15 -
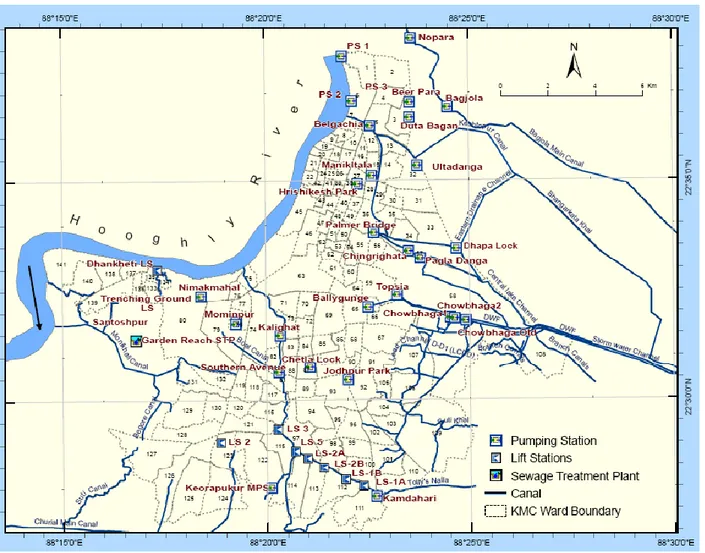
2.6.3 Drainage and sewerage ...- 16 -
2.7 Urban Planning and Development in KMA ... - 18 -
2.8 Natural hazards ... - 19 -
CHAPTER 3. MODELING CLIMATE CHANGE ... -22-
3.1 Background ... - 22 -
3.2 The Models Used ... - 23 -
3.3 Modeling Scenarios... - 27 -
3.3.1 Base Case Scenario ...- 27 -
3.3.2 Climate Change Scenarios ...- 27 -
3.4 Model Calibration and Validation ... - 28 -
3.5 Model Simulation Results ... - 29 -
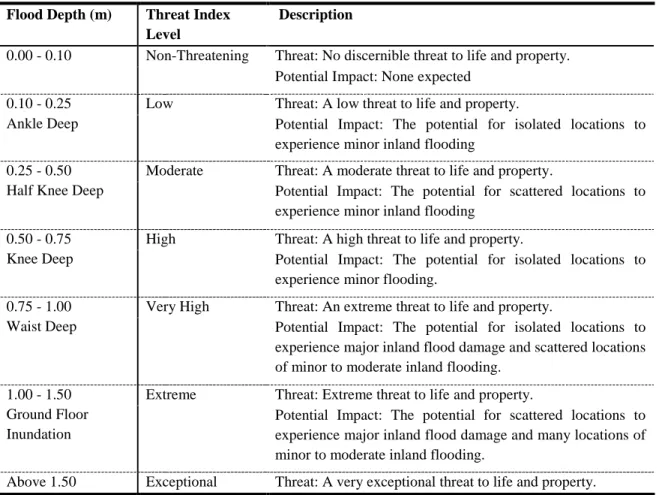
3.5.1 Flood depth categories ...- 29 -
3.5.2 Results for KMA ...- 29 -
3.5.3 Results for KMC ...- 32 -
3.3.3 Land Subsidence ...- 34 -
CHAPTER 4. VULNERABILITY IMPACT ASSESSMENT ... -35-
4.1 Methodology ... - 35 -
4.2 Ward Level Analysis ... - 36 -
4.2.1 Characteristics of the 9 most vulnerable wards in KMC ...- 37 -
4.3 Sub Ward Level Analysis ... - 39 -
CHAPTER 5. DAMAGE ASSESSMENT ... -41-
5.1 Methodology and Assumptions ... - 41 -
5.2 Damages by Key Sectors ... - 43 -
5.2.1 Residential buildings ...- 43 -
5.2.2 Residential property ...- 45 -
5.2.3 Residential income loss ...- 46 -
5.2.4 Commerce and Industry ...- 47 -
5.2.5 Health Sector ...- 48 -
5.2.6 Road damage ...- 49 -
5.2.7 Transport ...- 50 -
5.2.8 Electricity ...- 51 -
5.2.9 Telecommunication, Water Supply and Other Public Sector Damage ...- 51 -
iv
5.3 Damage Estimates ... - 52 -
5.3.1 Residential buildings and property damage and income loss ...- 52 -
5.3.2 Commercial and industry damage...- 52 -
5.3.3 Health loss ...- 53 -
5.3.4 Roads ...- 53 -
5.3.5 Transport ...- 53 -
5.3.6 Electricity ...- 53 -
5.4 Overall Damages ... - 54 -
CHAPTER 6. ADAPTATION STRATEGY ... -56-
6.1 Introduction ... - 56 -
6.2 Causes for Urban Flood ... - 56 -
6.3 Urban Flood Mitigation Options ... - 58 -
6.4 Urban Flood Management Strategy ... - 59 -
6.5 Adaptation Deficit in KMC ... - 61 -
6.5.1 Deficit in sewerage network and treatment infrastructure ...- 61 -
6.5.2 Deficit in drainage infrastructure ...- 63 -
6.5.3 Deficit in financial resources and institutional capacity ...- 63 -
6.5.4 The poor are the most affected ...- 63 -
6.6 Adaptation Strategy in KMC ... - 63 -
6.6.1 Investing in hard infrastructure ...- 64 -
6.6.2 Investing in soft infrastructure ...- 66 -
6.7 Projects under Implementation in Kolkata ... - 68 -
6.8 Future Adaptation Needs for Kolkata with Climate Change ... - 70 -
REFERENCES ... -72-
ANNEX A KOLKATA APROFILE ... -74-
ANNEX B MODELING CLIMATE CHANGE ... -76-
ANNEX C VULNERABILITY IMPACT ASSESSMENT ... -79-
ANNEX D EFFECT OF CYCLONE IN A CHANGING CLIMATE ... -81-
v
FIGURES
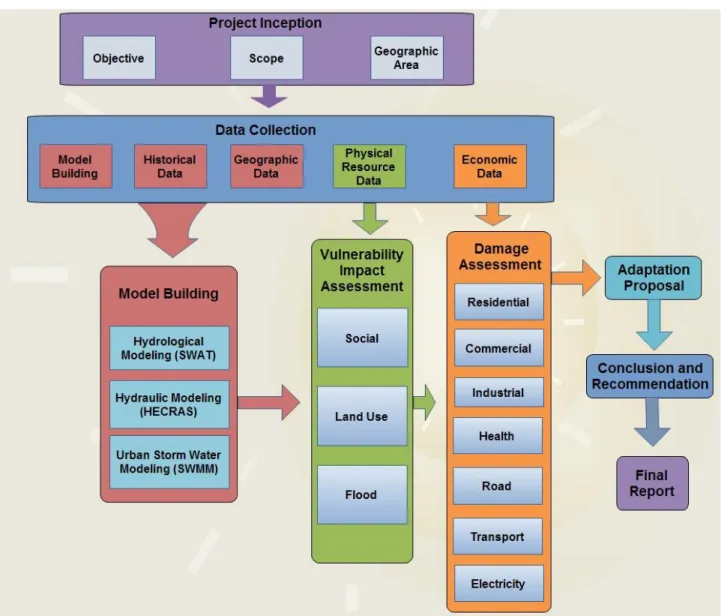
Figure 1.1 Workflow methodology for climate change impact assessment in Kolkata ... - 4 -
Figure 2.1 The study area ... - 7 -
Figure 2.2 Mean monthly temperature and rainfall in KMA ... - 9 -
Figure 2.3 Population growth in KMA (1950-2025) in millions ... - 10 -
Figure 2.4 Spatial distribution of slum population in KMC ... - 10 -
Figure 2.5 Industries in KMA and KMC ... - 12 -
Figure 2.6 Changes in land use pattern between 1986 and 2005 in KMA ... - 13 -
Figure 2.7 Spatial distribution of water supply sources in KMA ... - 15 -
Figure 2.8 Pumping stations in KMC ... - 18 -
Figure 3.1 Spatial data for the Hooghly basin used for the SWAT modeling ... - 24 -
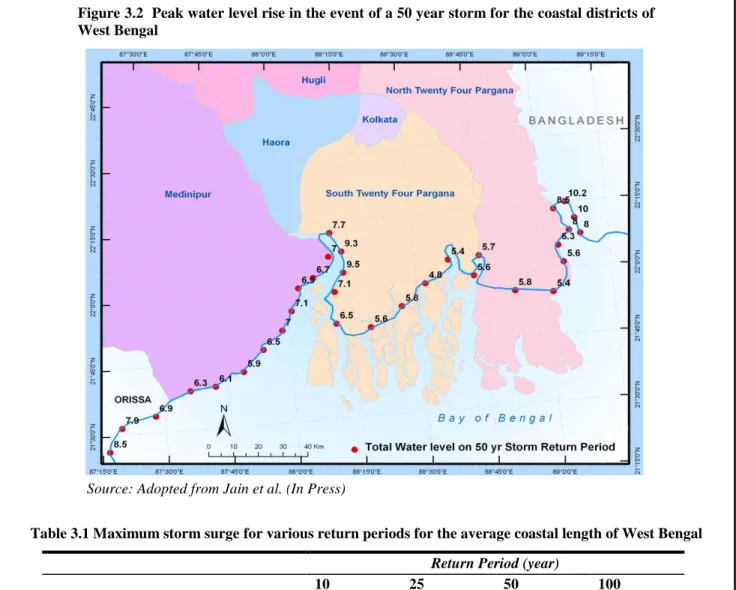
Figure 3.2 Peak water level rise in the event of a 50 year storm for the coastal districts of West Bengal ... - 25 -
Figure 3.3 Drainage basins of KMA ... - 26 -
Figure 3.4 Rainfall Hyetograph based on Alipore rainfall data ... - 27 -
Figure 3.5 Depth and spread of inundation in KMA for the baseline and climate change scenario ... - 31 -
Figure 3.6 Percentage of area and population affected in KMA for various scenarios... - 32 -
Figure 3.7 Depth and spread of inundation in KMC for current climate 100 year flood and A1F1 climate 100 year flood ... - 33 -
Figure 3.8 Duration of inundation of various depths in all of KMC for current climate 100 year flood and A1F1 climate 100 year flood ... - 34 -
Figure 6.1 Area and population affected by flooding with and without de-silting ... - 64 -
TABLES Table 1.1 Summary of IPCC emissions scenarios ... - 5 -
Table 2.1 Annual average growth rate of state domestic product for KMA & West Bengal ... - 11 -
Table 2.2 Surface water supply plants and locations served in KMA ... - 16 -
Table 2.3 Types of hazards, vulnerable areas and communities in KMC ... - 20 -
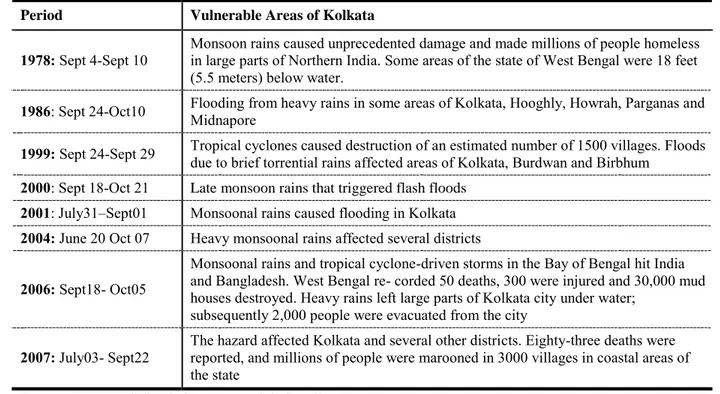
Table 2.4 Records of large floods in West Bengal ... - 21 -
Table 3.1 Maximum storm surge for various return periods for the average coastal length of West Bengal ... - 25 -
Table 3.2 Flood depth and threat level category ... - 29 -
Table 3.3 Percentage of area inundated in KMA various scenarios ... - 30 -
Table 3.4 Percentage of area affected in KMC under different flood depths for all scenarios ... - 32 -
Table 3.5 Percentage of flooded area (to the total of KMC) with flood depths of 0.25 m... - 33 -
Table 4.1 The most vulnerable wards in KMC ... - 37 -
Table 5.1 Severity of damage according to various water depths ... - 42 -
Table 5.2 Damages by sectors ... - 43 -
Table 5.3 Data for residential buildings ... - 45 -
Table 5.4 Household data in KMC ... - 45 -
Table 5.5 Incidence of water borne disease in KMC ... - 49 -
Table 5.6 Total losses to commerce and industry ... - 53 -
Table 5.7 Total losses in the health sector ... - 53 -
Table 5.8 Total losses in the transport sector ... - 53 -
Table 5.9 Total losses in major sectors in KMC (in 2050) ... - 54 -
CHARTS Chart 5.1 Total losses in major sectors in KMC (Rs million in 2050) ... - 54 -
Chart 5.2 Total Losses using PPP and Man Days ... - 55 -
vi
A
CRONYMSADB Asian Development Bank
AR4 IPCC Fourth Assessment Report
CC Climate Change
CMD Calcutta Metropolitan District
DWF Dry Weather Flow
EPA Environmental Protection Agency GIS Geographical Information System
HEC-RAS Hydrologic Engineering Centers River Analysis System INRM Integrated Natural Resource Management
IPCC Intergovernmental Panel on Climate Change JICA Japan International Cooperation Agency
JNNURM Jawaharlal Nehru National Urban Renewal Mission KEIP Kolkata Environmental Improvement Project
Km2 Square kilometers
KMA Kolkata Metropolitan Area
KMC Kolkata Municipal Corporation
KMDA Kolkata Metropolitan Development Authority KMWSA Kolkata Metropolitan Water and Sanitation Authority
masl Meters Above Sea Level
MGD Million Gallons per Day
MLD Million Liters per Day
MoEF Ministry of Environment and Forest
RP Return Period
SRES Special Report on Emissions Scenarios SWAT Soil and Water Assessment Tool
SWF Storm Weather Flow
SWMM Storm Water Management Model
WBPCB West Bengal Pollution Control Board
vii
E
XECUTIVES
UMMARYGlobal and Regional Context
Low lying coastal areas are highly vulnerable to flooding. A number of recent studies have shown that coastal areas are vulnerable to a range of risks related to climate change including coastal flooding. Among these coastal areas, the Inter Governmental Panel on Climate Change specifically identifies as hotspots the heavily urbanized megacities in the low-lying deltas of Asia (IPCC, 2007). Within Asian countries, India is particularly vulnerable with its 7,500 km long predominantly low-lying densely populated coastline. The first global assessment of the exposure of port cities lists Kolkata and Mumbai in India among the top ten cities that have high exposure to flooding under the current climate change forecasts (OECD, 2007). The study also shows that exposure will
increase in the future and that by 2070 Kolkata is expected to lead the top 10 list in terms of population exposure.
As a response to these potential effects, a regional study to assess the impacts of climate change on major coastal cities in Asia has been undertaken. This work involves the World Bank in collaboration with the Asian Development Bank (ADB) and the Japan Japan International Cooperation Agency (JICA). These three organizations have undertaken four country level studies that will be presented individually and through a joint synthesis report on the main findings.
The case studies include those for Manila led by the
JICA, Ho Chi Minh City led by the ADB and Bangkok and Kolkata led by the World Bank.
viii Study Objectives
This study aims to strengthen the understanding of the vulnerability of Kolkata from increased precipitation caused by climate change effects with a specific goal to:
Compile a data base with past weather related information and damage caused by extreme weather related episodes;
Determine scenarios most appropriate for assessing the impact of climate change;
Develop hydrological, hydraulic, and storm drainage models to identify vulnerable areas and determine physical damage estimates resulting from climate change effects;
Assess monetary, social, and environmental impacts resulting from such climate change events;
Formulate adaptation proposals to cope with damage arising from climate change effects and explore strategies to mitigate them; and
Strengthen local capabilities so that the planning process for Kolkata can account for climate related damage effects in future while analyzing all new projects
In this study, precipitation events in Kolkata based on available historical rainfall data for 25 years has been considered as a baseline (without climate change) scenario. For modeling climate change, predictions for temperature and precipitation changes in Kolkata in 2050 for A1F1 and B1 emission scenarios from an analysis of 12 GCMs used for the IPCC Fourth Assessment Report were provided by JICA. A sea level rise of 0.27 m by 2050 was also added to the storm surge for the A1F1 and B1 climate change scenarios based on current estimates. All these scenarios (without and with climate change effects) were then modeled to assess the impact in terms of the extent, magnitude, and duration of flooding.
Geographic and Socio-economic Contexts
The geographic area covered in the study is the Kolkata Metropolitan Area (KMA), a continuous urban area stretching in a linear pattern along the east and west bank of the river Hooghly surrounded by some rural areas lying as a ring around the conurbation and acting as a protective green belt. KMA has an area of 1,851 km2 (square kilometers) and consists of a complex set of administrative entities comprising: 3 Municipal Corporations (incl. Kolkata Municipal Corporation (KMC)), 38 other municipalities, 77 non-municipal urban towns, 16 out growths, and 445 rural areas. KMC, the heart around which KMA has grown, lies along the tidal reaches of the Hooghly and was once mostly a wetland area. The elevation of KMA is within a range of 5 to 11 meters above sea-level (masl). The elevation of KMC area ranges from 1.5 to 9 masl with an average of 6 masl.
KMA features among the 30 largest mega-cities of the world having population in excess of 10 million (United Nations, 2007). As per the 2001 Census, the population of KMA is estimated at 14.7 million, of which KMC accounts for 4.6 million people. The average population density in KMA is 7,950 persons per km2 while KMC, the more urbanized heart of KMA is denser with a
ix
population density of 23,149 persons per km2. The average per-capita income in KMA in 2001- 02 was $341 at 1993-94 prices.
The Study Area
A special characteristic of KMA is its large slum population with more than a third of the total population residing in slums. These slums not only lack basic infrastructure and services but are also the hub of many informal manufacturing activities some of which involve highly toxic industries. Little oversight of such activities is carried out by government agencies. This mixed residential and commercial/industrial character of land use in slums make these areas highly vulnerable to extreme weather related events, especially flooding.
Methodology
The study modeled the impact of climate change on increased flooding in KMA. The main causes of flooding in KMA are intense precipitation, overtopping of the Hooghly River due to water inflow from local precipitation as well as that from the catchment area, and storm surge effects. Land subsidence was not included in the study as it was felt to be a localized problem in only a few pockets. The inputs in the study covered three main sources that aggravate flooding in KMA:
Natural factors: Flat topography and low relief of the area that cause riverine flooding and problems with drainage.
x
Developmental factors: Unplanned and unregulated urbanization, low capacity drainage and sewerage infrastructure that have not kept pace with the growth of the city or demand for services, siltation in available channels, obstructions caused by uncontrolled construction in the natural flow of the storm water, and reclamation of natural drainage areas (marshlands).
Climate change factors: Increase in the intensities of rainfall, sea level rise and increase in storm surge caused by climate change effects.
Firstly, flooding in KMA from intense precipitation was modeled for three scenarios: 30 year, 50 year, and 100 year return period flood events assuming no climate change effects. Secondly, the climate change effects were added to the 100 year flood event using the A1FI and the B1 scenarios respectively.
Assumptions about climate changes impact were included as follow: predictions for temperature and precipitation changes in Kolkata in 2050 arising from climate change were provided by JICA (JICA, 2008). It included a temperature increase in Kolkata of 1.80C for A1F1 scenario and 1.20C for B1 scenario. Precipitation predictions were provided as a fractional increase in the precipitation extremes of about 16 percent for A1F1 and 11 percent for B1 scenario imposed above the baseline distribution of precipitation. A sea level rise of 0.27 m by 2050 was also added to the storm surge for the A1F1 and B1 climate change scenarios based on current estimates. All these scenarios (with and without climate change effects) were then modeled to assess the impact in terms of the extent, magnitude, and duration of flooding.
Models used to determine the extent, magnitude and duration of flooding. Three separate models were used to capture the overall effect of natural, developmental, and climate change factors that lead to flooding in KMA. A hydrological model (SWAT model) was used to develop the flow series for the whole Hooghly catchment and the generated data was then fed into a hydraulic model (HECRAS model) to analyze the implication of the flood passing through the river stretch. Finally, a storm drainage model (SWMM model) was deployed to determine the flooding that will result once the river flooding is combined with local precipitation and drainage capability of the urban area under the extreme flood situation.
Vulnerability analysis. The models provided the increase in depth, duration, and extent of flooding in Kolkata due to climate change effects. However, even the same depth and duration of inundation can have significantly differing impacts on the population and infrastructure depending on the vulnerability of the affected area. So, a separate vulnerability analysis was done to assess the impact of flooding. Since the detailed data needed to do such analysis was available only for the KMC area, this part of the analysis was restricted to only KMC area. The vulnerability analysis was based on three separate indices created based on the depth and duration of flooding, nature of land use, existing infrastructure, and the socio-economic characteristics of the population. Of these, the relevant socio-economic characteristics of the population and the existing infrastructure were combined to develop a Social Vulnerability
xi
Index. The outputs from the model that provided the depth and duration of flooding were used to build a Flood Vulnerability Index. A Land-Use Vulnerability Index was then developed based on the prevailing land-use pattern. Finally, the three separate indices were combined to form a Composite Vulnerability Index.
Ward and sub-ward level vulnerability analysis were undertaken. To evaluate the impact from flooding in the KMC area, the vulnerability was first assessed at macro level by taking each ward as the smallest unit. This analysis helped identifying the 10 most vulnerable wards that may need specific attention while designing adaptation strategies. Thereafter, to ascertain the vulnerability within each ward in greater detail the analysis was extended to the sub-ward level using spatial data.
Damage assessment. The vulnerability analysis was followed by a separate economic damage assessment. This was also restricted to KMC area as key data used in the analysis were available only for KMC and not for entire KMA. The damage was estimated based on the stock and flow damages. The stock damage measured primarily physical damage arising out of water submersion (sectors include residential buildings and property, commercial and industrial establishment as well as major public infrastructure). Flow damage includes for example loss of income and increased morbidity, which are primarily linked to the duration of a flood. The damage estimates were based on data extrapolated to KMC population for 2050. However, no additional investments in flood protection measures that may be implemented in future to lower flood damage were assumed in the analysis. Inflation was also not considered, and all estimates were done using 2009 year prices. Damage assessments were estimated for the 100 year flood return period and the A1F1 climate change scenario to determine the additional damage caused by climate change effects.
Adaptation analysis. Finally, a separate analysis was done to examine adaptation measures in KMC that can alleviate some of the problems posed by flooding. The analysis mainly focused on gains from the complete desiltation of trunk sewers by modeling flooding under a completely desilted trunk sewers scenario. Other proposals of building new sewers and upgrading of sewers in vulnerable areas identified by the study were examined. Other infrastructural and non- infrastructural changes including institutional changes that can help cope with future flood damage were also examined.
Main Findings
First finding: The most vulnerable wards to climate change
Based on the hydrology, hydraulic and storm drainage modeling as well as on the vulnerability analysis, the study was able to identify the most vulnerable wards to climate change. These wards are: 14, 57, 58, 63, 66, 67, 74, 80, 108 (see Figure 4.2). Of these wards, the vulnerability of 6 wards (14, 57, 58, 66, 67, and 108) in the eastern part and ward 80 can probably be
xii
explained by the inadequate infrastructure, unplanned land-use, and poor socio-economic and environmental conditions. The infrastructural problems are getting even worse in recent times with increased building activity as these areas have become attractive to developers after becoming part of KMC.
The other 2 wards (63 and 74) have been identified as highly vulnerable due to their topography.
In these wards the capacity of the sewerage systems have not kept pace with the changes in population as the city has evolved. These have been further aggravated by inadequate maintenance as well as the siltation of the existing trunk sewer systems that have considerably reduced their carrying capacity. While the sewer networks in KMC under such partially silted condition still provide reasonable hydraulic capacity for carrying the dry weather flow, they prove highly inadequate for carrying the storm weather flow even with normal precipitation during the rainy season.
Second finding: additional loss likely to occur due to climate change
Overall the study finds that the damage from a 100 year flood will increase by about US$800 million to more than US$ 6.8 billion in 2050 due to climate change (A1F1 scenario). The impacts by sector in India Rupees are shown in the chart below. These are computed at 2009 prices. Local currency is converted to US $ using the Purchase Power Parity index for India of 2.88 (IMF, 2009). The largest component of damage under both the 100 year return period flood and the A1F1 climate change scenario are accounted for by residential property and buildings and health care. Commerce, industry and other infrastructure like roads and transport services also witness significant damage. It is important to note that due to data constraint, some impact could not be quantified in this analysis. Therefore the estimates provided are likely to understate the overall impact of climate change.
Total losses in major sectors in KMC (Rs million in 2050)
5,000 10,000 15,000 20,000 25,000 30,000 35,000 40,000
Residential building
Residential property
Residential income loss
Commerce Industry Health care Roads Transport Electricity
Current climate 100 year flood A1F1 climate 100 year flood
xiii
Third finding: investing in de-silting of trunk sewers will reduce area and population affected by floods.
The study looked at the impact of investing in de-silting trunk sewers both in the town and suburban systems of KMC. The business as usual scenario considers an average 30% silting in trunk sewers. The adaptation scenario considers investing in de-silitng and reducing it to zero.
The findings indicate that this simple investment can reduce the area affected by a flood by 4%
per cent and the population affected by floods by at least 5%.
Adaptation Measures
The current adaptation deficit. Urban flooding is a recurring phenomenon that Kolkata faces every year during the monsoon period. The local population has learned to adapt by developing a number of coping strategies for facing such periodic episodes of flooding. However, climate change is likely to intensify this problem through a combination of more intense local precipitation, riverine flooding in the Hooghly and coastal storm surges. If such intense precipitations are accompanied by extreme weather events such as cyclones, it can lead to widespread and severe flooding that can bring the city to a standstill for a few days. A major cause of such periodic flooding during the rainy season is the current adaptation deficit that Kolkata faces to cope with such recurrent events. This arises not only from deficiencies in physical infrastructure that lead to flooding but also from problems with land-use, socio- economic and environmental factors that can aggravate the impact of such flooding.
Adaptation Strategy. As the impact of flooding is likely to grow in the time horizon of 2050, the city needs a comprehensive and effective strategy that invests in both soft and hard infrastructure to tackle flooding problems in Kolkata. The goal of the strategy is to (i) reduce the percentage of people affected by flooding and sewage related diseases in KMC; and (ii) target the most vulnerable areas. The strategy should include preparedness both before and during the event as well as post-event rehabilitation strategies.
Investing in hard infrastructure. In order to fulfill the adaptation deficit currently faced by the city investment in hard infrastructure are needed. However the strategy to invest in hard infrastructure should take into account the following:
The strategy needs to follow a comprehensive approach to planning that recognizes drainage system complexity and interconnectivity of its elements such as storm water drainage, water supply, wastewater, water pollution control, water reuse, soil erosion, and solid waste management.
A strategy that protects major urban services including roads, traffic, water supply, electricity and telecommunications and that recognized the importance of open space, and green areas as an integral part of city development.
A strategy that spells out the climate risks and mitigating factors needed in operational
xiv plans for key relevant agencies.
Investing in soft infrastructure. To ensure a longer term financial, institutional and environmental sustainability the adaptation strategy should also include:
Strengthening of disaster management and preparedness for both pre and post disaster situations.
Enforcing land use and building codes to reduce obstruction and encroachments of floodplains and environmentally sensitive areas such as canal banks and wetlands and to prevent conversion of green spaces and natural areas that can act as retaining zones during flooding to delay runoffs or reduces their volume through infiltration.
Introducing sustainable financing for infrastructure investment and maintenance from two angles – cost reduction and cost recovery.
Increasing the budget for sewerage and drainage maintenance and greater allocation of money for silt removal and mechanical sewer cleaning.
Adopting flood insurance that incorporate suitable incentives for adaptation and minimize flood damage.
Strengthening regulatory and enforcement process including improving institutional management and accountability.
Enforcing pollution management frameworks including introduction of incentives and disincentives to ensure compliance with regulations.
The Government of West Bengal has already started investing in adaptation. Among the suggested adaptation measures, a number of projects are either currently under way or are planned for future implementation in KMA under the Jawaharlal Nehru National Urban Renewal Mission (JNNURM) and the KEIP scheme funded by ADB. The selection and prioritization of projects for adaptation have to be made based on cost benefit analysis using the net present value (NPV) approach. Factoring in the additional impact due to climate change in such cost benefit analysis may render many projects - that did not show an adequate return on investment earlier- economically viable.
Chapter 1. I
NTRODUCTION1.1 BACKGROUND
1.1 Recent climatic events have illustrated that coastal areas are vulnerable to a range of risks related to climate change. The Inter Governmental Panel on Climate Change (IPCC) specifically identifies as hotspots the heavily urbanized megacities in the low-lying deltas of Asia (IPCC, 2007). Among Asian countries, India is particularly vulnerable with a 7,500 km long coastline that is predominantly low-lying. These coastal areas are also densely populated with about 130 cities, including megacities such as Mumbai, Kolkata, and Chennai. Most cities in India contain large and densely populated conglomerations of slums and shanties that are invariably located in areas most vulnerable to flooding. Indeed, flooding is a recurrent annual feature following the monsoons in these cities. Such flooding conditions and associated impact caused by weather related events may dramatically worsen into disasters with the addition of the increased risk of storm surges, cyclones, and intense precipitation induced by climate change effects.
1.2 Potential climate changes are likely to cause an increase in the frequency and intensity of these natural disasters. Anticipated risks include an accelerated rise in sea level of up to 60 cm or more by 21001, a further rise in sea surface temperatures by up to three degrees centigrade, an intensification of tropical cyclones, and large extreme waves and storm surges. According to the first global assessment of the exposure of port cities to coastal flooding and likely climate change impact on this flooding (OECD, 2007), Kolkata and Mumbai feature in the top ten cities with the maximum exposure to flooding under the current situation. In fact, the study shows that the exposure only increases by 2070 when Kolkata is expected to lead the top 10 list in terms of population exposure. Although there is considerable uncertainty in the estimation of risks posed by climate change, it is increasingly apparent that cities, particularly those located in low-lying coastal areas, such as Kolkata, need to manage and adapt to those risks as part of their broader planning processes.
1.3 Adaptation to face the challenges posed by climate change is critical. While a number of cities are taking steps to mitigate their carbon footprint, there has been relatively less attention on how developing country cities can adapt and respond to climate change risks. Given the ever- increasing urbanization and the importance of cities as drivers of economic growth, the need for adaptation measure at the city level is even more critical, especially to address the vulnerability arising out of informal labor markets and unorganized income generating and production sectors.
Furthermore, the characteristic features of many developing country urban areas include large concentrations of population, unplanned and unregulated development with scant attention to environmental issues or building standards, and limited infrastructure and service delivery (such as
1 Estimates regarding sea level rise vary. A recent Science article estimates increases ranging from 80 cm to 200 cm by the end of the century. See http://Sciencenow.Sciencemag.org/cgi/content/full/2008/904/1?etoc
poor drainage, limited solid waste collection, etc.). These pose additional significant challenges to adaptive responses to extreme events.
1.2 OBJECTIVE
1.4 As a response to these potential effects, a regional study to assess the impacts of climate change on major coastal cities in Asia has been undertaken. The objective of this work is to improve the understanding of climate change risk to coastal cities and identify potential measures that would help the affected populations adapt to these risks. This work involves the World Bank in collaboration with the Asian Development Bank (ADB) and the Japan International Cooperation Agency (JICA). These three organizations are undertaking four country level studies that will be presented individually and through a joint synthesis report on the main findings. The case studies include those in Manila led by JICA, Ho Chi Minh City led by the ADB and Bangkok and Kolkata led by the World Bank. In all these studies, there is a special emphasis about the impact on the poor and marginalized segments of society, with respect to social, environmental, and economic aspects.
The three broad area of focus of the individual city case studies are to:
Establish a climate change related historical knowledge base for use in the city specific impact analysis and adaptation strategy formulation as well as to raise public awareness;
Define and evaluate the impacts of climate change (from social, economic, and environmental viewpoints) on the basis of stylized scenarios for the city; and,
Help formulate city level strategies for implementation in the short-, medium-, and long- term to make adaptation and coastal zone development plans more robust with inclusion of climate change effects, thus enhancing the resiliency of natural and physical systems.
1.5 The Kolkata case study presented in this report is an important component of these series of case studies. This study aims to strengthen the understanding of the likely economic, social and environmental impacts of climate change on the city of Kolkata with a specific goal to:
Compile a data base with past weather related information and current resources in place designed to cope with extreme weather related episodes;
Determine scenarios most appropriate for assessing the impact of climate change;
Develop hydrological, hydraulic, and storm drainage models to identify vulnerable areas and determine physical damage estimates resulting from climate change effects;
Assess economic, social, and environmental impacts resulting from such climate change events;
Formulate adaptation proposals to mitigate damage arising out of climate change effects
Strengthen local capabilities to assess climate related damage so that the planning process in the Kolkata Metropolitan Area (KMA) and the government can account for such data in all future projects
1.3 SCOPE
1.6 The analysis focuses on urban flooding due to (i) increases in extreme precipitation, (ii) sea level rise and (iii) storm surges arising from climate change.
The scope of the study includes:
Increased precipitation in Kolkata that can lead to flooding and water-logging due to inadequate sewerage and drainage facilities.
Riverine flooding in the Hooghly from the simultaneous increased precipitation in the upstream of the Hooghly River that can result in increased water flow in the river basin adjoining Kolkata and its surrounding areas.
Storm surge arising out of cyclone and other storm activity.
Sea level rise as these can cause higher water levels in the Hooghly thus exacerbating the flooding.
The study therefore assumes that flooding, whether from urban storms, cyclones, increased precipitation in the larger Gangetic watershed that translates into riverine overflows, and sea surges from storm surge as well as sea-level rise, is the key causal factor for damage of urban infrastructure and loss of livelihoods resulting from weather events.
The scope of the study does not include:
Increased flooding from other possible extreme events like tsunamis that require specialized oceanic modeling.
Direct wind damage from increased cyclone and other storms.
1.7 The geographical area covered under the scope of this study was determined as Kolkata Metropolitan Area – the heart of the urban area with considerable ongoing and projected development. KMA accounts for an area of about 1,851 km2 and consists of 3 Municipal Corporations (incl. Kolkata Municipal Corporation), 38 other Municipalities, 77 non-municipal urban towns, 16 out growths, and 445 rural areas. Flooding in the KMA area arises from a cumulative effect of local precipitation and riverine flooding from Hooghly River. This flooding situation can get extremely severe when local flooding conditions combine with riverine flooding and storm surges2. However, in the case of KMC, flooding is usually caused only by intense local rainfall or urban storms. This is primarily a function of the urbanization and the condition of sewerage networks in the city that intensify the flooding event.
2This would be like the „perfect storm‟ where river overtopping combines with local intense urban storms (perhaps related to the precipitation event in the larger watershed or a cyclonic event), storm surges and high tides. This would result in rapid and increased flooding in KMC with few areas for outflow (particularly if the storm drains flowing into the Hooghly are shut to prevent storm surges entering the city), thereby likely resulting in more flooding and a longer period of water retention.
1.4 APPROACH AND METHODOLOGY
1.8 The study has been carried out in a number of phases. Figure 1.1 below provides the workflow of the methodology used for the study. Once the scope and the project area for the study were identified, relevant information that could prove useful for future modeling and analysis was collected by Integrated Natural Resources Management (INRM), the principal consultants for the study. The counterparts for the study in the Government of India include the Ministry of Environment and Forestry (MOEF) at the Federal level and the West Bengal Pollution Control Board (WBPCB) at the State level. Detailed modeling of the effects of climate change as it relates to increased precipitation and water flow was carried out next to assess the likely extent and duration of inundation in the study area.
Figure 1.1 Workflow methodology for climate change impact assessment in Kolkata
1.9 Emission Scenarios. The uncertainties of possible future climate change conditions mandate the use of a range of scenarios while conducting impact studies. The IPCC Special Report
on Emission Scenarios (SRES)3 categorizes the possible future climate change effects into four broad scenarios (Table 1.1). The current study focuses on two of those scenarios, the A1F1 and B1 as these represent two extreme scenarios and the other scenarios will be somewhere in between. In the A1 scenario the story-line involves a rapid economic growth, low population growth and a convergence of income and way of life between regions. The A1 scenario develops into 3 groups that describe alternative directions of technological change in the energy system. The three A1 groups are: fossil intensive (A1F1), non fossil energy sources (A1T) or a balance across all sources (A1B). The scenario with fossil intensive (A1FI) scenario is chosen as the scenarios for the study. The B1 scenario assumes low population growth with development taking place in an environmentally sustainable manner using clean and resource efficient technologies that place emphasis on global solutions to achieve economic, social, and environmental sustainability.
Table 1.1 Summary of IPCC emissions scenarios A1 Scenario
World: Convergent world
Economy: Market oriented, rapid economic growth Population: Peaks in 2050 and then gradually declines Governance: A convergent world in which regional average income per capita converge, current distinction between “poor” and “rich” countries eventually dissolve.
Energy: There are three subsets to the A1 family A1FI – Fossil fuels intensive
A1B - Balanced on all energy sources.
A1T - Non- fossil energy sources.
A2 Scenario
World: Differentiated world
Economy: Regionally oriented, lowest per capita income
Population: Continuously increasing population Governance: Independently operating, self-reliant nations
Technology: Slower and more fragmented
B1 Scenario
World: Convergent world
Economy: service and information based, lower growth than A1
Population: Same as A1.
Governance: Global solutions to economic, social and environmental stability
Technology: Clean and resource efficient technologies
B2 Scenario
World: Differentiated world
Economy: Intermediate levels of economic development
Population: Continuously increasing population, but at a slower rate than in A2.
Governance: Local solutions to economic, social and environmental stability
Technology: more rapid A2, less rapid more diverse A1/B1
Source: Nakicenovic, N. et al (2000)
1.5 PREPARATION PROCESS
1.10 Building local capacity. One of the key tasks within the study process was to ensure capacity building of the local departments involved in the study, particularly on the analysis and the modeling aspect. Accordingly, steps were taken to involve representatives from the local agencies
3 Nakicenovic, N. et al (2000)
on a continuing basis throughout the course of the study. In an inception meeting, the team of consultants conducting the analysis made presentations before local government stakeholders about the approach of the study. Officials from the WBPCB, the Institute of Wetland Management and Ecological Design, and a number of specially identified agencies, departments and organizations attended that meeting. Opportunities were also created for these representatives to interact with the study team at various points during the timeline of the study. The many valuable suggestions received from the participants during such discussions were duly incorporated in the final study.
1.11 Specific training was also provided about the modeling. A training workshop was held in Kolkata during the mid-course of the study (February 20-21, 2009). The training was attended by members of the climate change cell in WBPCB as well as by various government departments identified as key stakeholders for this study. The workshop covered all the models namely, SWAT (Soil and Water Assessment Tool) hydrological model, HECRAS (Hydrologic Engineering Centers River Analysis System) hydraulic model, and SWMM (Storm Water Management Model) urban hydrological model. Besides presentations on the theoretical background of these models, live demonstrations were made using the data of the Kolkata case study. All the models were loaded4 on the computers in the WBPCB along with the appropriate databases of Kolkata. This will enable future refinement of the modeling and analysis by local officials as improved data becomes available. Besides the live running of the models, the background material and manuals were installed on the systems. Specialized tutorials were also formulated using the Kolkata case study and were used for hands-on sessions by the participants. These databases and the various scenarios used under alternative model runs were subsequently updated on the occasion of a later interaction with the members of the climate change cell.
1.6 ORGANIZATION OF THE REPORT
1.12 The report consists of two primary segments, the main report and a set of annexes. The main report consists of six chapters and an executive summary. Chapter 1 is an introduction to the study while the Chapter 2 describes the study area with historical background information. Model development and simulation to determine the timing and magnitude of floods of different return periods used for flood hazard analysis is covered in Chapter 3. Chapter 4 describes methodology to determine vulnerability of the area and subsequently provides analysis utilizing the results of the flood modeling to identify areas, populations, and facilities that are vulnerable to flood hazards.
Chapter 5 presents the damage assessment. Chapter 6 covers local institutional capacity, details of ongoing projects addressing possible mitigation, local coping strategy and adaptation options.
Details of all the simulation models used for the study and complete scenario results are presented as Annexes.
4 All these models are public domain models and thus do not require licenses for use.
Chapter 2. K
OLKATA– A - P
ROFILE2.1 GEOGRAPHIC AND PHYSIOGRAPHIC CHARACTERISTICS OF THE STUDY AREA
2.1 Administrative boundary of Kolkata Metropolitan Area. Kolkata, earlier known as Calcutta, the capital of the State of West Bengal in India, first started as a British trade settlement.
The city of Kolkata is one of Asia‟s largest urban centers. Kolkata urban agglomeration, called Kolkata Metropolitan Area (KMA), has continuously expanded over the years and presently extends over 1,851 km2. It consists of a complex set of administrative entities comprising: 3 Municipal Corporations (incl. Kolkata Municipal Corporation), 38 other Municipalities, 77 non-municipal urban towns, 16 out growths, and 445 rural areas (Annex A). Kolkata Municipal Corporation has an area of 185 km2 and is divided into 141 wards.
Figure 2.1 The study area
2.2 The study area focuses on KMA as defined in the Vision 2025 document. The study area of this report was adopted in order to benefit from other ongoing government programs like the Jawaharlal Nehru National Urban Renewal Mission (JNNURM, 2005). However, given the paucity of available data for the entire KMA for all aspects of the study, some of the more detailed vulnerability and damage analysis were confined to KMC.
2.3 KMA’s physiographic location is between 22019' N to 23001' North Latitude and 88004' E to 88033' East Longitude and within that KMC is located between 220 37' N to 22030' North Latitude and 88023' E to 88018' East Longitude (Figure 2.1). The KMA is made up of a continuous urban area stretching in a linear pattern along the east and west bank of the river Hooghly surrounded by some rural areas lying as a ring around the conurbation and acting as a protective green belt. Within KMA, the KMC lies along the tidal reaches of the Hooghly and was once mostly a wetland area.
Reflecting its previous character, a number of natural depressions remain; many of which are dead river channels. The remaining wetlands, known as the East Calcutta Wetlands have been designated as a "wetland of international importance" under the Ramsar Convention. While Kolkata is often perceived as a coastal city, in reality it is about 145 km away from the Bay of Bengal.
2.4 The slope and the transformation of the marshy eastern land into an urban sprawl have made drainage inevitably difficult for Kolkata. The elevation of KMA is within a range of 5 to 11 meters above sea-level (masl) with an overall average of about 8 masl. The elevation of KMC ranges from 1.5 to 9 masl with an average elevation of 6 masl. The overall slope in KMC is from north to south and from west to east - from the east bank of the Hooghly River to the Salt Lakes. The highest parts of KMC lie along the eastern bank of the Hooghly River. The land slopes downward steeply in the northern side while in the southern side, the slope is more gradual. The riverside levee is the highest part of the city. At Garden Reach on the riverside, the levee is nearly 7 masl. Towards Tiljola on the eastern fringes, the height of the levee comes down to less than 3 masl (Bhattachrya, M. 2008).
2.5 Geologically, the area in KMA forms a part of the Bengal Basin and is underlain by Quaternary sediments of fluvio-deltaic origin consisting of a succession of clay, silt and sand of varying texture from fine to coarse grain size (Chaterji et al., 1964). The principal water bearing horizons occur at depths between 60 and 180 m in medium to coarse sand and pebble layers (Biswas & Saha, 1985). The overlying clay layers with wood stumps and peat beds are highly compressible that can lead to land subsidence during over extraction of groundwater (Chatterjee et al., 2006).
2.2 CLIMATE
2.6 The region around KMA is subject to short, high intensity precipitation, especially during the monsoon months. This along with occasional coincidence of high tide is the usual source of urban flooding. KMA has a tropical wet-and-dry climate with an annual mean temperature of 26.80C and monthly mean temperatures in the range of 19-300C (Figure 2.2). The area receives most of its rainfall from the South-West monsoon between June and September. The annual rainfall is about 1,600 mm and the highest rainfall usually occurs during the monsoon in the month of August. The study of storm patterns (KEIP, 2007) revealed that peak rainfall intensities occur
anywhere between 15 to 180 minutes after the start of rainfall and such storm events often occur two or more times in a day during the monsoon.
Figure 2.2 Mean monthly temperature and rainfall in KMA
2.3 DEMOGRAPHY
2.7 KMA features among the 30 largest mega-cities of the world having population in excess of 10 million (United Nations, 2007). As per the 2001 Census, the population of KMA is 14.72 million, of which KMC accounts for 4.6 million people. Average population density in KMA is 7,950 persons/ km2. KMC, the more urbanized heart of KMA is denser with a population density of 23,149 persons/ km2 as it accounts for 31% of KMA‟s population with only 10% of its area.
Population growth rate of KMA has been in the 1.8-2.6% range. KMA population is projected to rise to 17 million in 2011, 20 million in 2021, and 21.1 million in 20255 (Figure 2.3). Although population growth rate in KMA shows a declining trend, the absolute size of the population and its high density continue to pose challenges to urban growth. In addition, the urban continuum around the cities of Kolkata and Howrah in KMA area is continuing to grow and may have its impact on the projected population for KMA (Annex A).
5 http://www.kmdaonline.org/html/about-us.html Official website of the Kolkata Metropolitan Development Authority
20 5 114 252 328
140
36 43 31 10
325 297
J F M A M J J A S O N D
Rainfall (m m )
13 15 2 1 2 4 2 5 2 6 2 6 2 6 2 6 2 4 18 13 3 2 3 2
3 2 3 3 3 2 3 6 3 6 3 4
2 9
2 7 2 6
2 9
J F M A M J J A S O N D
Maxim um Tem perature (°C) Minim um Tem perature (°C)
Figure 2.3 Population growth in KMA (1950-2025) in millions
Source: United Nations, World Urbanization Prospects: 2007
2.8 A special feature of the population of KMC is its large share of slum population that increases its vulnerability to natural disasters. More than a third of the population of KMC resides in slums. The area under KMC has 2,011 registered, and 3,500 unregistered slums. Spatial concentration of slum population in KMC area is shown in Figure 2.4. Six wards (Numbers 58, 29, 137, 134, 65, 135) out of the 141 wards in KMC have slum population in excess of 90 % (Annex A shows the characteristics of these 6 wards). The increasing population pressure, dense urban environment and low coping capacity of population living in slums make these wards some of the most vulnerable parts of the city.
Figure 2.4 Spatial distribution of slum population in KMC
Source: Census of India, 2001 0 5 10 15 20
Population (million)
2.4 ECONOMY
2.9 KMA has witnessed a rise in the secondary and tertiary sectors over time. KMA has witnessed a fall in the share of primary sector (largely agriculture) and an increase in the secondary (industrial) and tertiary (services) sectors. Manufacturing industries and construction activities constitute the core of secondary sector activities in the metropolitan area and the banking, insurance and transport sub-sectors constitute the core tertiary sector. The jute textile industry has been traditionally dominant in KMA and is the largest in the country. Table 2.1 shows the growth rate of State Domestic Product that reflects the recent trends of structural changes in the economy of KMA.
Table 2.1 Annual average growth rate of state domestic product for KMA & West Bengal
KMA West Bengal
Sectors Average Annual Growth (%) Average Annual Growth (%) 1985-86 to 1993-94 1993-94 to 2001-02 1985-86 to 1993-94 1993-94 to 2001-02
Primary 1.58 -4.79 5.62 4.18
Secondary 1.81 5.71 4.92 6.36
Tertiary 3.8 11.06 8.42 9.5
Total 2.96 9.04 6.51 7.13
Source: JNNURM, 2005
2.10 The majority of industries are concentrated in KMC (68%) and Howrah Municipal Corporation (14%). The important industries in KMC are jute manufacturing, light and heavy engineering, leather products, textiles, paper, pharmaceuticals, chemicals, tobacco, food products, glass products, and electrical and electronic products. Of the approximate 9,000 industries in KMC about 1% are categorized as large, 3% as medium, and the remaining 96% as small scale industries6. 2.11 Industries have been categorized according to their pollution potential. Figure 2.5 and their location is depicted in the ward using the respective categories. West Bengal Pollution Control Board have categorized7 all industries in descending order of their pollution potential as Red (like Jute processing with dyeing, Tanneries, metal smelters), Orange (like Automobile servicing, repairing and painting, Hotels & Restaurants, Pharmaceutical formulation) and Green (Acid lead battery, Leather cutting and stitching, Power looms without dyeing and bleaching). Based on these classifications, there are 18% red, 31% orange, and 51% green industries in the KMC area. An inset in the top right corner of figure 2.6 depicts the category wise composite number of these industries in some of the selected wards with large number of industries. The yellow hue used in the wards depicts the total number of industries present in the ward.
6A small scale industrial unit has investment in fixed assets of less than Rs 10 million. The large scale industries are defined by the category of industries.
7 Depending upon the pollution potential of different industries, the West Bengal Pollution Control Board has classified the industrial units into three different categories: red, orange and green. The red category units have maximum pollution potential, the orange category units have moderate pollution potential and the green units have the least pollution potential.