Research Collection
Journal Article
Quantification of individual Rare Earth Elements from industrial sources in sewage sludge
Author(s):
Kaegi, Ralf; Gogos, Alexander; Voegelin, Andreas; Hug, Stephan J.; Winkel, Lenny H.E.; Buser, Andreas M.;
Berg, Michael Publication Date:
2021-05-01 Permanent Link:
https://doi.org/10.3929/ethz-b-000474259
Originally published in:
Water Research X 11, http://doi.org/10.1016/j.wroa.2021.100092
Rights / License:
Creative Commons Attribution-NonCommercial-NoDerivatives 4.0 International
This page was generated automatically upon download from the ETH Zurich Research Collection. For more information please consult the Terms of use.
ETH Library
Quanti fi cation of individual Rare Earth Elements from industrial sources in sewage sludge
Ralf Kaegi
a,*, Alexander Gogos
b, Andreas Voegelin
a, Stephan J. Hug
a, Lenny H.E. Winkel
a,c, Andreas M. Buser
d, Michael Berg
aaEawag, Swiss Federal Institute of Aquatic Science and Technology, Überlandstrasse 133, CH-8600, Dübendorf, Switzerland
bEMPA, Swiss Federal Laboratories for Materials Science and Technology, 9014, St. Gallen, Switzerland
cInstitute of Biogeochemistry and Pollutant Dynamics, ETH Zurich, 8092, Zurich, Switzerland
dSwiss Federal Office for the Environment (FOEN), 3063, Ittigen, Switzerland
a r t i c l e i n f o
Article history:
Received 15 December 2020 Received in revised form 1 February 2021 Accepted 6 February 2021 Available online 13 February 2021
Keywords:
Sewage sludge Rare earth elements Industry
Wastewater Soil
a b s t r a c t
Rare Earth Elements (REEs) are used in increasing amounts in technical applications and consumer products. However, to date, the contribution of industrial sources to the loads of individual REEs in wastewater streams have not been quantified. Here, we determine the REE contents in sludge collected from 63 wastewater treatment plants (WWTPs) across Switzerland. To quantify the industrial fraction of individual REEs in the sewage sludge, we develop two complementary approaches, based on REE ratios and REE patternfitting. Unspecific (background) inputs, with REE patterns similar to the averaged REE pattern of soils collected across Switzerland, dominate the REE budget of most WWTPs. A few WWTPs receive significant REE inputs from specific industrial sources. Based on population equivalents of Switzerland, we estimate a total annual load of 4200 kg Cerium (Ce, 0.5 g Ce year-1capita-1), with an industrial contribution of 2000 kg year-1. The latter agrees with estimates of probabilistic mass flow models for engineered nanoscale CeO2particles discharged to the sewer network. About 7 kg year-1of Samarium (Sm,total for Switzerland: 184 kg year-1or 0.02 g Sm year-1capita-1) and 3 kg year-1 of Europium (Eu,total for Switzerland: 44 kg year-1or 0.005 g Eu year-1capita-1) are assigned to industrial inputs from single WWTPs. Gadolinium (Gd) is used in the form of a stable complex as contrast agent in magnetic resonance imaging. Assuming 10% removal of Gd during wastewater treatment, we calculate an annual discharge of 90 kg of Gd from one individual WWTP to surface waters. WWTPs with exceptionally high industrial inputs of specific REEs warrant detailed investigations to identify the respective sources and to assess whether REE concentrations in effluents are elevated to the same degree.
©2021 The Author(s). Published by Elsevier Ltd. This is an open access article under the CC BY-NC-ND license (http://creativecommons.org/licenses/by-nc-nd/4.0/).
1. Introduction
Rare earth elements (REEs) include the lanthanides (La to Lu) and share comparable geochemical properties. According to the IUPAC definition, also Scandium (Sc) and Yttrium (Y) belong to the REEs (Connelly et al., 2005), but are often excluded in studies focusing on REEs. Starting from Lanthanum (La) with an outer electron configuration of 5d16s2the 4f orbitals arefilled up with increasing atomic weight. Thus, all REEs have an almost identical ionic radius ranging from ~1.15 Å (La) to ~0.97 Å for Lutetium (Lu), which, together with their common trivalent oxidation state,
explains their similar geochemical behavior. The only exceptions are Ce and Eu, which can also occur in the tetravalent (Ce4þ) or the divalent (Eu2þ) oxidation state. The different properties of Ce4þand Eu2þ compared to their trivalent counterparts results in well- described anomalies (Bau, 1991; Goldstein and Jacobsen, 1988;
Kidder et al., 2003;Sinha, 1983). Although REEs are not as rare as the name suggests (the name relates to rare minerals rather than to low abundances), the REEs are classified as technologically critical elements because of their importance in high-tech applications in the fields of energy technology, communication and mobility (Cobelo-García et al., 2015). Therefore, the identification and quantification of relevant REE waste streams in combination with the development of efficient and‘green’recycling approaches are required. In addition, REEs are considered as emerging micro- pollutants for which still limited knowledge of impacts on
*Corresponding author.
E-mail address:ralf.kaegi@eawag.ch(R. Kaegi).
Contents lists available atScienceDirect
Water Research X
j o u r n a l h o m e p a g e : h t t p s : / / w w w . j o u r n a l s . e l s e v ie r . c o m / w a t e r - r e s e a r c h - x
https://doi.org/10.1016/j.wroa.2021.100092
2589-9147/©2021 The Author(s). Published by Elsevier Ltd. This is an open access article under the CC BY-NC-ND license (http://creativecommons.org/licenses/by-nc-nd/4.0/
).
ecosystems is available (Celis et al., 2020;Gwenzi et al., 2018).
Several high-tech industries, including automotive, electronics and renewable energy are dependent on REEs, which, therefore, are intensively mined (Du and Graedel, 2013;Ramos et al., 2016). The world production in 2018 amounted to 170,000 metric tons of REE oxides with more than 70% mined in China. The application of REEs is generally distributed as follows: catalysts, 60%; ceramics and glass, 15%; metallurgical applications and alloys, 10%; polishing, 10%
(Mineral commodity summaries, 2015).
Elevated, Post-Archean Australian Shale (PAAS)-normalized values of specific REEs relative to the normalized values of the remaining REEs can only be achieved by a selective input of specific REEs and point towards an industrial contribution of the respective REEs. Amongst all REEs, the fate of Gd received the most attention, due to the use of Gd-based contrast agents for magnetic resonance imaging (MRI,European Medicines Agency, 2017). Elevated con- centrations of Gd in surface waters are associated with hospital wastewater (Kovalova et al., 2013;Kümmerer and Helmers, 2000) asfirst reported byBau and Dulski (1996)more than two decades ago. Since then, elevated Gd contents have been detected in several rivers and lakes (Bau et al., 2006; Elbaz-Poulichet et al., 2002;
Klaver et al., 2014;Knappe et al., 2005;Lerat-Hardy et al., 2019;
M€oller et al, 2002,2003;Parant et al., 2018;Rabiet et al., 2009;Song et al., 2017). Following Gd, also La (Klaver et al., 2014;Kulaksız and Bau, 2011) and more recently Sm associated with anthropogenic uses were observed in surface waters (Kulaksız and Bau, 2013).
Compared to Gd, which is present in aqueous solutions as a stable complex, La and Sm are transported together with the particulate phase and occur mainly in the colloidal size range between 10 kDa and 0.2mm (Klaver et al., 2014;Kulaksız and Bau, 2013). Further- more, slightly elevated La and Sm concentrations in the Han river have been associated with emissions fromfluid catalytic converters (Song et al., 2017). Elevated REE concentrations reported for Western Xiamen Bay (China) were explained by inputs of sewage sludge and fallout from coal combustion (Hu et al., 2019). However, all REEs were enriched to a comparable degree, indicating that specific REE sources in the wastewater were absent. High concen- trations of La, Ce, Pr, Nd and Sm and enrichment of light REEs (LREEs, LaeGd) compared to the heavy REEs (HREEs, TbeLu) in selected sewage sludge samples were explained by industrial dis- charges to wastewater systems (Kawasaki et al., 1998;Vivian, 1986).
However, no attempts were made to quantify these industrial in- puts. Elevated concentrations of REEs were also reported from three different WWTPs in China and were assigned to industrial sources (Suanon et al., 2017). In the same study, only the enrich- ments relative to the average crust were determined and the quantitative industrial inputs of the respective elements were not assessed.Nkinahamira et al. (2019)suggested crustal materials as the main source of REEs reported from 7 WWTPs in Xiamen city, China, as opposed to industrial inputs. Selectively increased La and Ce values compared to other (normalized) REEs, however, pointed towards an industrial input of La and Ce.Verplanck et al. (2010) investigated the REE patterns in sewage sludge from four large metropolitan WWTPs in the United States, but did not observe any REE anomalies. The available data from the literature, therefore, suggest that a wide range of different amounts of individual REEs from specific industrial sources are discharged to wastewater sys- tems but this has not been addressed systematically.
To obtain an overview of the REEs contents in sewage sludge, we determined the REE concentrations in sewage sludge samples collected from 63 representative WWTPs across Switzerland. For the identification of the fraction of all REEs related to specific in- dustrial inputs, we refined the approach recently presented by Gogos et al. (2020), which relies on the change of REE ratios in sewage sludge due to the selective input of specific REEs.
Additionally, the industrial fractions of individual REEs were esti- mated byfitting the REE patterns of the sludge to a background REE pattern, represented by the averaged REE pattern of 10 soils collected across Switzerland. Both approaches included the whole suite of REEs and enabled us to identify REE anomalies, estimate the industrial fractions of REEs in sewage sludge and quantify their contents in the sludge in terms of kg year-1. As both approaches rely on a change of the REE patterns, industrial inputs having similar REE patterns as the background will not be detected and will contribute to the background REE loads. In the manuscript, we therefore define industrial REE inputs as inputs from industrial sources with specific REE patterns, which are different from the REE patters of the background. We also attribute excess Gd, which is mostly related to contrast agents for MRI, to industrial sources. Gd based contrast agents are mainly found in hospital waters, but they still have an industrial origin with a very specific REE signature.
2. Materials and Methods 2.1. Soil samples
Soil samples were obtained from the Swiss Soil Monitoring Network (NABO, 2019) and included a range of different lithologies and land uses. The locations of the 10 soils and the characteristics of the respective soils are given in the SI(Figure S1,Table S1).
2.2. Collection of sewage sludge samples
All sludges included in this work were collected between February and March 2016 and are described inVriens et al. (2017) The locations of the corresponding WWTPs are provided in the SI (Figure S2). The data on the connected population and on the sludge production volumes were updated and correspond to the years 2016 (sludge production volumes) and 2017 (connected population) (Table S2).
2.3. Characterization of soils and sewage sludge
To determine the total REE content of the sludge and the soil samples, between 30 and 50 mg of powdered material were digested using a two-step digestion protocol. The samples were first digested in 5 mL nitric acid (HNO3, 69 wt%, Suprapur Roti- puran, Carl Roth GmbH) and 300mL hydrofluoric acid (HF, 48 wt%, Suprapur, Sigma-Aldrich) using a microwave system (MLS ultra- CLAVE, MLS GmbH, Leutkirch, Germany). In the second step, the digests were reacted with 2.4 mL boric acid (H3BO3, 5 wt%, Merck, Germany) and afterwardsfilled to 50 mL with doubly deionized (DDI) water (Millipore, 18.2 MU∙cm). The measurements were conducted using inductively-coupled plasma mass spectrometry (ICP-MS, Agilent 8900, Agilent Technologies Inc., CA, USA).
A certified reference material (BCR®e667, estuarine sediment) with reference values for all REEs was used for quality assurance.
Recoveries were determined based on BCR samples digested and measured along with the sludge and soil samples. The BCR material digested in duplicates or triplicates on 10 different days gave mean recoveries for all REEs ranging between 95% (Lu) and 113% (Pr) (Figure S3). Experimental samples (sludge and soil) were mostly digested in triplicates and in a few cases in duplicates. For further data evaluation, the average of the triplicates/duplicates were used.
All data are presented inTable S2(sludge) and S3 (soil). Oxide and hydroxide formation of (lighter) REEs in the plasma of the ICP-MS is well documented and can lead to interferences with heavier REEs (Aries et al., 2000;Dulski, 1994). We, therefore, measured single elements standards of Ba, and selected REEs (La, Ce, Eu, Gd, Dy, Ho, Er, Lu). Most important for the current project were possible
interferences between CeO/CeOH and Gd, as Ce showed the highest abundances of all REEs in the sewage sludge. ICP-MS measure- ments of a Ce single element standard indeed resulted in increasing counts of 157Gd (Figure S4), however, the oxide/hydroxide pro- duction rate was<0.1% and a respective correction of the measured Gd values, did only marginally affect the calculated, industrial fractions of Gd in the sewage sludge. Nevertheless, the Gd values were corrected accordingly. Furthermore, up to 10 ppb of Ba did not result in quantifiable counts for Eu and, thus, the BaO/BaOH pro- duction rates were considered negligible.
In addition, single element standards of Sn and Sb were measured to evaluate interferences of these elements and their oxides (123Sb16O)/hydroxides (122Sn16OH) with139La. Even 10 ppb of Sb and Sn did not result in any quantifiable La counts. Also Ba up to 10 pbb did not result in any quantifiable counts of the neigh- boring139La.
2.4. Quantification of the industrial REE-fractions
In several studies, REE anomalies (mainly Gd, but more recently also La and Sm) were quantified by estimating the background concentrations of an element of interest (EoI) via an inter- (La, Sm) or an extrapolation (La) of the concentrations of other, mostly neighboring REEs (Bau and Dulski, 1996;Hatje et al., 2016;Klaver et al., 2014;Knappe et al., 2005;Kulaksız and Bau, 2013).M€oller et al. (2002)used a third-order polynomialfit to the log10 trans- formed REE patterns to assess the background concentration of Gd.
Recently, an alternative method to identify and quantify in- dustrial contributions of REEs in sewage sludge has been presented (Gogos et al., 2020), which exploits the difference between specific REE ratios in the sewage sludge and in the background. In this work, we further modified and extended this approach (later referred to as A1) to include the whole suite of REEs (La: Lu). Alternatively, we fit REE patterns of the individual sewage sludge samples the background REE pattern and assign the differences to the industrial contribution of the respective REEs (approach A2). In both ap- proaches, which are explained below, we use the averaged REE pattern of 10 soils collected across Switzerland as a proxy for the background REE pattern in sewage sludge. Individual WWTPs receiving substantial amounts of selected REEs were identified based on outlier criteria.
2.4.1. Calculations based on the REE ratios
The approach A1 is based on the assumption that the total amount of REEs in the sludge can be described as the sum of an industrial and a background fraction, whereas the background fraction exhibits a constant REE pattern reflecting the averaged REE pattern of the collected soil samples. Any modification of this (background) REE pattern results from an input of specific, indus- trial REEs. The industrial fraction of specific REEs in the sewage sludge can, thus, be calculated as follows:
REESLGRef
REESLGEoI ¼fREEBK,REEREEBKRefBK
EoIþfREEIND,REEREEINDRefIND EoI;
withREEBKRef
REEBK EoI
¼const;REEINDREEINDRef
EoI
¼0
(eq 1)
fREEBK ¼REESLGRef REERefBK,REEBKEoI
REESLGEoI (eq 2)
fREEIND¼1REESLGRef REERefBK,REEBKEoI
REESLGEoI (eq 3)
REEEoISLG; REEEoIBK andREEEoIINDrefer to the concentrations of a specific element of interest (in sludge (SLG) and in the background (BK)) with a possibly elevated concentration in the sludge due to specific industrial inputs (IND).REESLGRef andREEBKRef refer to the concentra- tions of reference REEs in the sludge and in the background, which are assumed to be unaffected by specific industrial inputs. There- fore, the termREERefIND- reflecting the industrial contribution to the specific reference element - becomes zero. If a selected reference element is affected by industrial contributions - which occasionally will be the case as our approach is based on using the whole suit of REEs - the calculated background factions (fREEBK) will be larger than 1 pointing to an unsuitable choice of the reference element. Our full factorial approach results in 13 individual estimates (14 REEs minus the EoI) for every REE in all sewage sludge samples. The data are visualized using boxplots, where the central mark indicates the median, and the bottom and top edges of the box indicate the 25th and 75thpercentiles, respectively. The whiskers extend to the most extreme data points not considered as outliers, and the outliers are plotted individually using the’þ’symbol. Outliers are defined as values that deviate more than 1.5 times from the interquartile range (top or bottom of the box).
2.4.2. Calculations based on REE patternfitting
In the A2 approach, it is assumed that most of the REEs follow a background pattern, represented by the averaged REE pattern of the soils. The log10 transformed REE concentration values of the sewage sludge samples arefitted to the log10 transformed and averaged REE concentration values of the soil samples (back- ground) following equation(4) and (5).
REESLG¼f,REEBKε (eq 4)
X
REE
ε¼X
REE
ðREESLGf,REEBKÞ (eq 5)
REESLG refers to the concentration of specific REEs in individual sludge samples andREEBK refers to the average concentration of specific REEs in the background.frepresents the background frac- tion of REEs in the sewage sludge samples andεrepresents the difference between the calculated and the measured REE concen- trations in the individual sludge samples. The sum of the absolute values ofεover all REEs is minimized for each sewage sludge sample using the fminsearch routine in Matlab (R2019a). The obtained background fractionðfÞof REEs in the sewage sludge samples can be converted to linear scale according tofBK ¼10f. The difference (d, in log10 scale) between the measured and thefitted REE con- centrations of the sewage sludge samples can be assigned to the specific industrial input of individual REEs and the share of each REE related to specific industrial inputs can be calculated according tofIND¼110d, assuming that most of the REE are unaffected by industrial inputs of individual REE. Using log10 transformed REE concentration values, thefit of the REE patterns between the sludge and the background is only marginally affected by occasionally increased concentrations of individual REEs representing specific industrial inputs. WWTPs receiving substantial contributions of selected REEs were identified based on the same outlier criteria as used for the A1 approach.
3. Results and discussion
3.1. REE patterns of sludge and soil samples
The REE concentrations of the sludge samples and the medians thereof together with the average of the investigated soil samples and the PAAS concentrations, reflecting the average compositions of the Earth crust, are given inFig. 1A.The individual REE patterns of the soils are very similar to the REE pattern of the PAAS. Also, the HREE patterns of the sewage sludges were similar amongst each other and closely followed the REE patterns of the soils, although at consistently lower concentrations. This can be explained by vari- able inputs of unspecific REE loads having the same HREE patterns as the averaged soils and, thus, supports the hypothesis that the averaged REE pattern of the soils can be used as a proxy for the background pattern of the REEs in sewage sludge. This is in contrast to the LREEs, where the concentrations show considerable differ- ences and individual lines connecting neighboring REEs cross each other. Ce and La concentrations of selected sludge samples project even above the soil-REE patterns.
The considerable range in (L)REE concentrations in the sludge samples compared to the soil samples, essentially representing anomalies of specific REEs in the sludge, is highlighted by normalizing the data to the PAAS values (Fig. 1B). Individual spikes suggest an industrial contribution of individual REEs to the sludge, and Ce appears to have the highest share. Interestingly, a slight enrichment of the La concentrations (mean values) compared to the other normalized REEs can be observed.
3.2. Background and industrial fractions of individual REEs in sewage sludge
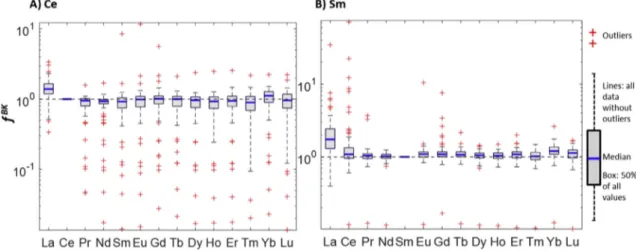
Based on REE ratios and using eq (2) and (3)(approach A1), background (fREEBK) and industrial (fREEIND) fractions contributing to the total amount of REE observed in the individual sludge samples were calculated. The resulting fractions are visualized as boxplots either with respect to the REEs used as reference elements or with respect to the WWTPs and will be discussed based on the cases of Ce (Figs. 2A and 3A) and Sm (Figs. 2B and 3B) as EoI. These two ele- ments were selected to represent REEs, which are used in high amounts (Ce) and moderate amounts (Sm).
3.2.1. Differences in the background and industrial fractions of Ce and Sm calculated using different reference REEs
When plotting the background fractions of Ce and Sm (fCe;BKSm) with respect to the individual reference elements (REEs on the x- axis) used for the calculations,fCe;BKSmclose to 1 suggests that the Ce and Sm contents in the sludge samples are dominated by inputs from the background. A fCe;BKSm lower than 1 indicates industrial inputs of Ce and Sm. An fCeBK;Sm larger than 1 indicates that the reference element rather than the EoI was affected by industrial contributions.
Cerium: The modal values offCeBKeindicated by the blue bars in the box plots and representing the majority of the WWTPseare close to 1 for almost all REEs used as reference elements (Fig. 2A), suggesting that the majority of the investigated WWTPs do not receive substantial amounts of Ce from industrial sources. The only exception is observed when La is used as reference element, leading to a modal value offCeBK above 1, suggesting that most WWTPs are affected by additional La inputs. This is consistent with the higher PAAS-normalized La values compared to all other REEs (Fig. 1B).
When Ce is used as reference element, its modal value must be 1 as in this case the reference element and the EoI coincide. Of interest are the outliers marked as red crosses below 1, indicating WWTPs that receive substantial amounts of Ce from industrial sources. The outliers above 1 are caused by our full factorial approach and represent sludge samples where the REE used as reference element contain substantial industrial inputs. The sludge from one WWTP (location Visp) consistently resulted in fCeBK larger than 1. This WWTP mainly treats industrial wastewater, which may be depleted in Ce and thus resulting in Ce-depleted sewage sludge (Figure S5).
This would explain the highfCeBK when Ce is used as EoI. Alterna- tively, an unusual REE signature of the soil exhibiting a strong Ce depletion may also explain the REE pattern in the sludge. However, the REE pattern of a soil collected within the catchment area of this WWTP nicely aligns with the other soil REE patterns (Figure S5).
We, thus, consider industrial processes resulting in either i) the selective removal of Ce from the wastewater before Ce is incorpo- rated into the sludge or ii) higher amounts of Ce passing the WWTP as more likely.
Samarium: For Sm, the modal values offSmNATalso scatter around 1 and only the values calculated when using La as a reference element are significantly larger than 1 (Fig. 2B). This observation is in agreement with the data discussed for Ce and again suggests that most WWTPs receive La from additional sources. La, thus, cannot be used as a reference element to quantifyfREEBK andfREEIND in sewage sludge. A single outlier below the modal values offSmBK can consis- tently be observed when using any of the other REE as reference elements. This outlier represents a specific WWTP (location Windisch) where the industrial inputs of Sm dominate over the background contributions. Several outliers are located above 1 Fig. 1. (A)REE patterns of the Post-Archean Australian Shale (PAAS, (Pourmand et al.,
2012), green), the average of 10 soil samples collected across Switzerland (brown dashed), and the sludge samples (colored). The individual values of the soil samples are displayed as black circles and the median values of the sludge samples are given in red circles. The vertical dashed line separates the light REEs (LREEs) from the heavy REEs (HREEs).(B)PAASenormalized REE ([REEsludge, soil]/[REEPAAS]) patterns of the average soil (bold brown) and the individual sludge samples (colored). The median values of the normalized REE values of the sludge samples are given in red circles. (For interpretation of the references to color in thisfigure legend, the reader is referred to the Web version of this article.)
Fig. 2. Background fractions of Ce(A)and Sm(B)for all 63 WWTPs calculated based on the REE ratio between these elements and all other REEs (approach A1, see section2.3). The individual boxplots reflect the REE-specific differences of the calculatedfCe;BKSmfor the 63 WWTPs. The outliers below 1, marked as red crosses, represent WWTPs receiving sub- stantial fractions of industrial Ce(A)and Sm(B). The black dashed lines are visiual guides for fractions of 1. (For interpretation of the references to color in thisfigure legend, the reader is referred to the Web version of this article.)
Fig. 3.Background fractions of Ce(A)and Sm(B)for all 63 WWTPs (locations with decreasing connected population equivalents are indicated along the x-axis from left to right) calculated based on the REE ratio between these elements and all other REEs (approach A1, see section2.3). The individual boxplots (seeFig. 2and the Materials and Methods section for the definition of the boxplots) reflect the WWTP-specifc differences of the calculatedfCe;BKSmfor the different REEs used as reference elements. The modal values (blue bars in the boxes) below 1 indicate WWTPs receiving substantial fractions of Ce(A)and Sm(B). The dashed horizontal lines are visiual guides for fractions of 1. (For interpretation of the references to color in thisfigure legend, the reader is referred to the Web version of this article.)
when Ce is used as a reference element to calculatefSmBK(Sm as EoI).
This is consistent with the fact that we previously identified in- dustrial Ce in sewage sludge from several WWTPs, when using Ce as an EoI (Fig. 2A). This industrial Ce input distorted the background contributions and resulted in‘artificially’highfSmBK exceeding 1. In addition, several outliers above 1 were observed when Gd was used as a reference element, suggesting that also numerous WWTPs receive industrial Gd. This is in line with reports where positive Gd anomalies have been associated with Gd used in contrast agents for MRI (Bau and Dulski, 1996;Klaver et al., 2014;Kovalova et al., 2013;
Kümmerer and Helmers, 2000) and will be discussed in more detail in section3.5.
3.2.2. Differences in the background and industrial Ce and Sm fractions calculated for individual WWTPs
When rearranging the data along the different WWTPs instead of along the different REEs used as reference elements (Fig. 3A and B), modal values of fCeBK;Sm below 1 (blue horizontal lines in the boxes) indicate that the respective WWTPs receive substantial amounts of industrial Ce and Sm. It is important to note that the modal values offCeBK;Smare estimated based on the ratios between Ce/Sm and all other REEs. For better visibility, and based on the reason discussed above, the largest outliers (above 1) have been omitted inFig. 3A and B. Furthermore, La was excluded as reference element as it has been identified as unsuitable for this purpose in the above discussions. In the boxplots, also the EoI was excluded as a reference element to avoid the situation of using for example Ce as reference and as EoI, which would by definition result infCe;BKSmof 1 (see eq(1)).
For Ce (Fig. 3A), the modal values forfCeBKof a few WWTPs are substantially below 1 suggesting that the amounts of Ce in the respective WWTP are affected by industrial inputs. Only for one WWTP, the modal values project substantially above 1. It is the same WWTP (location Visp) already identified previously based on the outliers above 1 consistently observed for all REEs used as reference REE (Fig. 2A).
For Sm (Fig. 3B), the modal values offSmBKof all but of one WWTP (location Windisch) are close to 1. Thus, Sm seems to be used and released to the wastewater systems only very locally. The low modal value offSmBKfor this specific WWTP is reflected in the outliers close to the bottom ofFig. 2B.
3.2.3. Differences in the background and industrial fractions of all REEs in all WWTPs
The calculations of thefCe;BKSmindividually discussed for Ce and Sm are extended to include all REEs as EoI and are summarized in the form of boxplots, presented inFig. 4. The boxplots represent the modal values offREEBK for the different WWTPs based on all REEs and the outliers below 1 indicate WWTPs that receive substantial fractions of the respective REEs from specific industrial sources.
The boxplot for La is very different to the boxplots of the other REEs and shows a modal value around 0.6 forfLaBK. Furthermore, the individual values offLaBKshow large variations. This means that most WWTPs apparently receive substantial and very diverse amounts of La from additional sources. For all other REEs, the modal values of fREEBK scatter around 1, with the exception of a few WWTPs which receive substantial amounts of specific REEs, most prominently Ce and Gd.
The reason for the unexpected occurrence La is not clear, but would imply that industrial La is almost omnipresent in WWTPs. La is used in hybrid engines, metal alloys and also various applications in thefield of catalysis (Haque et al., 2014). However, emissions from such applications are less likely to end up in wastewater streams and the emission from possible production facilities would rather result in high input rates to a few selected WWTPs.
Furthermore, La is commonly found inflints for cigarette lighters representing a pervasive application of La (Behrsing et al., 2014;
Haque et al., 2014). However, in this application, La is contained in a mischmetal, which contains twice as much Ce compared to La (Behrsing et al., 2014) and respective emissions would go parallel with Ce. Alternatively, selected soil fertilizers show strong enrich- ments of La compared to other REEs (Otero et al., 2005; Ramos et al., 2016). A contribution from such fertilizers to the waste- water through agricultural runoff may therefore modify the REE patterns in the sludge and help to explain the elevated La con- centrations observed in the sludge samples. Furthermore, biolog- ical processes within the WWTPs may fractionate La and, thus, modify the REE patterns of the sewage sludge. For example, LREE- dependent enzymes required for the methanol metabolism have been discovered in methylotrophic bacteria about a decade ago (Cotruvo, 2019;Hibi et al., 2011;Nakagawa et al., 2012; L.L. Wang et al., 2020). More recently,X. Wang et al. (2020)identified meth- anotrophic bacteria whose enzymatic activities are strongly dependent on the La availability. To what extent biological pro- cesses or fertilizer inputs into the wastewater are responsible for the high industrial fraction of La calculated for the sewage sludge samples remains open and needs to be addressed in future studies.
3.3. Industrial contributions of specific REEs in specific WWTPs
The quantified industrial fractions for the individual REEs and for each of the 63 WWTPs derived from approach A1 are presented as a heat map (Fig. 5), which allows an easy identification of WWTPs that receive substantial amounts of industrial REEs. Sig- nificant industrial fractions of specific REEs in individual WWTPs are identified as outliers and are projected in grey scale in the heat map. This heat map clearly shows that only a small number of WWTPs receive substantial amounts of industrial REEs. A special case again is La as discussed above. The fact that industrial fractions Fig. 4.Boxplots of the modal values of thefREEBK calculated for 63 WWTPs based on all
REEs. The individual boxplots reflect the REE-specific differences of the calculated modalfREEBKfor the 63 WWTPs. To estimate modal values of thefREEBKfor each WWTP, the whole suite of REEs was considered. The outliers below 1 represent WWTPs that receive substantial fractions of the respective REEs from industrial sources. A modal value around 1 indicates that the REE concentrations in the WWTPs are dominated by inputs from background sources (fREEBK). The dashed line is a visual guide for fractions of 1.
of La scatter around 0.4 (background contribution of around 0.6) and show a very broad distribution, results in large interquartile ranges without the identification of any outliers. For the remaining REEs, Ce is most important in terms of the number of WWTPs receiving industrial inputs (7 WWTPs), followed by Gd (5 WWTPs).
High shares for Sm and Eu from industrial sources were detected in a single WWTP each. These data generally support the hypothesis that REEs are used in rather specialized applications and their release to the wastewater reflects individual point sources. These results are in line with for example industrial Sm detected in the river Rhine, which was assigned to a single cracking-catalyst pro- duction facility (Kulaksız and Bau, 2013). Within a massflow study addressing the role of different sewer systems controlling the amount of engineered nanomaterials discharged to the environ- ment via stormwater runoff,Zheng et al. (2019)assigned the ma- jority of CeO2-NP discharged to wastewater systems to industrial discharges. CeO2-NP are used as polishing agents for glass and sil- icon, which limits the discharge to a few hotspots.Westerhoff et al.
(2015) concluded that the share of industrial sources of REEs is small and nearly negligible compared to the crustal input. On average, this is certainly true, but, as demonstrated by our data, the input of specific REEs to individual WWTPs can be dominated by industrial (point) sources.
3.4. Comparison of the results from the two model approaches (REE ratio vs. REE patternfitting)
To compare the results of the REE ratio (A1) and the pattern fitting (A2) approaches to estimate the industrial fractionsðfREEINDÞof the REEs in sewage sludge, the same heat map as shown inFig. 5 based on A1 is constructed using A2 (Figure S6). Both heat maps are very similar, reflected by the marginal differences of the two heat maps (Figure S7). Based on both approaches, essentially the same WWTP receiving substantial amounts of specific REEs were identified. Minor differences in the absolute industrial fractions were mostly around 5e10% and may be explained by slight varia- tions of the REE patterns of the soils.
The results discussed so far were addressing industrial and background fractions of REEs in individual WWTPs. These relative industrial/background fractions can be transformed into absolute masses using the sludge production rates of the individual WWTPs and are discussed in the following section. As both approaches to estimate the industrial/background fractions of REE in sewage sludge produced almost identical results, the following discussions are independent of the calculation method.
3.5. Mass-based industrial contributions of REE to sewage sludge
The mass-based contributions of individual REEs to the sewage sludge from individual WWTPs were calculated by multiplying the industrial REE fractions with the measured concentrations and the annual sludge production (digested sludge, dry mass basis, Table S3). Ce, and considerably lower amounts of Sm, Eu and Gd dominate the annual, industrial REE loads scaled to Switzerland based on population equivalents (Fig. 6A). The data for La have to be treated with care, as explained in section3.3. In most WWTPs La from additional, possibly industrial sources were detected (modal values forfREEINDaround 0.4). However, based on our outlier criterion, no WWTPs were identified where the (industrial) La contributions (following both evaluation schemes A1 and A2) qualified as outliers.
Of the 63 investigated WWTPs, the locations of Yverdon, Bio- ggio, Hofen and Thal dominanted the total amount of REEs attrib- uted to specific industrial sources (Fig. 6B). The same pattern can be observed when looking at the loads of Ce from industrial sources, reflecting the dominat role of Ce in controlling the total amount of industrial REEs in sewage sludge (Figure S8A). In the case of Gd, one WWTP dominates the total amount of industrial Gd identified in all 63 WWTP (Figure S8B). These results only partially reflect the re- ports documenting industrial REEs in river waters from various locations. Industrial Ce (from the Loire river in Orleans and in the form of CeO2nanoparticles) has only been reported very recently (Phalyvong et al., 2020). Industrial Gd, however, has been observed in river water, lake water, coastal water, ground water and drinking Fig. 5.Heat map of thefREEINDfor the individual REEs and the specific WWTPs. Increasing industrial fractions are represented by an increasing darkness.
water (selected references are provided in the introduction) and the presence of Sm in river water (Rhine) has only been reported in one study (Kulaksız and Bau, 2013). This bias is related to the chemical speciation of the respective REEs in the waste- and surface waters and also to the different sample preparation procedures.
Most of the studies available in the literature targeted the dissolved fractions and, thus, most samples were filtered and often an ex- change resin was used to further enrich the dissolved REEs. Any REEs present in the particulate fraction would not have been detected using these preparation schemes. The low solubility products of REE3þ - phosphates (z10-25 (Firsching and Brune, 1991)) in combination with PO43-concentrations ofz10-9.5M (z 3*10-10M) calculated using the software code‘Spana’(version 2020 June-08) for a pH of 7.2 and a total orthophosphate - P concentra- tion of 3 mgL-1(100mM (Gujer, 2007)), results in a calculated REE3þ concentration of about 3*10-16M or 4.6*10-11mgL-1(calculated for Nd). Thus, we assume that the majority of the REEs are transported in particulate form in the wastewater and, thus, are efficiently accumulated in the sewage sludge. Nevertheless, future studies on selected WWTPs should also investigate the dissolved fraction of the REEs in the raw and treated wastewater to evaluate to what extent organic REE-complexes contribute to the totalflux of REEs in wastewater systems.
Gadolinium: The fact that (industrial) Gd is used in contrast agents in dissolved form as a stable and poorly sorbing chelate, limits its incorporation into the sewage sludge in WWTPs, where removal efficiencies in the order of 10 % have been reported (Telgmann et al., 2012).Kovalova et al. (2013)even reported lower removal efficiencies (<5%) in a membrane bioreactor and only
insignificant oxidation by ozonation and adsorption to activated carbon. In this study, we identified individual WWTPs with elevated Gd contents in the sewage sludge. Total amounts of in- dustrial Gd in the inflow and in the effluent of the 63 WWTPs were estimated based on the Gd concentrations in the sewage sludge and assuming 10% removal during the wastewater treatment. The re- sults indicate that in total,z110 kg of Gd are discharged annually to the 63 WWTPs and thereof,z100 kg are released to the surface waters and 11 kg Gd remain in the sludge. From these 11 kg, about 80% can be assigned to one single WWTP (9 kg estimated for the sludge in the WWTP of Ramsen) and would correspond to a discharge of 90 kg to the surface water. The WWTP of Ramsen is located in the northeastern part of Switzerland close to Lake Con- stance at the border between Switzerland and Germany. It treats the wastewater (amongst others) from the city of Singen (Ger- many), where a cancer center including MRI facilities is located (Hegau-Bodensee-Klinikum Singen). In addition, industrial facil- ities producing large amounts of Gd-based contrast agents are also located within the catchment of the WWTP of Ramsen. Thus, the Gd detected in this WWTP most probably is linked to the produc- tion and use of Gd-containing contrast agents.
Cerium: Compared to Gd, which occurs as a complex and thus shows a poor removal during the wastewater treatment, industrial Ce is expected to be present in the (nano) particulate phase, as suggested byGogos et al. (2020)andPhalyvong et al. (2020), and is thus removed much more efficiently during wastewater treatment.
Reported removal efficiencies for nanoscale particles generally exceed 95% (Georgantzopoulou et al., 2018;Kaegi et al., 2011;Ma et al., 2014; Westerhoff et al., 2011). The total amounts of Ce Fig. 6. (A)Annualfluxes of specific REEs calculated for Switzerland by scaling thefluxes according to population equivalents connected to the WWTPs.(B)WWTPs specificfluxes of the sum of all REEs. In both graphs, the industrial contributions are displayed as orange bars, the total (industrial and background) REEfluxes are given as blue bars. (For inter- pretation of the references to color in thisfigure legend, the reader is referred to the Web version of this article.)
found in the sludge of the investigated WWTPs which is related to industrial inputs amounts to ~1000 kg and is dominated by 4 WWTPs (located in Bioggio, Yverdon, Hofen and Thal) contributing to around 80% of the industrial Ce found in the sewage sludge from the 63 WWTPs. However, assuming an average removal efficiency of 95%, 1050 kg would be discharged annually to the WWTPs and thereof, 50 kg would be released to the aquatic environment. Thus, although much larger amounts of industrial Ce are discharged to individual WWTPs compared to Gd (1000 kg Ce vs. 110 kg Gd) the amount of Gd released to the surface waters is expected to be considerably higher (100 kg Gd vs. 50 kg Ce). Furthermore, the Ce particles in the effluent of the WWTP are expected to be present as heteroaggregates and may be incorporated into larger aggregates and eventually become integrated into the sediment. Industrial Gd, however, will be present in the dissolved form as a stable complex with limited removal from the water phase over time. Combined with the higher natural abundance of Ce compared to Gd, it is understandable that (industrial) Gd has been frequently reported in the surface waters, but (industrial) Ce not yet.
The annual discharge of CeO2-NP to sewer systems has recently been estimated for Germany (Giese et al., 2018) and values are around 28,000 kg year-1. Scaling these amounts to Switzerland based on population equivalents (83 mio in Germany vs. 8.6 mio in Switzerland) results in a value 2900 kg year-1 of CeO2-NP dis- charged to wastewater systems. When scaling the total amounts of industrial Ce in the investigated WWTPs (1000 kg year-1) to the whole of Switzerland based on population equivalents (4.6 mio considered in this study vs. 8.6 mio total in Switzerland in 2019), the integrated mass of Ce in sewage sludge in Switzerland amounts to 2000 kg year-1. Assuming a 95% removal efficiency and con- verting Ce to CeO2results in aflux of industrial Ce to sewer systems of 2600 kg year-1, in agreement with the value of 2900 kg year-1 obtained from the mass flow model study (Giese et al., 2018).
However, our data also indicate that discharge of industrial REEs from wastewater systems is dominated by a few WWTPs making the scale-up to discharge amounts across Switzerland challenging and the respective results should therefore be treated with great care.
4. Conclusions
The REE patterns from several soil samples were very similar and represent the background REE patterns observed in the sewage sludge. These patterns are distorted by inputs of specific REEs resulting from industrial sources. The extent of distortion of the REE patterns can be used to estimate the industrial contribution of in- dividual REEs in the sewage sludge. Very similar industrial fractions of specific REEs in sewage sludge were calculated based on REE ratios and on REE pattern fitting approaches. The deviations resulting from the two approaches were mostly < 5%. Both ap- proaches include the whole suite of REEs and do not require prior knowledge on which (industrial) REEs are present in the sludge.
Digested sewage sludge with a typical hydraulic retention time of 12e16 days in anaerobic digesters integrates REE inputs over an extended period of time and is thus less susceptible to short-term variations of the influent concentrations. We showed that the fluxes of industrial REEs in Swiss sewage sludges are dominated by a few WWTPs, implying that point sources rather than diffuse sources control the amounts of industrial REEs discharged to WWTPs. In future studies it may, thus, be most rewarding to identify industrial facilities processing specific REEs and then including WWTPs from the respective catchments. The impact of different treatment steps (e.g., primary clarification, activated sludge treatment) on the REE concentration in wastewater streams of the respective WWTPs should be evaluated to get a better
understanding of how and in which forms REEs move through wastewater facilities. Based on the current dataset showing that several WWTPs receive substantial amounts of industrial Ce, it can be concluded that industrial Ce is likely the next REE that will be detected more frequently in surface waters or groundwater and/or in sediments downstream of selected WWTPs. Enrichments of Gd observed in selected sewage sludge samples were associated with the release of Gd-based contrast agents from hospitals and/or production facilities. La seems enriched in most of the WWTPs, but without showing clear outliers and therefore we could not assign the La enrichments to specific industrial inputs. Biological pro- cesses modifying the retention of La in WWTPs may help to explain the unexpectedly high apparent industrial fractions of La in sewage sludge. Alternatively, La contributions from diffuse sources, such as agricultural runoff of fertilizers with enriched La contents may additionally contribute to the La enrichments observed in the sewage sludge.
Apart from the poorly understood ecological consequences of the REE discharge to the environment, applications relying on stable REE background patterns may be challenged in the future.
For example, the use of REE patterns to study geochemical pro- cesses in natural waters (e.g., Elderfield and Greaves, 1982;
Johannesson et al., 2000; Sholkovitz, 1995; Smedley, 1991) may become increasingly difficult. Furthermore, it has been suggested to use REE patterns for a source apportionment of food products to warrant specific quality labels (Magdas et al., 2020). Also this approach may become limited, if for example sewage sludge enriched in specific (industrial) REEs is used as fertilizer in agri- culture. Our results, supported by other, previous reports on the occurrence of industrial REEs in surface waters, suggest that human activities can change the (background) REE patterns in (urban) environments and the increasing REE demand will further accen- tuate these changes.
Declaration of competing interest
The authors declare that they have no known competing financial interests or personal relationships that could have appeared to influence the work reported in this paper.
Acknowledgements
We sincerely thank all participating WWTP operators for providing samples and all Swiss Cantonal Environmental Offices for their support and involvement in this study. We are indebted to the Swiss Federal Office for the Environment for financial support (Grant No. 19.0011.PJ/483B2BA2E). We also kindly acknowledge Brian Sinnet and Matthias Philipp for their support in the labora- tory. Furthermore, we acknowledge Daniel W€achter (Agroscope, Switzerland) for the provision of the soil samples from the Swiss National Soil Monitoring Network (NABO).
Appendix A. Supplementary data
Supplementary data to this article can be found online at https://doi.org/10.1016/j.wroa.2021.100092.
References
Aries, S., Valladon, M., Polve, M., Dupre, B., 2000. A routine method for oxide and hydroxide interference corrections in ICP-MS chemical analysis of environ- mental and geological samples. Geostand. Newsl. 24, 19e31. https://doi.org/
10.1111/j.1751-908X.2000.tb00583.x.
Bau, M., 1991. Rare-earth element mobility during hydrothermal and metamorphic fluid-rock interaction and the significance of the oxidation state of europium.
Chem. Geol. 93, 219e230.https://doi.org/10.1016/0009-2541(91)90115-8.
Bau, M., Dulski, P., 1996. Anthropogenic origin of positive gadolinium anomalies in river waters. Earth Planet Sci. Lett. 143, 245e255.https://doi.org/10.1016/0012- 821X(96)00127-6.
Bau, M., Knappe, A., Dulski, P., 2006. Anthropogenic gadolinium as a micropollutant in river waters in Pennsylvania and in Lake Erie, northeastern United States.
Geochemistry 66, 143e152.https://doi.org/10.1016/j.chemer.2006.01.002.
Behrsing, T., Deacon, G.B., Junk, P.C., 2014. 1 - the chemistry of rare earth metals, compounds, and corrosion inhibitors. In: Forsyth, M., Hinton, B. (Eds.), Rare Earth-Based Corrosion Inhibitors. Woodhead Publishing, pp. 1e37.https://
doi.org/10.1533/9780857093585.1.
Celis, J.E., Espejo, W., Gonzalez-Acuna, D., 2020. Chemical elements of emerging technologies are being increasingly demanded worldwide: a possible menace for wildlife conservation? Anim. Conserv. 23, 3e6. https://doi.org/10.1111/
acv.12515.
Cobelo-García, A., Filella, M., Croot, P., Frazzoli, C., Du Laing, G., Ospina-Alvarez, N., Rauch, S., Salaun, P., Sch€afer, J., Zimmermann, S., 2015. COST action TD1407:
network on technology-critical elements (NOTICE)dfrom environmental pro- cesses to human health threats. Environ. Sci. Pollut. Res. 22, 15188e15194.
https://doi.org/10.1007/s11356-015-5221-0.
Connelly, N.G., Damhus, T., Hartshorn, R.M., Hutton, A.T., 2005. Nomenclature of Inorganic Chemistry. The Royal Society of Chemistry.
Cotruvo, J.A., 2019. The chemistry of lanthanides in biology: recent discoveries, emerging principles, and technological applications. ACS Cent. Sci. 5, 1496e1506.https://doi.org/10.1021/acscentsci.9b00642.
Dulski, P., 1994. Interferences of oxide, hydroxide and chloride analyte species in the determination of rare earth elements in geological samples by inductively coupled plasma-mass spectrometry. Fresenius’J. Anal. Chem. 350, 194e203.
https://doi.org/10.1007/BF00322470.
Elbaz-Poulichet, F., Seidel, J.-L., Othoniel, C., 2002. Occurrence of an anthropogenic gadolinium anomaly in river and coastal waters of Southern France. Water Res.
36, 1102e1105.https://doi.org/10.1016/S0043-1354(01)00370-0.
Elderfield, H., Greaves, M.J., 1982. The rare earth elements in seawater. Nature 296, 214e219.https://doi.org/10.1038/296214a0.
European Medicines Agency, 2017. EMA’s Final Opinion Confirms Restrictions on Use of Linear Gadolinium Agents in Body Scans.
Firsching, F.H., Brune, S.N., 1991. Solubility products of the trivalent rare-earth phosphates. J. Chem. Eng. Data 36, 93e95.https://doi.org/10.1021/je00001a028.
Georgantzopoulou, A., Carvalho, P.A., Vogelsang, C., Tilahun, M., Ndungu, K., Booth, A.M., Thomas, K.V., Macken, A., 2018. Ecotoxicological effects of trans- formed silver and titanium dioxide nanoparticles in the effluent from a lab- scale wastewater treatment system. Environ. Sci. Technol. 52, 9431e9441.
https://doi.org/10.1021/acs.est.8b01663.
Giese, B., Klaessig, F., Park, B., Kaegi, R., Steinfeldt, M., Wigger, H., Gleich, A., Gottschalk, F., 2018. Risks, release and concentrations of engineered nano- material in the environment. Sci. Rep. 8, 1565.https://doi.org/10.1038/s41598- 018-19275-4.
Gogos, A., Wielinski, J., Voegelin, A., von der, Kammer F., Kaegi, R., 2020. Quantifi- cation of anthropogenic and geogenic Ce in sewage sludge based on Ce oxidation state and rare earth element patterns. Water Res. X 9, 100059.https://
doi.org/10.1016/j.wroa.2020.100059.
Goldstein, S.J., Jacobsen, S.B., 1988. Rare earth elements in river waters. Earth Planet Sci. Lett. 89, 35e47.https://doi.org/10.1016/0012-821X(88)90031-3.
Gujer, W., 2007. Siedlungswasserwirtschaft, third ed. Springer-Verlag, Berlin Hei- delberg.https://doi.org/10.1007/978-3-540-34330-1.
Gwenzi, W., Mangori, L., Danha, C., Chaukura, N., Dunjana, N., Sanganyado, E., 2018.
Sources, behaviour, and environmental and human health risks of high- technology rare earth elements as emerging contaminants. Sci. Total Environ.
636, 299e313.https://doi.org/10.1016/j.scitotenv.2018.04.235.
Haque, N., Hughes, A., Lim, S., Vernon, C., 2014. Rare earth elements: overview of mining, mineralogy, uses, sustainability and environmental impact. Resources 3, 614e635.https://doi.org/10.3390/resources3040614.
Hatje, V., Bruland, K.W., Flegal, A.R., 2016. Increases in anthropogenic gadolinium anomalies and rare earth element concentrations in san francisco Bay over a 20 Year record. Environ. Sci. Technol. 50, 4159e4168. https://doi.org/10.1021/
acs.est.5b04322.
Hibi, Y., Asai, K., Arafuka, H., Hamajima, M., Iwama, T., Kawai, K., 2011. Molecular structure of La3þ-induced methanol dehydrogenase-like protein in Methyl- obacterium radiotolerans. J. Biosci. Bioeng. 111, 547e549. https://doi.org/
10.1016/j.jbiosc.2010.12.017.
Hu, G., Lin, C., Yang, Q., Yan, Yu, Huang, H., Yu, R., Cui, J., Yan, Yan, 2019. Distribution and source appointment of rare earth elements in offshore sediments of Western Xiamen Bay, Southeast China. J. Geochem. Explor. 201, 31e39.https://
doi.org/10.1016/j.gexplo.2019.03.007.
Johannesson, K.H., Zhou, X., Guo, C., Stetzenbach, K.J., Hodge, V.F., 2000. Origin of rare earth element signatures in groundwaters of circumneutral pH from southern Nevada and eastern California, USA. Chem. Geol. 164, 239e257.
https://doi.org/10.1016/S0009-2541(99)00152-7.
Kaegi, R., Voegelin, A., Sinnet, B., Zuleeg, S., Hagendorfer, H., Burkhardt, M., Siegrist, H., 2011. Behavior of metallic silver nanoparticles in a pilot wastewater treatment plant. Environ. Sci. Technol. 49, 3902e3908.https://doi.org/10.1021/
es1041892.
Kawasaki, A., Kimura, R., Arai, S., 1998. Rare earth elements and other trace ele- ments in wastewater treatment sludges. Soil Sci. Plant Nutr. 44, 433e441.
https://doi.org/10.1080/00380768.1998.10414465.
Kidder, D.L., Krishnaswamy, R., Mapes, R.H., 2003. Elemental mobility in phosphatic
shales during concretion growth and implications for provenance analysis.
Chem. Geol. 198, 335e353.https://doi.org/10.1016/S0009-2541(03)00036-6.
Klaver, G., Verheul, M., Bakker, I., Petelet-Giraud, E., Negrel, P., 2014. Anthropogenic rare earth element in rivers: gadolinium and lanthanum. Partitioning between the dissolved and particulate phases in the rhine river and spatial propagation through the rhine-meuse delta (The Netherlands). Appl. Geochem. 47, 186e197.
https://doi.org/10.1016/j.apgeochem.2014.05.020.
Knappe, A., M€oller, P., Dulski, P., Pekdeger, A., 2005. Positive gadolinium anomaly in surface water and ground water of the urban area Berlin, Germany.
Geochemistry 65, 167e189.https://doi.org/10.1016/j.chemer.2004.08.004.
Kovalova, L., Siegrist, H., von Gunten, U., Eugster, J., Hagenbuch, M., Wittmer, A., Moser, R., McArdell, C.S., 2013. Elimination of micropollutants during post- treatment of hospital wastewater with powdered activated carbon, ozone, and UV. Environ. Sci. Technol. 47, 7899e7908. https://doi.org/10.1021/
es400708w.
Kulaksız, S., Bau, M., 2013. Anthropogenic dissolved and colloid/nanoparticle-bound samarium, lanthanum and gadolinium in the Rhine River and the impending destruction of the natural rare earth element distribution in rivers. Earth Planet Sci. Lett. 362, 43e50.https://doi.org/10.1016/j.epsl.2012.11.033.
Kulaksız, S., Bau, M., 2011. Rare earth elements in the Rhine River, Germany:first case of anthropogenic lanthanum as a dissolved microcontaminant in the hy- drosphere. Environ. Int. 37, 973e979. https://doi.org/10.1016/
j.envint.2011.02.018.
Kümmerer, K., Helmers, E., 2000. Hospital effluents as a source of gadolinium in the aquatic environment. Environ. Sci. Technol. 34, 573e577. https://doi.org/
10.1021/es990633h.
Lerat-Hardy, A., Coynel, A., Dutruch, L., Pereto, C., Bossy, C., Gil-Diaz, T., Capdeville, M.-J., Blanc, G., Sch€afer, J., 2019. Rare Earth Elementfluxes over 15 years into a major European Estuary (Garonne-Gironde, SW France): hospital effluents as a source of increasing gadolinium anomalies. Sci. Total Environ. 656, 409e420.https://doi.org/10.1016/j.scitotenv.2018.11.343.
Ma, R., Levard, C., Judy, J.D., Unrine, J.M., Durenkamp, M., Martin, B., Jefferson, B., Lowry, G.V., 2014. Fate of zinc oxide and silver nanoparticles in a pilot waste- water treatment plant and in processed biosolids. Environ. Sci. Technol. 48, 104e112.https://doi.org/10.1021/es403646x.
Magdas, D.A., Marincas, O., Cristea, G., Feher, I., Vedeanu, N., 2020. REEs - a possible tool for geographical origin assessment? Environ. Chem. 17, 148e157.https://
doi.org/10.1071/EN19163.
Mineral commodity summaries 2015 (Report), 2015. Mineral Commodity Sum- maries. Reston, VA.https://doi.org/10.3133/70140094.
M€oller, P., Morteani, G., Dulski, P., 2003. Anomalous gadolinium, cerium, and Yttrium contents in the adige and isarco river waters and in the water of their tributaries (provinces trento and bolzano/bozen, NE Italy). Acta Hydrochim.
Hydrobiol. 31, 225e239.https://doi.org/10.1002/aheh.200300492.
M€oller, P., Paces, T., Dulski, P., Morteani, G., 2002. Anthropogenic Gd in surface water, drainage system, and the water supply of the city of prague, Czech re- public. Environ. Sci. Technol. 36, 2387e2394. https://doi.org/10.1021/
es010235q.
Nakagawa, T., Mitsui, R., Tani, A., Sasa, K., Tashiro, S., Iwama, T., Hayakawa, T., Kawai, K., 2012. A catalytic role of XoxF1 as La3þ-dependent methanol dehy- drogenase in methylobacterium extorquens strain AM1. PloS One 7, e50480.
https://doi.org/10.1371/.pone.0050480.
Nkinahamira, F., Suanon, F., Chi, Q., Li, Y., Feng, M., Huang, X., Yu, C.-P., Sun, Q., 2019.
Occurrence, geochemical fractionation, and environmental risk assessment of major and trace elements in sewage sludge. J. Environ. Manag. 249, 109427.
https://doi.org/10.1016/j.jenvman.2019.109427. UNSP.
Otero, N., Vitoria, L., Soler, A., Canals, A., 2005. Fertiliser characterisation: major, trace and rare earth elements. Appl. Geochem. 20, 1473e1488.https://doi.org/
10.1016/j.apgeochem.2005.04.002.
Parant, M., Perrat, E., Wagner, P., Rosin, C., Py, J.-S., Cossu-Leguille, C., 2018. Varia- tions of anthropogenic gadolinium in rivers close to waste water treatment plant discharges. Environ. Sci. Pollut. Res. 25, 36207e36222.https://doi.org/
10.1007/s11356-018-3489-6.
Phalyvong, K., Sivry, Y., Pauwels, H., Gelabert, A., Tharaud, M., Wille, G., Bourrat, X., Benedetti, M.F., 2020. Occurrence and origins of cerium dioxide and titanium dioxide nanoparticles in the Loire river (France) by single particle ICP-MS and FEG-SEM imaging. Front. Environ. Sci. 8 https://doi.org/10.3389/
fenvs.2020.00141.
Pourmand, A., Dauphas, N., Ireland, T.J., 2012. A novel extraction chromatography and MC-ICP-MS technique for rapid analysis of REE, Sc and Y: revising CI- chondrite and Post-Archean Australian Shale (PAAS) abundances. Chem. Geol.
291, 38e54.https://doi.org/10.1016/j.chemgeo.2011.08.011.
Rabiet, M., Brissaud, F., Seidel, J.L., Pistre, S., Elbaz-Poulichet, F., 2009. Positive gadolinium anomalies in wastewater treatment plant effluents and aquatic environment in the Herault watershed (South France). Chemosphere 75, 1057e1064.https://doi.org/10.1016/j.chemosphere.2009.01.036.
Ramos, S.J., Dinali, G.S., Oliveira, C., Martins, G.C., Moreira, C.G., Siqueira, J.O., Guilherme, L.R.G., 2016. Rare earth elements in the soil environment. Curr.
Pollution Rep. 2, 28e50.https://doi.org/10.1007/s40726-016-0026-4.
Sholkovitz, E.R., 1995. The aquatic chemistry of rare earth elements in rivers and estuaries. Aquat. Geochem. 1, 1e34.https://doi.org/10.1007/BF01025229.
Sinha, S.P. (Ed.), 1983. Systematics and the Properties of the Lanthanides, Nato Science Series C: Springer Netherlands. https://doi.org/10.1007/978-94-009- 7175-2.
Smedley, P.L., 1991. The geochemistry of rare earth elements in groundwater from