Adaptive potential of Baltic three-spined stickleback (Gasterosteus aculeatus) to
simulated climate change: analyzing transgenerational effects
Talisa Döring
talisa.doering@fu-berlin.de 4758310
Submitted for the Attainment of the Academic Degree of Bachelor of Science
First examiner: Prof. Dr. Thorsten B. Reusch,
GEOMAR Helmholtz Zentrum für Ozeanforschung Kiel Second examiner: Prof. Dr. Jens Rolff, Freie Universität Berlin
October 2016
Institute of Biology, Freie Universität Berlin
Selbstständigkeitserklärung
Name:
(Nur Block- oder Maschinenschrift verwenden.) Vorname:
geb.am:
Matr.Nr.:
Ich erkläre gegenüber der Freien Universität Berlin, dass ich die vorliegende ___________________________ selbstständig und ohne Benutzung anderer als der angegebenen Quellen und Hilfsmittel angefertigt habe.
Die vorliegende Arbeit ist frei von Plagiaten. Alle Ausführungen, die wörtlich oder inhaltlich aus anderen Schriften entnommen sind, habe ich als solche kenntlich gemacht.
Diese Arbeit wurde in gleicher oder ähnlicher Form noch bei keiner anderen Universität als Prüfungsleistung eingereicht und ist auch noch nicht veröffentlicht.
Datum: _________________ Unterschrift: __________________________
(____________________)
Outline
1. Introduction ... 1
2. Methods ... 4
2.1 Experimental design and crossings ... 4
2.2 In vitro fertilization ... 8
2.3 Measurements of life-history traits ... 9
2.3.1 Parents body size, mortality and reproductive condition at 14 months post hatchpost hatch ... 9
2.3.2 Early life survival of the offspring ... 9
2.3.2.1 Eggs 5 days post fertilization ... 9
2.3.2.2 Larvae 8 days post fertilization ... 10
2.3.3 Offspring body size, mortality and maturity ... 10
2.3.3.1 Larvae 12 days post hatch ... 10
2.3.3.2 30 days post hatch ... 11
2.3.3.3 3 months post hatch ... 11
2.4 Data analysis... 11
3. Results ... 13
3.1 Parents body size, mortality and reproductive condition ... 13
3.2 Early life survival of the offspring ... 15
3.2.1 Fertilization success ... 15
3.2.1.1 Subset pPSU 6 vs. pPSU 20 ... 15
3.2.1.2 Subset pPSU 20 vs. pPSU 33 ... 15
3.2.2 Hatching success ... 16
3.2.2.1 Subset pPSU 6 vs. pPSU 20 ... 16
3.2.2.2 Subset pPSU 20 vs. pPSU 33 ... 17
3.2.3 Ratio yolk sac size/length of larvae at 8 dpf ... 18
3.2.3.1 Subset pPSU 6 vs. pPSU 20 ... 18
3.2.3.2 Subset pPSU 20 vs. pPSU 33 ... 18
3.3 Offspring body size and maturity ... 19
3.3.1 Weight ... 19
3.3.1.1 Subset pPSU 6 vs. pPSU 20 ... 19
3.3.1.2 Subset pPSU 20 vs. pPSU 33 ... 19
3.3.2 Development of the sexual organs ... 22
4. Discussion ... 23
4.1 Parents body size and mortality ... 23
4.2 Parental effects on early life survival of the offspring: fertilization and hatching suc hatching success ... 23
4.2.1 Within-generational effects on offspring early life survival ... 24
4.3 Reproductive condition of the parents – parental provisioning against expected streexpected stress ... 25
4.3.1 Yolk sac size/length ratio of the larvae ... 26
4.4 Parental effects on offspring quality ... 27
4.5 Switch in reproductive strategy causing transgenerational effects ... 29
5. Conclusion ... 30
6. References ... 32
7. Acknowledgements ... 36
1
1. Introduction
Research on the impacts of global change on the oceans are of prime interest as marine ecosystems are threatened by ongoing changes such as increasing sea temperatures, ocean acidification and changing salinity levels ((IPCC), 2013, Levin, 2003, Przeslawski, 2015, Meier, 2006, Foo & Byrne, 2016). Sea temperature increases are caused by the emission of CO2 and other greenhouse gases which enhanced the greenhouse gas effect ((IPCC), 2013). As the oceans directly dissolute nearly 40% of CO2 emissions, the mean pH of the surface water decreased (Rhein, 2013, (IPCC), 2013). The salinity of the ocean surface is also decreasing, largely due to the addition of freshwater caused by increasing precipitation (minus evaporation) and sea-ice melting (Lee, Tong, Millero et al., 2006, Wong, Bindoff & Church, 1999).
These global changes are for instance shifting distribution of marine fish and are affecting marine species’ physiology (Perry, Low, Ellis et al., 2005, Somero, 2010, Reusch, 2013). Acting as an evolutionary force, these environmental changes will also affect the composition of marine communities and ecosystems through selection (Hoffmann & Merila, 1999). Climate change is therefore threatening biodiversity, as species might not be able to adapt to the changes occurring in their environment (Visser, 2008).
An environment that represents a suitable model for studies on the consequences of climate change on the adaptive potential of marine species is the Baltic Sea region.
As it has already changed from oligotrophic to eutrophic systems due to anthropogenic environmental change, it exhibits features of an environment where predicted changes are already occurring (Meier, Muller-Karulis, Andersson et al., 2012). For the Baltic Sea there are more drastic changes predicted like a significant salinity decrease up to 50% by 2070 (Meier, 2006). This decrease in salinity will be primarily due to the negative interaction of the limited water exchange with the world oceans and the increase in freshwater run-off from the watershed of the Baltic Proper (Vuorinen, Hanninen, Viitasalo et al., 1998, Meier, Kjellstrom & Graham, 2006).
Another cause for this decrease will be the warmer climate which will induce an increase in precipitation in most areas of the Baltic Sea (Kjellstrom & Ruosteenoja, 2007).
Consequently, the decrease in salinity in the Baltic Sea will affect marine species considerably. In particular, salinity and osmoregulatory performance limits play an
2
important role in species distribution as salinity gradients and species distribution patterns often overlap (Larsen, Nielsen, Williams et al., 2008). Since salinity affects osmoregulation, the decrease will affect the survival of marine species. The main challenge of osmoregulation is ionregulation. It needs to be constantly active to avoid apoptosis due to depolarized cells, and is in this way very energetically costly (Rolfe
& Brown, 1997, Kroemer, Petit, Zamzami et al., 1995). As both survival and distribution of marine species are dependent on salinity, it represents one important abiotic driver for marine evolution.
In a changing ocean like the Baltic Sea, populations need to be able to adapt rapidly enough to avoid extinction (Visser, 2008). In order to make predictions about the biological impacts of climate change, it is critical to understand the adaptive potential of species (Donelson, Munday, McCormick et al., 2012). The adaptive potential of a species can be defined as a capacity to react to an environmental change by altering its genetic composition and/or its phenotypic expression (Lamy J-B.). In particular, the alteration of genetic variation takes place over selection processes and over several generations (adaption), but an adjustment to environmental changes without a change in the genes (acclimation) can occur rather quickly even within a generation (Foo et al., 2016, Whitman, 2009). For the latter, acclimation could involve phenotypic changes that occur based on a single genotype expressing a range of phenotypes, called phenotypic plasticity (Nicotra, Atkin, Bonser et al., 2010).
Plasticity can occur as reversible, developmental and transgenerational plasticity (Sunday, Calosi, Dupont et al., 2014). Reversible plasticity takes place over a certain time span, often within a life stage (Angilletta, 2009). By contrast, developmental plasticity occurs when the performance in a later environment is improved by the exposure to a changed environment at early life stages (Scott & Johnston, 2012).
Finally, transgenerational plasticity includes non-genetic inheritance implying that offspring reaction norms are mainly a result of the environmental cues experienced by their parents prior to fertilization (Shama & Wegner, 2014b, Salinas & Munch, 2014). This type of plasticity occurs mainly through somatic, cytoplasmic, nutritional, or epigenetic transfer between generations (Bonduriansky, Crean & Day, 2011). In the case of global change, the advantage of transgenerational plasticity is that it can establish time to catch up to genetic adaption by priming offspring for an enhanced performance in a changed environment (Shama et al., 2014b, Sunday et al., 2014).
An outcome of transgenerational plasticity can be transgenerational effects (TGEs)
3
(Foo et al., 2016), which have the potential to defend populations from rapid environmental change by leading to environmental acclimatization between generations (Donelson et al., 2012, Shama et al., 2014b). One possible result of transgenerational effects could be pre-acclimated offspring which show traits correlated with enhanced fitness in environmental conditions similar to those experienced by their parents (Foo et al., 2016). In contrast, TGEs can also act non-adaptive (Schade, Clemmesen & Wegner, 2014). In the case of negative TGEs the fitness of a generation is reduced due to environmental stress experienced by previous generations (Mousseau & Fox, 1998). Although TGEs have the potential to change evolutionary predictions, they could be energetically costly which could affect the fitness of the parents and their offspring (Angilletta, Wilson, Navas et al., 2003).
Several examples in the literature on transgenerational effects prove that there are non-genetic parental effects that can improve the response of marine species to increasing CO2 or temperature. However, a limited understanding exists regarding whether marine species are able to alter their phenotype over multiple generations in response to changing salinity in order to facilitate population persistence (Donelson et al., 2012, Shama et al., 2014b).
The three-spined stickleback (Gasterosteus aculeatus) is known for its high level of phenotypic plasticity and potential to adapt to environmental stress as it occurs in a wide range of habitats (Schade et al., 2014). This can be underlined by being the three-spined stickleback’s ability to be highly tolerant to changes in temperature and water chemistry (Östlund-Nilsson S., 2006, Schade et al., 2014). Studying highly phenotypical plastic species like the three-spined stickleback is advantageous for identifying transgenerational plasticity. Considering that this study on non-genetic inheritance mechanisms involves the analysis of phenotypic responses of early life stages which are considered to be especially vulnerable to environmental stress (Przeslawski, 2015), it emphasizes the importance of focusing on a highly phenotypical plastic model species. Since species with low levels of phenotypic plasticity might show high mortality rates at early life stages, it might be more difficult to distinguish effects of transgenerational plasticity from selection effects. Therefore, the three-spined stickleback represents a suitable model organism for this study, which focuses on identifying non-genetic inheritance mechanisms. As the three- spined stickleback is a euryhaline species, it is able to experience fluctuations in salinity over its lifetime (Fryxell, 2012). It has often been a model species in
4
evolutionary contexts, being known as an example of convergent evolution (Bell, 1994). This comprised the independent colonization of freshwater habitats of the northern hemispheres which, among other changes resulted in parallel adaption of their spines and plates (Bell, 1994). Moreover, the three-spined stickleback will be directly affected by the predicted decrease in salinity as it resides in the Baltic Sea.
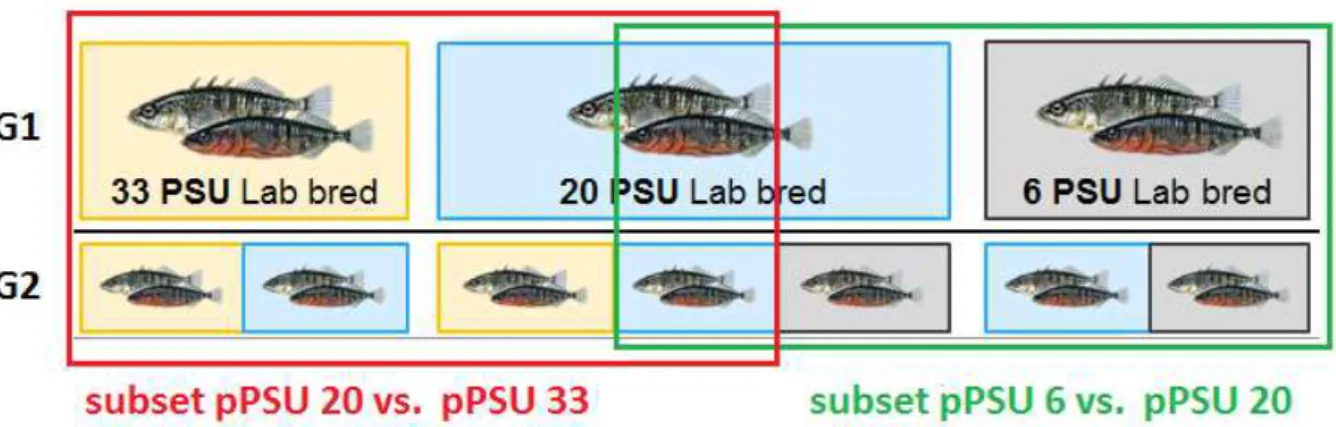
In this study, it was tested whether simulated salinity changes lead to transgenerational effects across two generations of a brackish population of three- spined sticklebacks. Salinity was measured in unit of Practical Salinity Unit (PSU), which describes the ionic salt concentration in sea water. In particular, parental (G1) and offspring (G2) sticklebacks originating from Kiel (20 PSU) were acclimated to ambient (20 PSU), higher (33 PSU) and lower (6 PSU) salinity levels. These levels were selected based on three possible future scenarios for marine sticklebacks located in the Baltic Sea: firstly, staying at the same location which would imply a salinity decrease (6 PSU); secondly, migrating with the same level of salinity (20 PSU); and finally, migrating out of the Baltic Sea because areas of 20 PSU will become narrow (33 PSU). In the study, parents were exposed to the different levels of salinity during reproductive conditioning and offspring was exposed to the different treatments from fertilization on. Having parents and offspring acclimated to the respective levels of salinity (Figure 2.1), enabled the analysis whether the fitness of the offspring in a changing environment is influenced by transgenerational effects when their parents experienced a similar environment. The phenotypic response of the offspring was assessed by considering fitness proxy.
2. Methods
2.1 Experimental design and crossings
The model organism for this study was the marine three-spined stickleback Gasterosteus aculeatus that belongs to the family of Gasterosteidae and is in the order of Gasterosteiformes.
The three-spined sticklebacks used in this study were provided by the project
“BONUS BAMBI” which was funded by the EU and BMBF. Grandparental adult marine three-spined sticklebacks (G0) were caught close to Kiel (Stickenhörn, 54°22’60” N, 10°10’0” E). These sticklebacks, which originated from a region with a
5
salinity level of approximately 20 PSU, were brought to the laboratory and held for 7 months.
The parental three-spined sticklebacks (G1) were obtained by crossing 10 pairs of wild grandparental sticklebacks, resulting in 10 different families of G1. When G1 hatched in February 2015, 30 individuals of each of the 10 families were divided into three groups of 10 individuals. Every group of 10 fish was kept in 20-L aquaria connected to a filter tank of either 120-L or 280-L, which contained an oxygen stone and water with a salinity of 20 PSU. Three climate chambers ensured the same climatic conditions were maintained. These climate chambers contained three filter tanks each, which were connected to the aquaria. G1 was reared in 20 PSU until they reached adulthood in October 2015. After this non-treatment period of 9 months, which ensured synchronism in growth at their developing age, the three groups per family were introduced into one treatment, each respectively containing one of three levels of salinity: 6, 20 and 33 PSU. This design ensured that each family of G1 was treated with all of the three different levels of salinity (Figure 1) which provided the same genetic background in each treatment. Acclimation from 20 PSU to their respective treatment was conducted within 10 days by changing +/- 3 PSU every second day. G1 was treated for 5 months until mid-April 2016.
Figure 1 Breeding design and treatment design of wild caught (G0) and lab bred (G1&G2) three-spined sticklebacks from Kiel (20 PSU). The first generation (G0) is not treated, the second generation (G1) is treated from the adult stage on and the third generation (G2) is introduced to a respective salinity upon fertilization. © 2016 Melanie Heckwolf
To achieve the exact level of salinity for each treatment, water from the north-sea was mixed with freshwater or blended salt water respectively and measured with a
6
salinometer. Henceforward each of the three utilized climate chambers contained one filter tank per treatment.
During the non-treatment period of 9 months, G1 was held in summer conditions of 18°C and a light period of 7 A.M. to 9 P.M. and at the beginning of the treatment period of 5 months G1 was held in autumn conditions of 12°C and a light period from 8 A.M. to 7 P.M for two weeks. After these two weeks G1 was held in winter conditions of a temperature of 6 °C and daily light from 9 A.M to 5 P.M. To guarantee synchronism of the ripeness of males and females of G1 for further crossings we changed to spring conditions with a temperature of 12 °C and a light period of 8 A.M.
to 7 P.M. at the beginning of March 2016. After two weeks of spring conditions we changed to summer conditions of 18°C and a light period of 7 A.M. to 9 P.M.
Pure crosses of G1 were performed within acclimation salinities over a ten day period in mid-April 2016 to produce three groups of G2 by crossing the following: 6 PSU male x 6 PSU female, 20 PSU male x 20 PSU female, 33 PSU male x 33 PSU female (Figure 2). To ensure the same conditions among all groups of parental salinity we conducted in vitro fertilization. Producing these crosses of parents acclimated to the same salinity, allowed the identification of the impact of the parental environment on the offspring. Since there were had 10 families of G1, it was initially planned to get 5 crossings of one individual from one family. Presented with the opportunity of having space for more than 5 crosses in the climate chambers, we decided to take 6 crossings to increase the sample size. The sixth crossing was performed with two individuals of a family used for a previous crossing, but in a new combination of families (Figure 2).
Offspring sticklebacks (G2) were separated into different treatments according to the saline environment of their parents (Figure 1): if G1 was from an environment of 6 PSU, G2 was divided into treatments of 6 and 20 PSU; if the parents were from 20 PSU, G2 was divided into treatments of 6, 20 and 33 PSU; and if the parents were from 33 PSU, G2 was divided into 20 and 33 PSU. Offspring of parents from 6 PSU and 33 PSU were brought to the respective salinity of their parents and into 20 PSU each to obtain control groups. Offspring of parents exposed to 20 PSU were brought to the salinity of their parents and to 06 and 33 PSU to get control groups for offspring of parents from 06 and 33 PSU. By exposing the offspring to different saline treatments according to the saline environment of their parents, it was possible to
7
investigate interaction effects between the parental and offspring salinity. No full factorial design was needed since this design ensured the analysis of the interaction of the parental and offspring treatment. Having three groups of parental salinity multiplied by six crossings resulted in 18 families of G2 (Figure 2).
Figure 2 crossing scheme of G2. Crossings 1 to 9 of G2 were performed with one individual of G1 per treatment per family. Crossings 13 to 18 were performed with one individual of a family which was used twice but in combination with another family. The crossings resulted in 18 families of G2.
After conducting in vitro fertilization, each treatment group per family was held in a glass bowl containing an oxygen stone and water based on their respective saline treatment. These glass bowls containing the eggs of G2 were collocated in a room with a temperature of approximately 18°C and water was exchanged every day (80%
of the total volume). After hatching at 8 days post fertilization (dpf), each treatment group per family was transferred into a 20-L aquarium connected to a filter tank of either 120-L or 280-L, which each contained an oxygen stone and water with the salinity of their respective treatment. At 12 days post hatch (dph) the amount of individuals per aquarium was randomly reduced to 16. At 30 dph the amount of individuals per aquarium was reduced to 10. Since G2 was transferred to the three climate chambers it was held in summer conditions. The study was completed after 3 months post hatch (mph).
Throughout the study, sticklebacks younger than 20 dph were fed twice a day with Artemia sp. larvae ad libitum, afterwards they were fed daily with red plankton and
8
copepods ad libitum until they were 90 days old. Later they were fed with bloodworm ad libitum.
2.2 In vitro fertilization
Prior to fertilization, a male and a female were chosen for fertilization according to the crossing scheme and their ripeness. Ripe males were assessed by their red colored throat which is considered to be nuptial coloration (Rowland, 1989). Ripe females were initially assessed by a swollen round abdomen containing their eggs.
In vitro fertilization was carried out by strip-spawning eggs of ripe females into a sloped Petri dish, which was subsequently covered with a cap. Females ready to spawn were assessed by squeezing them carefully until they easily released eggs. In detail, the fish was held carefully on the dorsal side and light pressure was applied with one finger on one ventral side of the female moving towards the pelvic fins. This led to a release of the eggs through the genital opening. After releasing the eggs, the females were placed into a small tank in the laboratory. To estimate the weight of the gonads, females were weighed before and after releasing the eggs. Females were handled first to ensure that they had ripe eggs prepared for fertilization prior to euthanizing a male.
After killing the males by immersing them in a solution of tricaine methanesulphonate (MS-222, 1g/L using water of their respective treatment), we removed the testes by dissection. Both testes were crushed with a pestle in a cell strainer over a small Petri dish containing 500 µL Hanks balanced salt solution (HBSS). To avoid squashing the sperm, the cell strainer was held over the small Petri dish without touching it.
Afterwards the sperm in the cell strainer were rinsed with 500 µl HBSS in the small Petri dish. The isotonic solution HBSS was used to maintain the sperm by maintaining the level of pH and the osmotic balance. The solution of sperm and HBSS was immediately applied to the eggs and incubated for 20 minutes in the sloped Petri dish. This ensured that all eggs were covered with the solution. The eggs of each crossing were then divided into three parts and transferred to separate glass bowls containing the water of their respective treatment. If only two treatment groups were needed according to the breeding design, one part of the eggs of each crossing was discarded. These glass bowls containing the eggs were then handled as described in 2.1. After fertilization the female was also killed in MS-222 and the life-history traits of both fish were measured according to 2.3.1.
9 2.3 Measurements of life-history traits
To get a better understanding of how the parental environment can induce TGEs in the offspring, the impacts of salinity increase or decrease on selected life-history traits of the parents (G1) and especially on early-life history traits of their offspring (G2) were investigated at different points in time.
2.3.1 Parents body size, mortality and reproductive condition at 14 months post hatch
All fish of G1 were sacrificed in MS-222 prior to taking measurements. Firstly, the weight of each euthanized fish (N=313) was taken to get an estimate for the body size of the parents. Reproductive condition was measured by weight of the gonads, which was taken from one female per treatment, per family (N=29). This included all female fish used for in vitro fertilization plus randomly chosen fish from the respective treatment. The weight of the gonads of the females used for fertilization was estimated by subtracting the weight of the female prior to and after the removal of the gonads. Gonad weight of females not used for fertilization was taken by dissecting the gonads of a euthanized female under a stereomicroscope and weighing them.
Having the weight of the gonads, the gonadosomatic index was calculated, which is often used as an indicator of the reproductive condition. The gonadosomatic index (GI) was calculated by using the following equation:
GI = (Gonad weight / whole body weight) *100
Additionally, the gender of every measured fish was taken. Males were assessed by the red coloration on their throats and females were assessed by a swollen round abdomen. Since we assessed the gender according to these criteria, the gender of a few fish was unidentifiable.
2.3.2 Early life survival of the offspring
2.3.2.1 Eggs 5 days post fertilization
After being reared for 5 days in the described glass bowls (2.1) the eggs reached the 21st stage of the embryonic development of the stickleback, which is the stage in which the pigment of the growing eye cups covers most of the lens and the heart is further developed and connected to the developed yolk sac (Swarup, 1958). During this stage, in which the eggs are more robust to being handled, we photographed each split clutch (treatment group per family) under a stereomicroscope (Leica MZ
10
9.5) for digital analysis of egg size and fertilization success. This measurement was taken as a trait of the reproductive condition of G1. The eggs were carefully placed in a small glass Petri dish containing their respective treatment water and were put back into the glass bowl directly after being photographed. The pictures were taken by using Image-Pro Insight software (Version 8.0, Copyright 2011 Media Cybernetics, Inc.). All eggs of a split clutch were photographed with a magnification of 1.6 and 1.0.
Fertilization success was estimated by the proportion of fertilized eggs in each split clutch (amount of fertilized eggs/total amount of eggs). Inspecting the pictures of each split clutch, fertilized eggs were identified and the total number of eggs was counted. Unfertilized eggs were assessed by no indication of polarity and by containing multiple oil globules (Swarup, 1958). Egg size was estimated as the diameter of 15 randomly chosen eggs from each split clutch (N=629) measured by using the point to point tool of the mentioned imaging software.
2.3.2.2 Larvae 8 days post fertilization
The offspring hatched at 8 dpf and was also photographed under the stereomicroscope by using the imaging software for digital analysis of the yolk sac size and the body size. 15 larvae per split clutch (N=613) were randomly chosen and placed in a small Petri dish containing the water of their respective treatment. All pictures were taken from the lateral site of the whole larvae with a magnification of 1.6. Body size was measured as standard length by using a polyline tool of the imaging software. Size of the yolk sac was estimated by measuring the area of the whole yolk sac with a polygon tool. At this point, all larvae were transferred from the glass bowls into the aquaria as mentioned in 2.2.
To get an estimate of the size of the yolk sac in relation to the size of the larvae, the ratio of the yolk sac size and the length of the larvae (yolk sac size/length) was taken.
2.3.3 Offspring body size, mortality and maturity
2.3.3.1 Larvae 12 days post hatch
At 12 dph, 10 larvae from each split clutch were randomly chosen (N=376) and euthanized in MS-222. Body size was measured by taking the weight of each larva.
Additionally, all larvae in the aquaria were counted to determine hatching success and density of fish in each aquarium. Hatching success was estimated by using the
11
number of larvae at 12 dph from each split clutch in relation to the number of eggs per split clutch (amount of larvae at 12 dph/ amount off eggs).
2.3.3.2 30 days post hatch
At the age of 30 dph offspring body size was again determined by taking body weight of 6 randomly selected fish per split clutch (N=224). All fish used for measurements were previously killed in MS-222 and 10 individuals were left in each aquarium containing one treatment group per family (one split clutch).
2.3.3.3 3 months post hatch
Total body size was again measured at 3 mph as body weight. Moreover, all fish (N=
416) were dissected under a stereomicroscope to determine gender and stage of development of sexual organs. The stage of the development of the sexual organs was considered as undeveloped when the sexual organs were unidentifiable or too small to state the gender with certainty. The study was completed at this stage, so all fish were used for these measurements.
2.4 Data analysis
Both data of the parents (G1) and the offspring (G2) were analyzed by using generalized linear mixed effect models (GLMMs) and linear mixed effect models (LMEs). If the data was significantly different from a normal distribution, which was tested by using a Shapiro-Wilk Test, GLMMs were used. If the data was normal distributed, LMEs were used. All analyses were conducted with the statistical environment R (R Development Core Team, 2011, Version 3.2.2). GLMMs were conducted by using the glmer function from the package ‘lme4’. LMEs were conducted by using the lmer function (model with multiple random factors) from the same package or by using the lme function (model with one random factor) from the package ‘nlme’. We reported p-values of GLMMs by using Wald Statistics and p- values of LMEs by performing an ANOVA of the respective model.
GLMMs and LMEs were used to quantify the effect of the salinity treatment of the parents (G1) on their physical condition (weight) and on traits related to their reproductive output like gonadosomatic index (GI), egg size, fertilization success and hatching success. Weight and GI were modeled with salinity treatment as fixed effect and climate chamber and family as separate random effects. Additionally, mortality of G1 was modeled using the same effects. Egg size, fertilization success and hatching
12
success were modeled using crossing as the only random effect, which includes information about the families of the parents used for each crossing. In most cases all models were fitted using the data from individual fish, except for using individual eggs for analyses of hatching success and using individual larvae and eggs for analyses of fertilization success.
Prior to setting up models for analyzing the data of the offspring (G2), plots were used to graphically visualize the effects of offspring, parental salinity and their interaction on all measured traits of the offspring. All plots were assessed by using the ‘ggplot’ function of the R package ‘ggplot2’. When all plots were considered, a general tendency became visible: offspring in 6 PSU with parental salinities of 6 and 20 PSU show positive effects while offspring in 33 PSU with parents from 20 and 33 PSU environments show negative effects on all of the measured traits of the offspring. Based on the prerequisite of having opposite effects in one dataset, it was decided to split up each dataset of one measured trait at one point in time into two subsets which function as new datasets (Figure 3). The first subset contained the parental salinity (pPSU) of 6 and 20 PSU, including each the offspring salinities (oPSU) of 6 and 20 PSU, which was called subset 6 pPSU vs. 20 pPSU (Figure 3).
The second subset, subset 20 pPSU vs. 33 pPSU, contained pPSU 33 and pPSU 20 including each oPSU 33 and 20 (Figure 3). The offspring salinity 20 PSU belonging to pPSU 20 was used in both subsets to provide a comparison of offspring salinities of 20 PSU between parental salinities to function as a control group (Figure 3). As the complete breeding design was not full factorial, a split up of the dataset enhanced a better statistical analysis of distinct effects.
Figure 3 split up of the dataset of all measured traits into two different subsets. Subset pPSU 20 vs. 33 contains the parental groups (G1) of 33 and 20 PSU which include each the offspring groups 20 and 33 PSU. Subset pPSU 6 vs. pPSU 20 contains the parental groups of 20 and 6 PSU including each of the offspring groups of 6 and 20 PSU.
13
GLMMs and LMEs were used to test for an effect of parental salinity, offspring salinity and an interaction effect. These effects were analyzed on traits related to the physical condition of the offspring like the ratio of the yolk sac size and the length of the larvae at 8 dpf, the weight of the offspring at 12 dph, 30 dph and 3 mph and the development of the sexual organs of the offspring at 3 mph. Each of these traits was split up into two subsets as described before, and was therefore handled as two independent datasets. In all models of G2, parental salinity and offspring salinity were included as two separate fixed effects with an additional interaction effect. The two datasets of the ratio of the yolk sac size and the length of the larvae were modeled by adding crossing as a random effect. Weight of G2 at 12 dph, 30 dph and 3 mph and development of the sexual organs of the offspring at 3 mph was modeled by including crossing as a random effect nested in the random effect climate chamber of the offspring. Climate chamber was not included into the model of the yolk sac size/length ratio as larvae at 8 dpf were reared in glass bowls located in the same room.
If possible, the models of G2 were standardized for the factors density and age, which both could be limiting factors of the response variable. Weight modeled at 12 dph was standardized for density, which was included in the model as a fixed effect.
Density was not significantly influencing offspring body weight in both subsets and was therefore dropped during model selection. Moreover, the models were standardized for the age of every individual fish at 3 mph due to differences in age of a few days and included it as a fixed effect into the models of all traits at 3 mph. The factor age of each individual fish was significantly influencing the development of the sexual organs and was therefore kept in the model. In contrast, age was not significantly influencing offspring weight and was consequently dropped during model selection.
3. Results
3.1 Parents body size, mortality and reproductive condition
No significant differences (t = -0.435, p = 0.664) in weight were found amongst parents (G1) that were acclimated to the three levels of salinity during reproductive conditioning. The saline treatment also did not influence the mortality of the parents significantly (t = -0.804, p = 0.422).
14
The reproductive condition of the parents was determined as the gonadosomatic index (GI) and the size of their eggs. The GI of ripe females was significantly affected by the levels of salinity (t = -0.341, p = 0.02649), being the highest at a salinity of 33 PSU and with no significant differences between salinities of 6 and 20 PSU (Figure 4).
Figure 4 The weight of the gonads of ripe females (G1) in relation to their length (gonadosomatic index) according to the salinity (PSU level) they were introduced to.
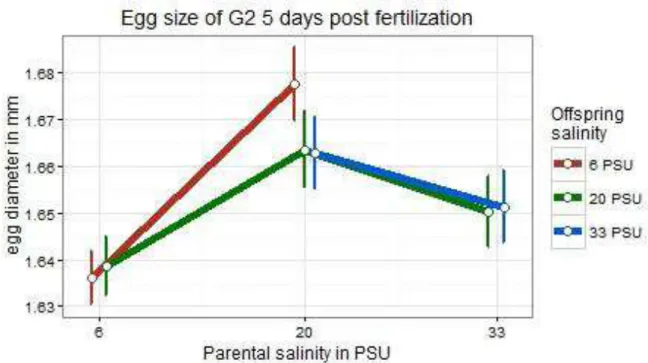
In both subsets egg size was significantly influenced by parental treatment (subset pPSU 6 vs. pPSU 20: t = 11.681, p < 0.0001; subset pPSU 20 vs. pPSU 33: t = - 7.327, p < 0.0001; Table 1). Offspring groups associated with the parental treatment of either 6 or 33 PSU showed smaller eggs compared to all offspring groups with parents from 20 PSU (Figure 5). Regarding subset subset pPSU 6 vs. pPSU 20, an interaction effect of parental and offspring treatment was identified (t = -2.194, p = 0.0282; Table 1).
Table 1 Generalized linear mixed effect models for egg size of Gasterosteus aculeatus offspring displaying the influence of offspring saline treatment (offspring PSU), parental saline treatment (parental PSU) and an interaction of both (pPSU x oPSU). All influences were tested on both subsets. Std. Error indicates standard error.
Significant terms are highlighted in bold.
Response variable
Data used (subset)
Fixed effects Estimate Std. Error t value Pr(>|z|) Egg size 6 pPSU vs. 20
pPSU
(Intercept) 0.484414 0.021291 22.753 < 2e-16 ***
Offspring PSU 0.001460 0.003191 0.458 0.6472
Parental PSU 0.04131 0.003564 11.681 < 2e-16 ***
pPSU x oPSU -0.009899 0.004512 -2.194 0.0282
20 pPSU vs.
33 pPSU
(Intercept) 0.05274031 0.0243526 21.657 < 2e-16 ***
Offspring PSU -0.0004037 0.0038360 -0.105 0.916
Parental PSU -0.0314361 0.0042904 -7.327 2.35e-13***
oPSU x pPSU 0.0019647 0.0054327 0.362 0.718
15
Figure 5 Means of the egg size in diameter in mm of Gasterosteus aculeatus offspring in response to offspring and parental salinity. Points depict means (+- SE) for crossing groups which differ in offspring and parental saline treatments.
3.2 Early life survival of the offspring
3.2.1 Fertilization success
3.2.1.1 Subset pPSU 6 vs. pPSU 20
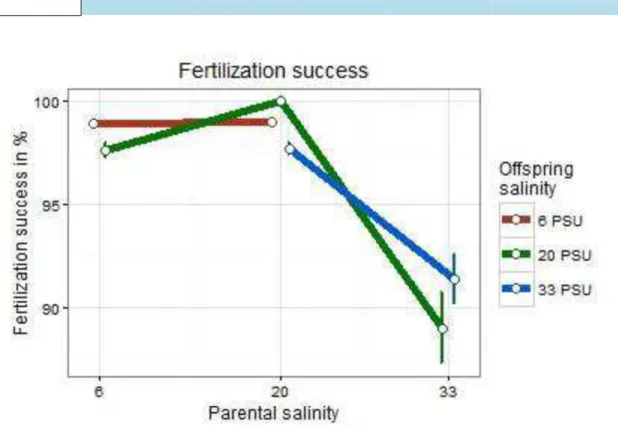
In subset pPSU 6 vs. pPSU 20, fertilization success was highly influenced by both parental (t = 3.2, p = 0.00155; Table 2) and offspring salinity (t = -6.5, p < 0.0001;
Table 2). Moreover, parental x offspring salinity interaction was highly significant (t = 8.0, p < 0.0001; Table 2). In this case, the control group of offspring reared in 20 PSU with parents from the same salinity had the highest mean fertilization success while offspring reared in 20 PSU with parents from 6 PSU had the lowest mean fertilization success (Figure 6). Regarding offspring salinity 6 PSU, offspring acclimated to 6 PSU with parents from 6 or 20 PSU had nearly the same fertilization success (Figure 6).
3.2.1.2 Subset pPSU 20 vs. pPSU 33
Subset pPSU 20 vs. pPSU 33 showed a significantly high influence of parental salinity on the fertilization success (t = -5.72, p < 0.0001; Table 2). The parental salinity of 33 PSU negatively influenced fertilization success of both associated offspring groups (Figure 6). Even though the offspring salinity was not significant, a significant parental x offspring salinity interaction effect was estimated (t = 2.13, p = 0.0328; Table 2). Fertilization success of eggs put in 33 PSU from parents
16
developed in the same salinity was lower than 33 PSU offspring from parents developed in 20 PSU (Figure 6). In general, the control group of eggs which reared in 20 PSU from parents of the same environment showed the highest fertilization success (Figure 6).
Table 2 Generalized linear mixed effect models for fertilization success of Gasterosteus aculeatus offspring displaying the influence of offspring saline treatment (offspring PSU), parental saline treatment (parental PSU) and an interaction of both (pPSU x oPSU). All influences were tested on both subsets. Std. Error indicates standard error. Significant terms are highlighted in bold.
Response variable
Data used (subset)
Fixed effects Estimate Std. Error t value Pr(>|z|) Fertilization
success
6 pPSU vs. 20 pPSU
(Intercept) 4.596187 0.007402 620.9 < 2e-16 ***
Offspring PSU -0.013254 0.002052 -6.5 1.05e-10 ***
Parental PSU 0.007230 0.002284 3.2 0.00155 **
pPSU x oPSU 0.023241 0.002901 8.0 1.15e-15 ***
20 pPSU vs.
33 pPSU
(Intercept) 4.59002 0.03606 127.30 < 2e-16 ***
Offspring PSU -0.02318 0.01603 -1.45 0.1481
Parental PSU -0.10318 0.01803 -5.72 1.05e-08 ***
Figure 6 Means of the fertilization success of Gasterosteus aculeatus offspring in response to offspring and parental salinity. Points depict means (+- SE) for crossing groups which differ in offspring and parental saline treatments.
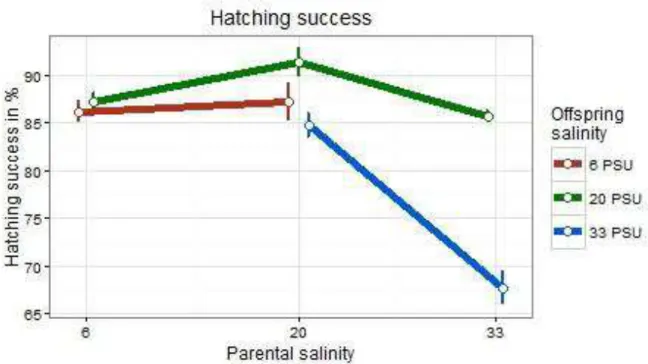
3.2.2 Hatching success
3.2.2.1 Subset pPSU 6 vs. pPSU 20
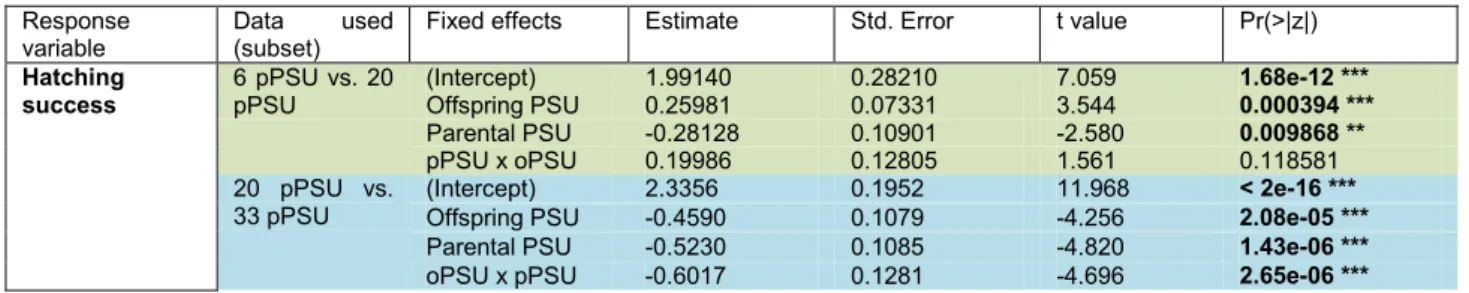
In subset pPSU 6 vs. pPSU 20 hatching success was significantly influenced by both parental (t = -2.580, p = 0.009868; Table 3) treatment and offspring treatment (t = 3.544, p = 0.000394; Table 3). Offspring groups belonging to the offspring treatment of 6 PSU did not differ between parental salinities of 20 and 6 PSU, which was also a
17
result for fertilization success (Figure 7). As was also seen in the case of fertilization success, the control group of offspring reared in 20 PSU with parents from the same treatment had the highest hatching success (Figure 7). However, parental x offspring treatment interaction effects did not influence hatching success significantly (t = 1.561, p = 0.118581; Table 3).
3.2.2.2 Subset pPSU 20 vs. pPSU 33
Both parental (t = -4.820, p < 0.0001) and offspring (t = -4.256, p < 0.0001) treatment influenced the hatching success in subset pPSU 20 vs. pPSU 33 significantly (Table 3). Both offspring groups with a parental environment of 33 PSU had a lower hatching success than offspring groups associated with parental PSU 20 (Figure 7).
However, the 20 PSU offspring group belonging to the parental environment of 33 reached a significantly higher hatching success than their siblings (oPSU 33 – pPSU 33). Additionally, the interaction effect of parental x offspring salinity was significantly influencing the hatching success (t = -4.696, p < 0.0001; Table 3).
Table 3 Generalized linear mixed effect models for hatching success of Gasterosteus aculeatus offspring displaying the influence of offspring saline treatment (offspring PSU), parental saline treatment (parental PSU) and an interaction of both (pPSU x oPSU). All influences were tested on both subsets. Std. Error indicates standard error. Significant terms are highlighted in bold.
Response variable
Data used (subset)
Fixed effects Estimate Std. Error t value Pr(>|z|) Hatching
success
6 pPSU vs. 20 pPSU
(Intercept) 1.99140 0.28210 7.059 1.68e-12 ***
Offspring PSU 0.25981 0.07331 3.544 0.000394 ***
Parental PSU -0.28128 0.10901 -2.580 0.009868 **
pPSU x oPSU 0.19986 0.12805 1.561 0.118581
20 pPSU vs.
33 pPSU
(Intercept) 2.3356 0.1952 11.968 < 2e-16 ***
Offspring PSU -0.4590 0.1079 -4.256 2.08e-05 ***
Parental PSU -0.5230 0.1085 -4.820 1.43e-06 ***
oPSU x pPSU -0.6017 0.1281 -4.696 2.65e-06 ***
18
Figure 7 Means of the hatching success of Gasterosteus aculeatus offspring in response to offspring and parental salinity. Points depict means (+- SE) for crossing groups which differ in offspring and parental saline treatments.
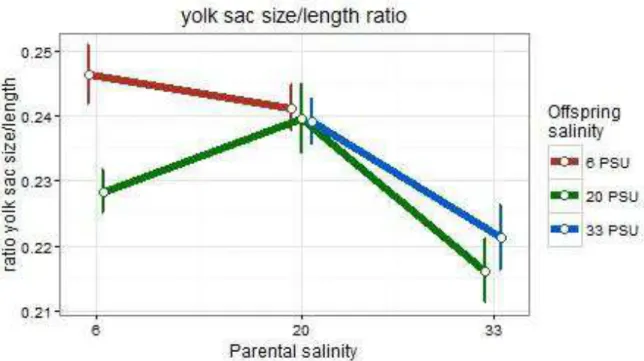
3.2.3 Ratio yolk sac size/length of larvae at 8 dpf
3.2.3.1 Subset pPSU 6 vs. pPSU 20
In subset pPSU 6 vs. pPSU 20, the yolk sac/length ratio of the larvae was only determined by the offspring environment (t = 3.30, p = 0.000976; Table 4). Offspring reared in their parental environment of 6 PSU had the highest yolk sac/length ratio and their siblings that were reared in 20 PSU had the lowest (Figure 8).
3.2.3.2 Subset pPSU 20 vs. pPSU 33
In turn, only the parental environment influenced the yolk sac/length ratio of the larvae in subset pPSU 20 vs. pPSU 33 (t = -6.622, p < 0.0001; Table 4). This effect was noticeable since the ratio of offspring from parents from 33 PSU was lower than from offspring having parents from 20 PSU (Figure 8).
Table 4 Generalized linear mixed effect models for the yolk sac/length ratio of Gasterosteus aculeatus offspring displaying the influence of offspring saline treatment (offspring PSU), parental saline treatment (parental PSU) and an interaction of both (pPSU x oPSU). All influences were tested on both subsets. Std. Error indicates standard error. Significant terms are highlighted in bold.
Response variable
Data used (subset)
Fixed effects Estimate Std. Error t value Pr(>|z|) Ratio yolk sac
size/ length 8 dph
6 pPSU vs. 20 pPSU
(Intercept) -1.42110 0.04386 -32.40 < 2e-16 ***
Offspring PSU -0.06752 0.02048 -3.30 0.000976 ***
Parental PSU 0.01566 0.02264 0.69 0.489175
pPSU x oPSU 0.05174 0.02885 1.75 0.072911
20 pPSU vs.
33 pPSU
(Intercept) -1.357e+00 6.418e-02 -21.137 < 2e-16 ***
Offspring PSU -7.492e-05 2.475e-02 -0.003 0.998
Parental PSU -1.898e-01 2.866e-02 -6.622 3.55e-11 ***
pPSU x oPSU 2.705e-02 3.584e-02 0.755 0.450
19
Figure 8 Means of the yolk sac size/length ratio of Gasterosteus aculeatus offspring at 8 days post fertilization in response to offspring and parental salinity. Points depict means (+- SE) for crossing groups which differ in offspring and parental saline treatments.
3.3 Offspring body size and maturity
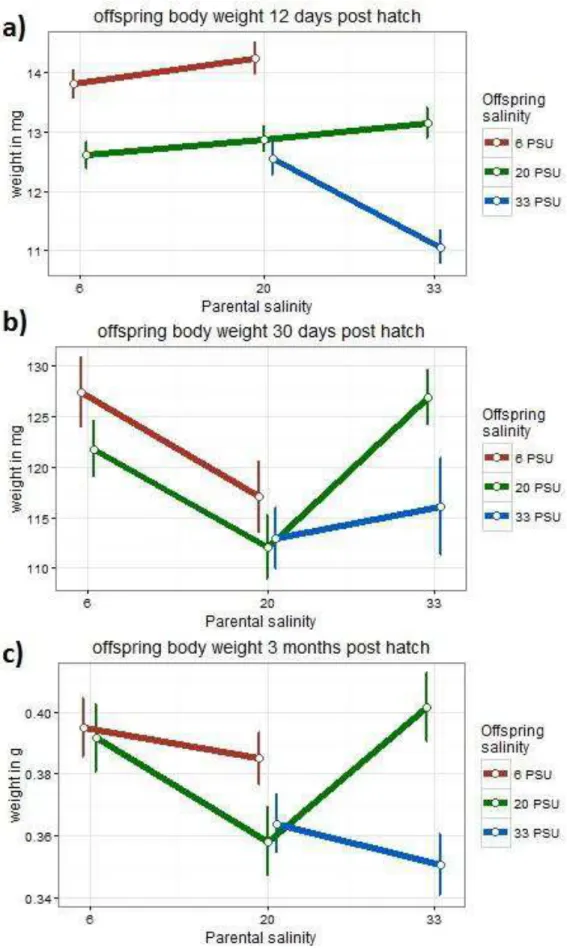
3.3.1 Weight
3.3.1.1 Subset pPSU 6 vs. pPSU 20
In subset pPSU 6 vs. pPSU 20, the weight of the offspring was highly influenced by the parental salinity at all measured points in time (Table 5). The offspring salinity also significantly affected the offspring weight at 12 and 30 dph, but not anymore at 3 mph (Table 5). This underlines the general trend of the offspring treatment affecting offspring weight less over time while the parental treatment remains highly significant.
However, no significant interaction effect of parental x offspring treatment was identified at all measured points in time (Table 5). The parental treatment of 6 PSU showed positive effects on the offspring weight. In detail, offspring of 6 PSU parents were heavier than those from 20 PSU parents at 30 days and 3 months post hatch (Figure 9b+c).
3.3.1.2 Subset pPSU 20 vs. pPSU 33
Across all measured points, there were significant interaction effects of parental x offspring salinity affecting the weight of the offspring in subset pPSU 20 vs. pPSU 33 (Table 5). Moreover, both parental and offspring treatments significantly influenced
20
the weight of the offspring at all points, except for in the case of 30 dph, where offspring salinity was not significant at 30 dph (Table 5).
In general, the parental treatment of 33 PSU showed a negative effect on offspring weight when offspring reared in their matching environment, which was for instance visible at 12 dph (Figure 9a). In turn, a positive effect on offspring weight was identified when offspring of 33 PSU parents reared in their non-parental environment of 20 PSU. In particular, the weight of this offspring group (oPSU 20 – pPSU 33) was at both points later in time (30 dph and 3 mph) higher than of the offspring from 33 PSU with parents from the same treatment and even higher than the control group (oPSU 20 – pPSU 20) (Figure 9b+c).
Table 5 Linear mixed effect models for weight of Gasterosteus aculeatus offspring at 12 dph, 30 dph and 3 mph displaying the influence of offspring saline treatment (offspring PSU), parental saline treatment (parental PSU) and an interaction of both (pPSU x oPSU). All influences were tested on both subsets. Numerator degrees of freedom were 1 in all cases. DenDF stands for denominator degrees of freedom. Significant terms are highlighted in bold.
Weight 12 dph Weight 30 dph Weight 3 mph
Data used
Fixed effects denDF F P denDF F P denDF F P
6 pPSU vs. 20 pPSU
(Intercept) 208 5989.30 < 0.0001 *** 120 599.768 < 0.0001 *** 228 626.00 < 0.0001 ***
Offspring PSU 208 41.929 < 0.0001 *** 120 3.9699 0.0486 228 2.6638 0.1040 Parental PSU 208 6.928 0.0091 ** 120 21.9648 < 0.0001 *** 228 20.092 < 0.0001 ***
oPSU x pPSU 208 0.067 0.7957 120 0.0224 0.8812 228 1.6234 0.2039 20
pPSU vs. 33 pPSU
(Intercept) 192 935.278 < 0.0001 *** 110 362.826 < 0.0001 *** 225 768.24 < 0.0001 ***
Offspring PSU 192 20.0976 < 0.0001 *** 110 2.5199 0.1153 225 5.0755 0.0252 * Parental PSU 192 20.6881 < 0.0001 *** 110 5.4151 0.0218 * 225 4.5191 0.0346 * oPSU x pPSU 192 13.5254 3e-04 *** 110 4.0694 0.0461 * 225 7.7141 0.0059 **
21
Figure 9 Means of the body weight of Gasterosteus aculeatus offspring at 12 dph, 30 dph and 3 mph in response to offspring and parental salinity. Points depict means (+- SE) for crossing groups which differ in offspring and parental saline treatments.
22 3.3.2 Development of the sexual organs
The development of the sexual organs of the offspring at 3 months was significantly determined by the parental treatment only (Subset pPSU 6 vs. pPSU 20: t = -2.835, p
= 0.00485; Subset pPSU 20 vs. pPSU 33: t = 2.685, p = 0.00725; Table 6).
Regarding Figure 10, more offspring with developed sexual organs were identified which belonged to parental treatments of 6 and 33 PSU 6 than offspring associated with parents from control conditions (20 PSU).
Table 6 Linear mixed effect models for the development of the sexual organs of Gasterosteus aculeatus offspring at 3 mph displaying the influence of offspring saline treatment (offspring PSU), parental saline treatment (parental PSU), Age and an interaction of both (pPSU x oPSU). All influences were tested on both subsets. Numerator degrees of freedom were 1 in all cases. DenDF stands for denominator degrees of freedom. Significant terms are highlighted in bold.
Response variable
Data used (subset)
Fixed effects Estimate Std. Error t value Pr(>|z|) Development
of the sexual organs of the offspring
6 pPSU vs. 20 pPSU
(Intercept) 92.4952 34.1904 2.705 0.00682 **
Offspring PSU 0.1495 0.5454 0.274 0.78406
Parental PSU -2.0955 0.7392 -2.835 0.00485**
Age -0.9899 0.3723 -2.959 0.00784**
pPSU x oPSU 0.0948 0.6922 0.137 0.089107
20 pPSU vs.
33 pPSU
(Intercept) 58.03237 37.84933 1.533 0.12521
Offspring PSU -0.55753 0.44703 -1.247 0.21233
Parental PSU 1.87586 0.69861 2.685 0.00725 **
Age -0.62887 0.41927 -1.500 0.133364
pPSU x oPSU 0.05267 0.70979 0.074 0.94085
Figure 10 Development of the sexual organs of Gasterosteus aculeatus offspring at 3 mph in response to offspring and parental salinity.
23
4. Discussion
In general, this study demonstrates environment-specific TGEs on offspring performance. Due to the complexity of different processes that were involved in the observed effects, they will be discussed consecutively.
4.1 Parents body size and mortality
Given that the body size and mortality of parents did not vary between the saline treatments, no selection was detected. Since the offspring groups are equipped with the same genetic background, further discussion is needed to determine whether the early life survival of the offspring differed depending on the parental treatments in order to reveal TGEs.
4.2 Parental effects on early life survival of the offspring: fertilization and hatching success
As Wootton (Wootton, 1973) revealed, variations in fecundity of three-spined sticklebacks are mainly based on the variation of the size of the parents. Based on this fact no differences in fertilization and hatching success between parental treatments should be expected. However, here we show that early life survival of the offspring was significantly influenced by the parental saline treatments. These results suggest TGEs as resources were apportioned differently to the eggs according to the experienced saline environment of the parents, which was already shown when three-spined sticklebacks were exposed to different temperature environments (Shama et al., 2014b).
With regard to the results of the fertilization and hatching success for the foreign parental environment of 6 PSU, transgenerational effects were detected. Eggs from a parental environment of 6 PSU showed a high fertilization and hatching success regardless if they were introduced to their parental environment. This indicates that the parental environment of 6 PSU influenced both offspring groups positively to the nearly same extent and led therefore to a positive TGE. In comparison, eggs of the control group that reared in their parental environment of 20 PSU showed a slightly higher fertilization and hatching success.
Offspring from the foreign parental environment of 33 PSU showed a decrease in fertilization and hatching success. The negative effects of the high salinity were cumulative over generations, resulting in an especially low hatching success for offspring reared in their parental environment of 33 PSU. In this case interaction
24
effects of offspring and parental salinity on early life survival were revealed, indicating negative TGEs. Fertilization success was low for both offspring treatments belonging to the parental treatment of 33 PSU, but hatching success for 20 PSU offspring belonging again to the parental treatment of 33 PSU was significantly higher than of their siblings. The positive performance of the hatching success of eggs that were reared for 8 days in 20 PSU with parents of 33 PSU could be attributed to parental effects. This group performed better because of a high influence of the parental environment interacting with the offspring environment of 20 PSU as it represents their native environment and also acts as a less stressful environment in the case of osmoregulatory stress (Schade et al., 2014) .
In summary, differences in early life survival of the offspring depending on the parental environment were identified and proved TGEs. In particular, parents that neither differed in size nor in mortality between treatments led to a completely different survival of early life survival of the offspring, indicating epigenetic inheritance mechanisms. The possible underlying strategy of these observed TGEs and how these effects developed over time will be further examined in section 4.3 and 4.4.
4.2.1 Within-generational effects on offspring early life survival
As offspring treatment was also significantly influencing fertilization success, it can be argued that fertilization was not fully completed after the solution of sperm and HBSS were incubated for 20 minutes. This can be assured by considering previous studies that determined an unusual pattern for the externally fertilizing three-spined stickleback: while the sperm of most of the externally fertilizing fish has a short life span of only a few minutes, the sperm of sticklebacks moved for several hours (Elofsson, Mcallister, Kime et al., 2003). The spermatozoon motility is a substantial key component of fertilization, which is affected by extracellular ionic changes (Morisawa, 1994). Therefore, a change in the osmolality may impede their motility (Billard, 1978). In essence, not only the parental treatment influenced fertilization success as sperm were still motile when transferred to treatment water and were then also affected by its salinity level.
The result of previous studies on sperm motility of sticklebacks which found that sperm had the longest sperm motility period of up to 270 min in brackish water (5.5 PSU) also supports the observed positive effect on fertilization success (Elofsson et al., 2003). In contrast, high salinity regimes showed a reduced sperm motility of
25
sticklebacks, which also supports the observed negative effect at 33 PSU (Elofsson et al., 2003). Since most populations of sticklebacks that occur in high saline environments migrate to low saline environments for breeding, a high performance of fertilization success, hatching success and early development is expected in low saline environments (Munzing, 1963). The positive effect of a low salinity on hatching success can be further promoted by a high performance of juvenile survival of sticklebacks exposed to low salinity levels in previous studies (DeFaveri & Merila, 2013). Moreover, this positive effect of 6 PSU on sticklebacks could be based besides parental treatment effects on the fact that this level is the closest to their approximate isoosmotic level of 9 to 10 PSU (Garside, Heinze & Barbour, 1977, Frisch & Anderson, 2005). Because carbohydrate metabolism plays the key role for the energy supply for osmoregulation, less energy from carbohydrate metabolism is needed when sticklebacks develop close to their isoosmotic level (Tseng & Hwang, 2008). Therefore, the energy budget of sticklebacks allows them to reach larger sizes and causes higher survival rates in low saline treatments (DeFaveri et al., 2013). In comparison, the negative effects on fertilization and hatching success at 33 PSU could be due to high-energy demands for osmoregulation caused by the strongly hyperosmotic environment. Therefore, the opposing TGEs identified on early life survival of the offspring were also influenced by the opposing effect of the different saline levels of the offspring treatment.
4.3 Reproductive condition of the parents – parental provisioning against expected stress
Referring to parents that were introduced to a foreign environment of either 6 or 33 PSU, they produced significantly smaller eggs. Shown on the Atlantic salmon, the amount of eggs correlates negatively with egg size – the more eggs are produced, the smaller the eggs are (Thorpe, Miles & Keay, 1984). Consequently, both parental groups of the foreign treatments also produced significantly more eggs. This can be as well underlined by the result that parents from 33 PSU showed a higher weight of the gonads relative to their body weight (GI).
Considering these results of the reproductive condition of the parents, it can be suggested that females that were introduced to a foreign saline environment changed their reproductive strategy: females of 6 and 33 PSU developed more eggs to maximize their own fitness by maximizing fertilization and hatching success in a
26
stressful environment and to counteract selection (Shama et al., 2014b). This effect was also observed for studies on temperature, when sticklebacks produced more eggs at elevated (stressful) temperature regimes (Shama et al., 2014b).
Producing more and smaller eggs to reduce mortality could have lead to a trade-off causing lower investment per offspring (section 4.3.1). Therefore, it needs to be further analyzed whether the production of more eggs occurred at a cost of the quality of the offspring or if it caused TGEs (section 4.4).
4.3.1 Yolk sac size/length ratio of the larvae
For making predictions about whether and how the parental and offspring treatments influence the post-hatching lifespan (Chambers, Leggett & Brown, 1989), yolk sac size in relation to the length of the larvae is important. As the yolk sac contains oil globule which are composed of energy-rich triaglycerol (TAG), the volume of the oil globule (which affects the size of the yolk sac) correlates positively with subsequent growth and survival (Berkeley, Chapman & Sogard, 2004). Consequently, the higher the yolk sac/length ratio, the better will be the subsequent survival of the larvae.
The yolk sac/length ratio also becomes important for evaluating whether the previously mentioned reproductive strategy of producing more but smaller eggs in a changed environment led to a lower parental investment. A lower parental investment could be reflected in a smaller yolk sac containing less TAG and resulting in a lower yolk sac/length ratio.
By contrast to the hatching success, the yolk sac/length ratio was only determined by the offspring treatment in subset pPSU 6 vs. pPSU 20, indicating no TGEs. The expected lower yolk sac/length ratio of both offspring groups associated with parents from 6 PSU due to lower parental investment was not fully supported. The lower yolk sac/length ratio was only observed for offspring reared at 20 PSU. However, offspring reared at 6 PSU had a generally higher yolk sac/length ratio, which indicates that the expected effect might have been biased by within-generational effects of the offspring treatment of 6 PSU. This includes the fact that the experienced 6 PSU environment during the stages after fertilization might have led to lower energy consumption during the stages after fertilization, as 6 PSU was considered to be a low stress environment.
Alternatively, the yolk sac/length ratio was only determined by the parental environment of 33 PSU in the subset pPSU 20 vs. pPSU 33, also indicating TGEs.