Continental Shelf Research 199 (2020) 104101
Available online 12 March 2020
0278-4343/© 2020 Elsevier Ltd. All rights reserved.
Research papers
Environmental and coastline changes controlling Holocene carbon accumulation rates in fjords of the western Strait of Magellan region
Francisco Ríos
a,*, Rolf Kilian
a,b, Carina B. Lange
c,d,e,f, Oscar Baeza-Urrea
a, Helge W. Arz
g, Mark Zindorf
h, Ricardo De Pol-Holz
i, Frank Lamy
jaUniversit€at Trier, Lehrstuhl für Geologie Fachbereich Geographie/Geowissenschaften (FB VI), Campus II, Behringstrasse 21, 54286, Trier, Germany
bUniversidad de Magallanes, Avenida Bulnes, 01855, Punta Arenas, Chile
cDepartamento de Oceanografía, Universidad de Concepci�on, Casilla 160-C, Concepci�on, Chile
dCentro de Investigaci�on Oceanogr�afica COPAS Sur-Austral, Universidad de Concepci�on, Barrio Universitario, Concepci�on, Chile
eCentro de Investigaci�on Din�amica de Ecosistemas Marinos de Altas Latitudes (IDEAL), Universidad Austral de Chile, Campus Isla Teja, Valdivia, Chile
fScripps Institution of Oceanography, La Jolla, CA, 92037, USA
gLeibniz-Institut für Ostseeforschung Warnemünde, Seestraße 15, 18119, Rostock-Warnemünde, Germany
hIfremer - Centre de Brest, Laboratoire Environnement Profond, 29280, Plouzan�e, France
iCentro de Investigaci�on GAIA-Ant�artica (CIGA) and Network for Extreme Environment Research (NEXER), Universidad de Magallanes, Avenida Bulnes, 01855, Punta Arenas, Chile
jAlfred-Wegener-Institut Helmholtz-Zentrum für Polar und Meeresforschung, 27570, Bremerhaven, Germany
A R T I C L E I N F O Keywords:
Patagonian fjord sediments Paleoproductivity Carbon accumulation Biogenic carbonate Marine transgression Holocene
A B S T R A C T
Organic-rich sediments of the southernmost Chilean Pacific coast and its fjord system constitute an important component of the global marine carbon budget. Sediment records from Trampa and Caribe bays and Churruca fjord in the western Magellan fjord system have been analyzed with the goal of understanding the factors controlling carbon accumulation and its regional fluctuation throughout the Holocene. The individual response in paleoproductivity at the different sites and related variations in accumulation rates document a very complex interplay among local and regional-scale environmental changes, and coastline elevation across the Holocene.
Shallow sill basins close to the Pacific coast, as the ones studied here, are particularly sensitive to these processes, having responded with strong productivity changes throughout the Holocene.
A Bayesian mixed model approach, using sediment archived provenance proxies, indicates that components of terrestrial plants and soils washed-out into these basins contribute with a variable proportion (20–80 wt%) of the total accumulated organic carbon. Accumulation rates of terrestrial carbon increase with the amount of pre- cipitation in the hyper-humid mountain area, but also reflect distinct Holocene plant successions as well as long- term development of soil and vegetation cover that strongly overprint the direct precipitation impact. Over the Holocene accumulation rates of biogenic carbonate and aquatic-marine organic carbon range between 5 and 118 kg m 2 kyr 1 and 0.3–20 kg m 2 kyr 1, respectively. This variability depends on water column structure and conditions, which are regulated by the degree of marine transgression as a function of post glacial sea level rise and isostatic uplift as well as precipitation-related surface water freshening. In the Bahia Trampa record, a significant change in accumulation rates indicates a marine transgression at ca. 12.2 kyr BP, when the global sea level was 60–70 m lower than today and eustatic rise overcame isostatic rebound rates. In Caribe and Trampa records, CaCO3 accumulation rates were higher at ca. 7 kyr BP. The Churruca record shows organic carbon accumulation rates up to 36.2 kg m 2 kyr1 during the early Holocene.
1. Introduction
The factors controlling fluxes and coastal aquatic-marine storage of
organic carbon (OC) as well as the accumulation of biogenic carbonate in shelf sediments, and particularly in fjord regions, are crucial for the global carbon budget. A recently review highlights the importance of
* Corresponding author.
E-mail addresses: phrano@gmail.com (F. Ríos), clange@udec.cl (C.B. Lange), baezaurr@uni-trier.de (O. Baeza-Urrea), helge.arz@io-warnemuende.de (H.W. Arz), mark@zindorf.de (M. Zindorf), ricardo.depol@umag.cl (R. De Pol-Holz), Frank.Lamy@awi.de (F. Lamy).
Contents lists available at ScienceDirect
Continental Shelf Research
journal homepage: http://www.elsevier.com/locate/csr
https://doi.org/10.1016/j.csr.2020.104101
Received 16 April 2019; Received in revised form 6 March 2020; Accepted 10 March 2020
these sensitive systems needing intensive investigation (Bianchi et al., 2020). Smith et al. (2015) estimated that the contribution of OC in fjord sediments is equivalent to ~10 wt% of the annual marine OC burial. The Pacific continental margin of Patagonia includes the most extended fjord region in the world (total area of 240,000 km2 and 84,000 km of coastline; Pantoja et al., 2011). Despite its vast extension, only few studies constrain the recent accumulation of aquatic-marine and terrestrial OC, and biogenic carbonate in sediments of the Patagonian fjord ecosystems (Aracena et al., 2011; Lafon et al., 2014; Sepúlveda et al., 2011; Silva et al., 2011; Vargas et al., 2011). The spatial distri- bution of OC sources of north Patagonia surface sediments indicate a gradient of terrestrial OC contents from 62 wt% to 32 wt% in a fjord-ocean transect (Gonz�alez et al., 2019).
On longer time-scales, Holocene fjord sediment records show vari- able contribution of OC from terrestrial vegetation sources, in particular derived from dense rainforests and peatlands (OCterr: 30 to 70 wt%;
Bertrand et al., 2017, 2012; Harada et al., 2013; Lamy et al., 2010;
Rebolledo et al., 2015). The amount of terrestrial input to these fjord sediments depends on local and regional factors. Local geomorphology, in particular ratios between the areas of terrestrial catchments and related fjord basins (Cui et al., 2017; Hinojosa et al., 2014; Smeaton and Austin, 2017), development of drainage conditions as well as long-term development of soils with distinct chemical compositions related to bedrock lithologies, play a major role. Regional to local factors as climate conditions and the altitudinal distribution of the vegetation zone influence the transport of OCterr, which often depends on precipitation rates and locallly associated water pathways (Lamy et al., 2010).
Moreover, damages of terrestrial ecosystems after the deposition of tephra from explosive volcanic eruptions cause enhanced plant decay up to a millennium scale leading to increased delivery and deposition of OCterr (Kilian et al., 2006; Korup et al., 2019; Mohr et al., 2017).
Organic carbon from aquatic-marine sources (OCaq) in Patagonian fjords principally derives from the local production of “brackish water” organic matter, which is related to sea surface temperatures (SSTs), the supply of nutrients, and the depth of the photic zone (Cuevas et al., 2019; Kilian et al., 2013a). Macronutrients (nitrate and phosphate) are mainly introduced by oceanic water with higher salinities and locally reduced thermohaline gradients (Cuevas et al., 2019; Ríos et al., 2016).
Moreover, continental runoff transports other macronutrients such as dissolved silica as well as micronutrients (i.e., iron) into the fjords, exerting an additional influence on the “brackish water” productivity (Iriarte et al., 2014; Torres et al., 2011, 2014).
A significant amount of carbon storage in fjord sediments concerns the accumulation of biogenic carbonate that contributes to the total carbon burial with a regionally and temporally highly variable quantity (Smeaton et al., 2017). Since accumulation of biogenic carbonate in fjords is sourced from planktic and benthic organisms, the relative contribution of both depends on thermohaline and nutrient conditions within the whole water column (Gonz�alez et al., 2013; Milzer et al., 2013; Rüggeberg et al., 2016). In particular, benthic foraminifera constitute up to 38 wt% of the inorganic carbon in Arctic fjord sediments (Pawłowska et al., 2017). In the Magellan fjord system, benthic fora- minifera species distribution is strongly controlled by oceanic input from the Pacific in the west and the freshwater input from land (Hromic et al., 2006). This freshwater input occurs as a superficial outflow, which in addition to variations in runoff from rivers and streams, and meltwater from glaciers, is controlled by the variable strength of the Southern Westerly Winds (SWW) (Kilian et al., 2013a).
Variability in SWW intensities exhibit a significant positive correla- tion with the amount of precipitation on the elevated windward side of the Andes (Garreaud et al., 2013), and thus also with the freshwater discharge and local glacier mass balances. The related physical and chemical denudation rates control the terrestrial supply of micro- nutrients (Breuer et al., 2013a) and consequently, affect the aquatic primary production in the fjord region (Kilian et al., 2013a; Ríos et al., 2016). Based on the correlation between precipitation and regional
SWW intensities, precipitation-sensitive proxies in sediment cores have been used to reconstruct Holocene variations in width, strength and latitudinal position of the SWW belt (Kilian and Lamy, 2012 and refer- ences therein).
Records from southwestern Patagonia (52�–53�S) evidence highest precipitation rates during the early Holocene between ca. 11 to 8.5 kyr BP (Kilian and Lamy, 2012; Lamy et al., 2010). These implications have been partially controversially discussed (Moreno et al., 2010; Fletcher and Moreno, 2012). At these latitudes, recent studies from eastern Patagonia, which presents an inverse correlation between precipitation and zonal wind intensities (Garreaud et al., 2013), indicate a humid phase in the early Holocene between ca. 11.2 to 10.1 kyr BP while increased SWW intensity occurred from ca.10.1–8.3 kyr BP (Zolitschka et al., 2019). Composite analysis of pollen data from sites east of the Andes support the hypothesis that storm tracks weakened throughout Patagonia (41�–55�S) between ca.13–10 kyr BP, followed by stronger storm tracks in southern Patagonia than in northern Patagonia between ca.10–7 kyr BP (Nanavati et al., 2019).
In this context, records from the westernmost fjord region may contribute to a better understanding of the long-term variability and location of the SWW during the Late Glacial and the Holocene (Aracena et al., 2015; Harada et al., 2013). Here, we present three new sediment records from the fjord region around the western sector of the Strait of Magellan (Fig. 1a). The investigated cores represent examples of regional variations in accumulation rates and aquatic paleoproductivity since the Late Glacial. More specifically, we use organic and inorganic geochemical proxies and physical properties of the sediment cores with the aim of understanding the evolution and control factors of OC accu- mulation. We further infer the effects of marine transgression and the related coastline changes on marine productivity and OC accumulation as well as biogenic carbonate burial in the southern Patagonian fjords.
2. Study area
Next to the Pacific entrance of the Strait of Magellan there is an extended water system with estuarine characteristics that serves as an important transition area between land and ocean environments, including fjords, estuaries and other coastal semi-enclosed ecosystems.
The infilled postglacial sediments represent valuable archives for reconstructing past environmental changes in this region including paleoproductivity. The site-specific productivity and sedimentation dy- namics strongly depend on local bathymetries of variably deep basins and subaquatic sills (Table 1), which at present control ‒ and during the past constrained ‒ the influence of open marine water masses and a westward expanding surface outflow of fresher water from the inner fjords.
2.1. Description of sites
The locations of the investigated sediment cores are shown in Fig. 1b.
Two of them are located in the southwestern sector of the Reina Ade- laida Archipelago, next to the Pacific Ocean within previously unnamed small bays on the Contreras and Pacheco islands, now denominated Bahía Caribe and Bahía Trampa, respectively (Fig. 2a). These areas should have experienced pronounced regional coastline changes during the Holocene. A third sediment core was retrieved from the Churruca fjord, which is located to the southeast of the other two sites at Des- olaci�on Island (Fig. 2b).
The catchment areas of the studied basins are dominated by outcrops of the Southern Patagonian Batholith, including plutonites with a composition from granite to gabbro and mafic dikes (Diaz-Michelena and Kilian, 2015; Herv�e et al., 2007). Carbonate rocks are absent in the catchment and in the areas surrounding the studied sites. The closest limestone outcrops are located >70 km northward from the coastal sites BT and BC on Diego de Almagro Island (Fig. 1 and Suppl. Fig. S1). The vegetation is composed by rain forest patches in favorable sites with
adequate drainage and shelter from wind. In sectors with lower slopes, such as in BT and CHU, there is also development of dwarf shrubs, grass and herbs.
Fig. 2b illustrates the multi-basin estuary of the Churruca fjord where one of the investigated sites is located (CHU). The main basin has a N–S orientation from mouth to head. The three main arms are oriented NW- SE following the structural fabrics of the rocks along the Magellan- Fagnano fault system (Breuer et al., 2013b). The water exchange with the Strait of Magellan is restricted by two sills (<36 m and <34 m water depth, WD) separating the inner and outer fjord. In the inner fjord area, a shallow contraction (<30 m WD) further restricts the water exchange between the fjord’s inner and outer sub-basins. Towards the head of the estuary, a narrow constriction separates the shallow Brazo Le�on sub-basin (<25 m WD, Fig. 2b) from the deeper outer basins. The southwestern flanks of the surrounding mountains are up to 650 m high with slope angles of 15�–25�. Physical characteristics are summarized in Table 1.
The Bahía Caribe site (BC) is located in a semi-elliptic basin with a N–S orientation located at the head of an elongated fjord in ENE-WSW direction (Fig. 2a–c). The water exchange is restricted by a sill of 15 m WD, which connects the basin with a narrow inlet (7 km length, 0.5 km width, 200–250 m WD) open to the Pacific Ocean. The freshwater inflow comes from runoff and from a small affluent at the head of the fjord. During the coring operation (austral spring), a very low salinity was measured at the surface (3 psu) increasing strongly with depth to 30 psu at 6 m WD, from where values of 31 psu remained constant until the bottom at 70 m WD. Both east and west flanks of this basin display steep slopes (30�–50�) with a restricted vegetation cover (Table 1). The lower elevations of the catchment, particularly on the western flank, are characterized by well drained clastic slope deposits and almost totally covered by dense rainforest (Fig. 2c).
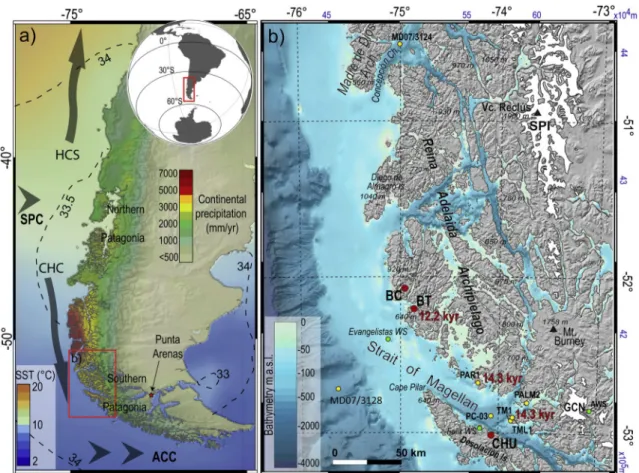
The Bahia Trampa site (BT) is a small semi-enclosed shallow bay of 15 m WD with estuarine conditions (Fig. 2d). It has an elongated shape in NE-SW direction and covers a comparatively smaller area than the Fig. 1. a) Southernmost South America with average annual precipitation values over Patagonia (mm yr 1; New et al., 2001), and modern annual mean sea surface temperature (SST �C) and salinity (dashed lines in psu) distributions of the surrounding ocean (WOA13, Boyer et al., 2013). Modern ocean surface currents after Strub et al. (2019) include the South Pacific Current (SPC), the northward-branching Humboldt Current System (HCS), southward-branching Cap Horn Current (CHC) and the Antarctic Circumpolar Current (ACC). The red rectangle indicates the study area shown in Fig. 1b b) Red circles refer to the location of the new sediment core sites Bahía Trampa (BT), Bahía Caribe (BC) and Churruca fjord (CHU) presented here. Yellow circles show the position of core sites discussed in the text, and green circles refer to weather stations (WS) and the automatic weather station near Gran Campo Nevado ice field (AWS). Red annotations in kyr indicate the minimum age for the marine transgression in the western sector of the Strait of Magellan (after Lamy et al., 2010 and Kilian et al., 2007a). Topography and bathymetry from GMRT 3.5 (Ryan et al., 2009). Blue annotation indicates the UTM coordinates. Projection UTM18S, datum WGS84. (For interpretation of the references to colour in this figure legend, the reader is referred to the Web version of this article.)
Table 1
Summary of physical characteristics of the three study sites.
Site Catchment area (km2) Basin area (km2) Vegetation area (km2) Veg.cover (%) Catchment/basin area Veg./basin area Sill depth (m a.s.l.)
Bahía Trampa 4.4 0.16 1.9 44 27.5 11.9 3
Bahía Caribe 3.2 0.94 0.7 20 3.4 0.7 15
Churruca fjord 3.8 0.95 2.2 55 4 2.3 30
other sites (Table 1). Towards the northeast, a narrow channel (30 m wide and 230 m long) connects BT with the open fjord system next to the Pacific Ocean. The very shallow depth of this channel (1.5–3 m) restricts the water exchange with the open fjord depending on the tidal water levels. Measured salinities increase from 5 psu at the surface to 30 psu at the bottom of the bay. The southern flank of the catchment reaches up to 50 m elevation and exhibits inclinations of 15�–25� and is sparely vegetated, while the northern flank has steeper slope angles of 30�–35� and is covered by a dense rainforest (Table 1). At the SW shore, a small river enters the bay (Fig. 2d).
The geomorphological features of the CHU and BC sites are very similar with respect to catchment and basin sizes and ratios. However, the steeper slopes probably restrict the vegetation cover and soil development in BC compared with CHU (Table 1). CHU is characterized as an inner fjord environment with a well-developed vegetation catch- ment while BC represents a coastal basin with more restricted terrestrial organic sources. The BT site is also close to the open marine environ- ment, but presents a more extended vegetation cover with a much larger catchment/basin ratio than that of BC (Table 1).
2.2. Oceanography and precipitation regime
At the latitude of the study area (53�S), the coastal surface water properties are controlled by the Cape Horn Current (CHC) flowing along the Southern Chilean continental margin from around 45�S towards the Drake Passage (Fig. 1a; Strub et al., 2019; Lamy et al., 2015). Oceanic waters enter the Magellan fjord system as saline bottom waters (salinity
>33 psu) below a fresh/brackish surface water layer (salinity 1–32 psu;
Aracena et al., 2015; Kilian et al., 2013a; Palma et al., 2014; Valdenegro and Silva, 2003). The thermohaline properties of the brackish layer are mainly controlled by a variable amount of freshwater input and the mixing degree with Pacific waters (Silva and Vargas, 2014). The in- tensity of this surface freshening changes on seasonal and weekly scales, in particular e.g. after extremely high precipitation events or due to glacier meltwater loaded with glacial clays and snow melting that accumulated on top of adjacent mountains. Surface salinities are generally higher during autumn and winter, while runoff from frequent storms and glacier melting can strongly reduce salinities (<20 psu) during the late spring and summer in the uppermost few meters of the water column (Kilian et al., 2007a, 2013a).
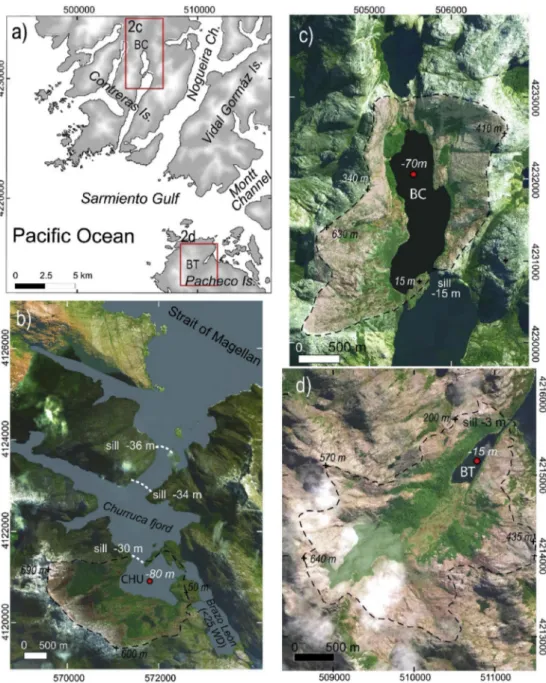
Fig. 2.Detailed maps of the study areas.
Red dots indicate coring sites CHU, BC and BT. Water depths of sills and basins are shown as white/black annotations. Black dashed lines refer to catchment areas, and annotations over the line indicate their maximum elevations. a) SW sector of Reina Adelaida Archipelago. Red rectangles show the locations of BC and BT sites. b) Churruca fjord site (CHU) at the south coast of the Strait of Magellan. c) Bahía Caribe core site (BC, Contreras Island) and d) Bahía Trampa core site (BT, Pacheco Island). Projection UTM18S, datum WGS84. Image source Bing Maps - Digital Globe 2015. (For interpreta- tion of the references to colour in this figure legend, the reader is referred to the Web version of this article.)
In the study area, precipitation is driven by the SWW (Garreaud, 2009; Garreaud et al., 2013). The SWW are strongest between 50�and 55�S (Lamy et al., 2010; Saunders et al., 2018). At these latitudes, annual precipitation on the western side of the orographic barrier of the Andes reaches very high values (3,000–10,000 mm yr 1; Schneider et al., 2003; Weidemann et al., 2018) and decreases strongly towards the east (e.g. 300–400 mm yr 1 in Punta Arenas, Stolpe and Undurraga, 2016).
Coastline changes during the Holocene are related to global sea level rise and regional vertical movements of the continental crust. The uplift in the investigated region is mainly associated with subduction-related tectonic deformation (Bentley and McCulloch, 2005; Rostami et al., 2000) and isostatic vertical adjustments (McCulloch et al., 2005; Porter et al., 1984). The combination of these factors strongly affected past environmental changes in the Strait of Magellan area, in accordance with the timing and degree of the marine transgressions (Aracena et al., 2015; Kilian et al., 2007a, 2013a).
3. Material and methods 3.1. Sediment coring
The sediment cores were retrieved onboard RV Gran Campo II during campaigns in 2007 (CHU site) and 2011 (BC and BT sites) after sys- tematic sediment echosounding in each basin. An UWITEC piston corer of 5 m length and 63 mm in diameter with internal and removable PVC liners was used for sediment coring. For composite core lengths of more than 5 m, discontinuous drilling was performed. In this case, for the recovery of the deeper core sections, first the sediments were drilled with closed piston corer (piston in place) to a depth determined 1 m above the base of the previously drilled section. The piston corer was then opened (piston released) and 5 additional meters where drilled with sediment recovery. This was done in order to obtain ~1 m overlap of single core sections. Additionally, 0.4–1 m long gravity cores were taken to obtain undisturbed records from the uppermost sediment layers. The correlation between single core sections was performed adjusting the sediment depths in agreement with stratigraphic markers observed in the cores and geochemical measurements. The correlation in BT and BC records was controlled by high-resolution X-ray fluorescence scanner data on the split sediment cores (Suppl. figs. S2, S3 and S4).
The investigated sediment core from the CHU fjord (53�03.290S, 73�55.760W) was retrieved at 80 m WD. Its composite core length is 11.2
m and consists of three piston core sections (30–517 cm, 430–904 cm and 780–1156 cm core depths). No gravity core was taken at this site.
Therefore, we assume that 30 cm of the surface sediments were missing during the piston coring operation considering a linear extrapolation of the three uppermost age determinations (see section 3.3) and regional values of sedimentation and accumulation rates during the late Holo- cene (Kilian and Lamy, 2012). At the BC site (52�04.040S, 74�55.000W), a total sediment core composite of 9.1 m length was recovered from 70 m WD. The BC record consists of a superficial gravity core (0–25 cm) and two piston core sections (25–420 cm and 420–911 cm core depth). From the deepest sector of the BT (15 m WD, 52�12.840S, 74�50.540W), a composite sediment core of 9.0 m length was retrieved. The BT record is composed of a superficial gravity core (0–26 cm) and three piston core sections (27–367 cm, 369–509 cm and 521–900 cm core depths).
3.2. Age determinations and age-depth models
All sediment cores have been inspected for possible tephra layers known to occur in the region. In the CHU record, the 4.15 kyr BP Mt.
Burney tephra was identified at 368 cm sediment depth, by means of its chemical composition and SEM-based typical structure of the included pumices (Kilian et al., 2003, 2013b). The westernmost BT and BC sites seem to be outside of the Holocene tephra distribution areas of the volcanoes Hudson, Aguilera, Reclus and Mt. Burney (Stern, 2008).
Accelerator mass spectrometer radiocarbon ages (14C AMS) were determined on plant remains (i.e. wood or leaves) and marine mollusk shells at NOSAMS (Woods Hole Oceanographic Institution, USA), the Department of Earth Systems Sciences of the University of California, Irvine, USA, and MICADAS Laboratory, AWI, Bremerhaven, Germany.
Marine shell ages were corrected for a reservoir effect of 500 yr. This reservoir age was estimated by the offset between the well-dated 4.15 kyr BP Mt. Burney tephra and the 14C ages at the CHU core. All radio- carbon ages have been calibrated using SHCal13 calibration curve (Table 2; Hogg et al., 2013). Age models and calculations of sedimen- tation rates (SR in mm yr 1) were performed with CLAM 2.2 software (Blaauw, 2010). All sediment core depths were corrected for virtually instantaneous event layers with >1 cm thickness. Such event layers were not considered in the calculations of sedimentation rates.
The age-depth models were based on the composite depths of the cores and the distribution of the calibrated radiocarbon ages (Table 2), using a spline interpolation that considers a smooth factor of 0.3 for BC and BT, and 0.5 for CHU, in order to adjust the SR at the base of the CHU Table 2
Radiocarbon ages and calibrated 95% confidence intervals used for the depth-age models. The SHCal13 curve (Hogg et al., 2013) was used to calibrate the ages. Marine reservoir age ¼500 yrs. UCI ¼Department of Earth Systems Sciences University of California, Irvine; OS ¼National Ocean Sciences Accelerator Mass Spectrometry Facility (NOSAMS, Woods Hole Oceanographic Institution). AWI ¼MICADAS Laboratory, Alfred Wegener Institute.
Core Core depth (cm) Laboratory code 14C age �error (yr BP) Material Cal. 95% confidence intervals (yr BP)
CHU 58 UCIAMS 82045 1325 �15 Marine shell 680–770
CHU 78 UCIAMS 82046 1500 �20 Marine shell 810–870
CHU 138 UCIAMS 82047 2070 �15 Marine shell 1430–1510
CHU 260 UCIAMS 82048 3275 �20 Marine shell 2800–3060
CHU 313 UCIAMS 82049 3730 �15 Marine shell 3430–3640
CHU 345 UCIAMS 82050 4205 �15 Marine shell 4090–4330
CHU 531 UCIAMS 82051 5595 �15 Marine shell 5800–5900
CHU 627 UCIAMS 82052 6935 �15 Marine shell 7170–7290
CHU 803 OS-74685 8160 �35 Wood 8990–9240
CHU 903 OS-74686 8355 �20 Wood 9150–9440
CHU 1080 OS- 74687 9740 �50 Wood 10800–11230
BC 202 UCIAMS 108165 2125 �50 Wood 1930–2300
BC 482 AWI 1352.1.1 5417 �57 Wood 6000–6280
BC 714 UCIAMS 108166 8260 �60 Wood 9020–9400
BT 123.5 UCIAMS 108158 1350 �15 Nothofagus sp. leaf 1190–1280
BT 263 UCIAMS 108159 3395 �15 Wood 3490–3690
BT 294.5 UCIAMS 108160 3645 �20 Nothofagus sp. leaf 3840–3980
BT 534.5 UCIAMS 108161 6470 �20 Wood 7290–7420
BT 685.5 UCIAMS 108164 7560 �90 Wood 8170–8540
BT 854.5 UCIAMS 108162 10745 �45 Wood 12560–12730
core to values more consistent with regional rates for the early Holocene (Lamy et al., 2010; Kilian and Lamy, 2012, Fig. 3, Table 3). The CHU core depth-age model was based on eleven 14C AMS ages and the 4.15 kyr BP Mt. Burney tephra layer (Kilian et al., 2003, 2013b; Stern, 2008).
Beside the tephra, one event layer was identified in CHU core with a total thickness of 12 cm. Three 14C dates (Table 2) allowed to constrain appropriate SR estimations for the BC core. Six event layers were observed in BC core with a total thickness of 48 cm (Fig. 3b). The depth-age model of the BT core was based on six 14C ages (Table 2). In BT were identified 12 events layers with a total thickness of 32 cm (Fig. 3c).
3.3. Geochemical and physical property analyses
For geochemical analyses, a volume of ~3 cm3 of sediment was taken every 10 cm core depth, and additional samples for the event layers. The samples were weighed and dried overnight at 105 �C. The dry samples were weighed again to calculate dry bulk density (DBD) using the for- mula DBD ¼wt. (dry) g/sample vol. cm3. The elemental concentrations of total carbon (TC) and total nitrogen (N) were determined with an elemental analyzer VARIO Element III at the University of Trier, Ger- many. Previous to the analyses, all samples were homogenized using an agate mortar and pestle and subsampled into 20–30 mg portions and placed in tin capsules. The non-carbonate organic carbon (OC) content was determined on a LECO Carbon Sulfur Analyzer (LECO-CS 125) at the Alfred Wegener Institute (AWI), Bremerhaven, Germany. Samples were acidified by direct addition of HCl (1M) and dried at 150 �C overnight.
Calcium carbonate was calculated according to the formula: CaCO3 ¼ (TC - OC) x 8.333 with a detection limit of 0.01 wt% of CaCO3.
Major elements (Si, Al, Ti, Fe, Mn, Mg, Ca, Na and K) were measured by Atomic Absorption Spectrometry (AAS; Varian SpectrAA 220) at the University of Trier. About 100 mg of homogenized sediments were dried (105 �C) and fused in Platinum skillets with 400 mg of a flux material (mixture of Lithiumtetraborat, Lithiumcarbonate and Lanthanoxide).
Produced glass pearls were dissolved in 40 ml HCl (0.5M). Liquids of samples and international standards (MGR-1, SY-2 and JG-2) were measured by AAS. Determined major elements and loss on ignition (1050 �C) resulted in sums of 99–101 wt %.
The relative variation in the chemical composition was measured with an ITRAX μXRF scanner (Croudace et al., 2006) at the Leibniz Institute for Baltic Sea Research, Warnemünde (IOW), Germany. This non-destructive measuring technique allows for semi-quantitative geochemical analysis of split sediment cores with a very high spatial resolution. To avoid evaporation, the core halves were covered with an ultrathin plastic foil before being measured. The XRF measurements of the BT and BC cores were carried out every 2 mm and obtained with a molybdenum (Mo) X-ray tube, operated with a voltage of 40 kV, a current of 10 mA, and 15 s exposure time. In addition, the used μXRF core scanner took measurements of the coherent and incoherent scat- tering that depend on the mineralogical composition, water content, OC content and sediment packing density (Croudace et al., 2006). The ratio of the incoherent-coherent scattering (MoInc/MoCoh) can be considered as a good approximation for the content of organic matter, but it needs to be validated by absolute OC measurements, in particular for sediment sequences with high OC contents (Chague-Goff et al., 2016; Chawchai et al., 2016). The XRF scanning data for BC and BT were smoothed to 10-cm intervals using a fifty-point running average to compare with the lower resolution OC values.
Scanning results of Ti were normalized by dividing the counts by the coherent/incoherent ratio (Compton/Rayleigh scattering) to minimize the effects of organic matter and water content (Davies et al., 2015) and scaled to match the AAS determinations. This element is present in most lithogenic phases and thus is used as a proxy for inorganic siliciclastic terrestrial contents. μXRF coherent/incoherent normalized counts of bromine (Br) were used as tracers for marine derived organic input, since Br has a biophilic behavior and is typically enriched in ocean water
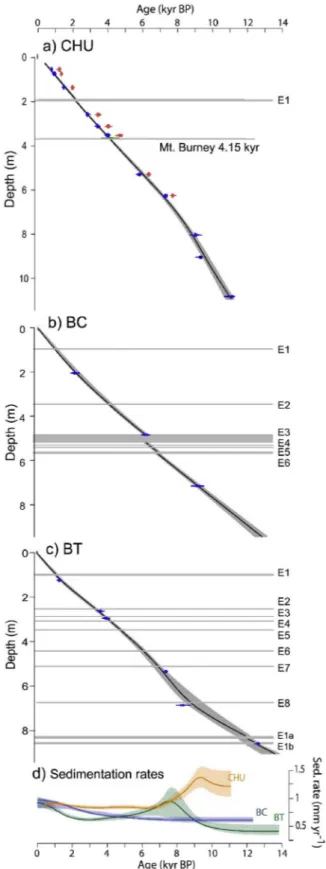
Fig. 3. Age-depth models produced with CLAM 2.2 software. Gray shaded areas indicate 95% confidence interval. Horizontal gray lines and annotation indicate single depositional events (Suppl. figs. S2, S3 and S4). Calibrated 14C ages are in blue. a) CHU core with smooth spline factor of 0.5. Red areas indicate the calibrated ages without the reservoir effect correction. For BC and BT cores (b and c) a smooth spline factor of 0.3 was used. d) Sedimentation rates without single depositional events. Colored shaded areas indicate 95%
confidence intervals. (For interpretation of the references to colour in this figure legend, the reader is referred to the Web version of this article.)
with high nutrient contents (Bertrand et al., 2017; Seidenkrantz et al., 2007; Ziegler et al., 2008). Moreover, calibrated values of Ti and Br were used as tracers for terrestrial and aquatic sources, respectively. As the wt
% OC and wt% N determinations were carried out in ~10 cm sediment intervals and the scanning data was obtained every 2 mm, the latter dataset was linearly interpolated to the same depth intervals for an appropriate comparison and further calculation of the terrestrial and aquatic fractions.
Terrestrial and aquatic-marine OC were calculated from OC contents using a Bayesian mixed model (Smeaton and Austin, 2017) with the FRUIT software (Fernandes et al., 2014). The highest value of calibrated Ti and Br XRF data were used as end-members for the terrestrial and aquatic-marine sources, respectively. Uncertainties were defined as � two standard deviation (�2SD), assuming a Gaussian distribution. The third tracer was defined by the molar N/C. Terrestrial and aquatic N/C end members followed those given by Lamy et al. (2010): molar N/C ¼ 0.15 �0.02 (C/N ¼5.9) as the aquatic (micro algal) end-member and N/C ¼0.032 �0.002 (C/N ¼30.3) as the terrestrial (vascular plant) end-member.
Accumulation rates (AR in kg m 2 kyr 1) were calculated by multiplying the concentration of each component by the DBD and the SR determined for each sampling interval. In this study, the AR OCaq and AR CaCO3 are used as proxies of marine paleoproductivity (Aracena et al., 2015; Lamy et al., 2010). Terrestrial OC primarily originates from nearby land sources and its supply into the fjord basins increases with precipitation and runoff. Therefore, we use AR OCterr as a freshwater input proxy (Frank et al., 2015; Lamy et al., 2010) considering the long-term relation of OCterr input with the vegetation colonization and soil development after deglaciation.
Additionally, the cores were inspected for remains of macro- organisms (e.g. bivalves, gastropods, plants). Granulometric analysis of bulk sediment samples of the BT core was performed by wet sieving and decantation. Previous to the dissolution with HCl, the sand fraction of selected core intervals was screened under 40X magnification Zeiss stereoscope at University of Trier to characterize biogenic rests and lithogenic phases.
4. Results
4.1. Sedimentation rates (SR)
The age-depth models of the studied cores give a maximum age of 14.1 kyr BP for the BT core at 9.0 m of sediment with an averaged SR of 0.6 mm yr 1. The BC record has a maximum age of 12.4 kyr BP at 9.1 m sediment depth while CHU record spans over 11.1 kry BP in 11.2 m of sediment with an average SR of 0.7 and 1.0 mm yr 1, respectively.
Sedimentation rate estimations are summarized in Table 3. Four event
layers, identified in the BT and BC records, show similar ages and might represent the same regional events. Table 4 presents the modeled age for these events with 95% confidence interval.
4.2. Biogenic carbonate concentrations and carbonate fauna
The BT core is the only record that includes the Late Glacial since ca.
14 kyr BP and shows laminated inorganic silts with some coarse sand layers until ca. 12.2 kyr BP. The Late Glacial - early Holocene transition is characterized by laminated sediments. After 12.2 kyr BP, a pro- nounced increase in CaCO3 is observed (Fig. 4a).
Throughout the early Holocene and during the first half of the mid- Holocene, the CaCO3 content of the three investigated cores steadily increases up to 26 wt%. After the Neoglacial, CHU and BT records exhibit a similar long-term decrease from 25 wt% to 10 wt%. In contrast, after ca. 5.5 kyr BP the BC record shows a rapid increase in CaCO3
content from 14 to 38 wt% and decrease in the last 2 kyr BP (Fig. 4a).
Shell fragments of bivalves were identified in the three cores (Chlamys sp. and Desmophyllum sp.). Identification of benthic forami- nifera in the sediments of CHU record showed the presence of Alveo- phragmiun orbiculatum, Bolivina sp., Bulimina patagonica, Buliminella elegantissima, Cibicides dispars, Discorbis sp., Elphidium sp., Stainforthia fusiformis, Globocassidulina crassa, Guttulina communis, Lagena caudate, Martinotiella communis, Nonionella auris and Spiroloculina tenuis. BT and BC show less diversity with mainly two taxa, Buliminella elegantissima and Nonionella auris and more shell fragment of ostracods. Single deposition layers, with coarse sand observed in BT and BC have Table 3
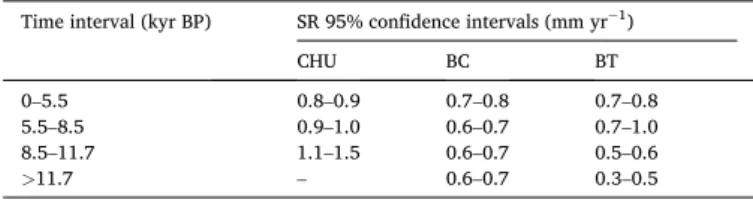
Sedimentation rates (SR) in mm yr 1 of the studied cores.
Time interval (kyr BP) SR 95% confidence intervals (mm yr 1)
CHU BC BT
0–5.5 0.8–0.9 0.7–0.8 0.7–0.8
5.5–8.5 0.9–1.0 0.6–0.7 0.7–1.0
8.5–11.7 1.1–1.5 0.6–0.7 0.5–0.6
>11.7 – 0.6–0.7 0.3–0.5
Table 4
Correlation of BC and BT events with 95% confidence interval modeled ages.
BC Core min. 95% max. 95% BT Core min. 95% max. 95%
E1 890 1050 E1 970 1150
E2 3970 4230 E3 3850 4020
E3 6040 6260 E6 5850 6170
E6 6660 6880 E7 6630 7050
Fig. 4. Measured contents of carbon fractions: a) CaCO3 wt%, b) OC wt% at the studied sites: Churruca fjord (CHU), Bahia Trampa (BT) and Bahia Caribe (BC).
Stars indicate layers related to single depositional events. c) N/C molar ratios.
Solid line represents a 3 pts. moving average calculated without the values of the single depositional events.
fragments of echinoderms and a more diverse foraminifer fauna, including, besides Buliminella sp. and Nonionella sp., Quinqueloculina seminula, Elphidium macellum and Cibicides sp.
4.3. Organic carbon concentration and molar nitrogen/carbon
Carbon content differs among the studied cores. During the early Holocene, the CHU core shows relatively high OC contents (9 wt%).
Wood remains in a debris flow deposit of BT indicate the presence of vegetation within its catchment at least since 12.6 kyr BP; however, the OC content in this record increases after 12.2 kyr BP and reaches similar values as CHU during the mid-Holocene. In contrast, the BC record is characterized by comparatively low contents of OC in the early Holo- cene, which increases after the Neoglacial (Fig. 4b). In general, all three sites show increasing OC content since the mid-Holocene toward the present.
We consider that the incoherent-coherent scattering ratio (MoInc/
MoCoh) obtained with the μXRF core scanner represents a good high resolution proxy for the OC content. The combined datasets from BT and BC cores exhibit very good correlations for the MoInc/MoCoh vs wt%
OC (R2 ¼0.9, n ¼198, Suppl. Fig. S5).
Carbon and nitrogen concentrations are well correlated in the stud- ied cores (Suppl. Fig. S6). Molar N/C ratios show different patterns throughout the Holocene. The CHU record displays relatively stable and low N/C ratios, whereas N/C ratios of BC and BT cores are more variable with similar values between ca. 9 and 5.5 kyr BP (Fig. 4c).
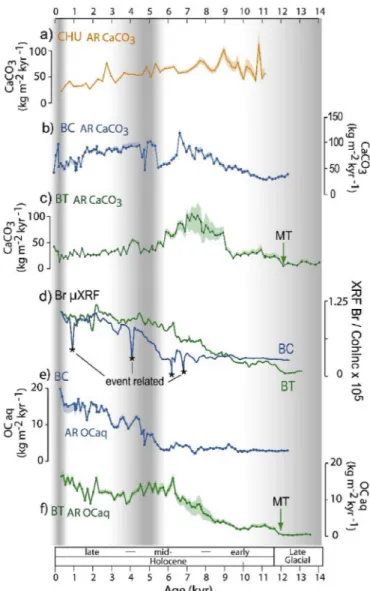
4.4. Holocene accumulation rates (AR) 4.4.1. Total organic carbon
The studied cores show differences in OC accumulation rates. During the early Holocene, the CHU record is characterized by the highest AR OC (25–35 �5 kg m 2 kyr 1), 2–3 times higher than the other two cores (Fig. 5a). The BC record shows relatively stable AR OC (Fig. 5b), while the BT record is characterized by the rapid increase in AR OC between ca. 12.0–11.6 kyr BP from 3 �1 to 11 �3 kg m 2 kyr 1 (Fig. 5c). To- wards the mid-Holocene, AR OC in CHU decreases in 7 �2 kg m 2 kyr 1 (Fig. 5a), while the BT record shows a net increase in AR OC of 9 �2 kg m 2 kyr 1.
4.4.2. Terrestrial organic carbon
During the early Holocene, BC and BT records indicate predominant accumulation of OCterr (Fig. 6a–b) and relatively high Ti concentrations (Fig. 6c). Throughout the mid-Holocene, Ti contents and AR OCterr decrease in BT record, while in BC core the decrease in the Ti contents after 7.5 kyr BP occurred together with relatively stable AR OCterr
around 7.5 �0.5 kg m 2 kyr 1 (Fig. 6). Coarse bioclastic and siliciclastic depositional events occurred during the mid-Holocene in the BT and BC cores and they may have had a further influence on sedimentation dy- namics in the records. Particularly in the BT core, the deposition of a coarse layer at 7.05 kyr BP was followed by an increase in AR OCterr. The onset of the Neoglacial period is characterized by the decrease of AR OCterr and Ti/Al ratios in BC and BT records (Fig. 6 and Suppl. Fig. S8).
4.4.3. Biogenic carbonate and aquatic-marine organic carbon
The three sites show an increment in AR CaCO3 during the early Holocene, which continues throughout the first half of the mid-Holocene in the BC and BT records (Fig. 7a, b and 7c). The rise of AR CaCO3 in the BT core ca. 12.2 kyr BP occurred together with the transition from inorganic-rich laminated sediments to sediments with laminations of dark-brown/beige laminae without bioturbation as well as the presence of macroscopic iron sulfide concretions and high Fe and Mn content.
(Suppl. Fig. S7b).
During the mid-Holocene, AR CaCO3 of CHU record decreases from 100 �9 to 59 �2 kg m 2 kyr 1, while BT and BC cores are characterized by a net increase in AR CaCO3 of 70 kg m 2 kyr 1 between ca. 9.5 and
ca. 6.5–7 kyr BP. In the second half of the mid-Holocene, AR CaCO3 in BC decreases in similar magnitude as BT, but increases abruptly between 5.5 and 5.3 kyr BP followed by an increment in N/C ratios (Fig. 6a) and Br contents, which are reflected in the rise of AR OCaq (Fig. 7d and e).
Thereafter, the three records show an overall decrease of AR CaCO3, which reached a minimum before 0.3 kyr BP. The AR OCaq in BT record rise gradually until ca. 6.5 kyr BP and decrease slightly after ca. 5.5 kyr BP (Fig. 7f).
5. Discussion
5.1. Holocene sedimentation rates
Sedimentation rates (SR) in fjord basins depend on the supply of siliciclastic components, allochthonous OCterr from local catchment areas and local productivity within the water column (Cui et al., 2016;
Bertrand et al., 2012, 2014; Harada et al., 2013; Lamy et al., 2010;
Rebolledo et al., 2015, 2019). Moreover, open fjord systems may also receive a long-distance terrestrial sediment supply (>100 km), often depending on wind-induced surface currents or freshwater runoff within the fjord water surface layer. In particular, glacier sediment discharges can provide extended clay plumes as a major source of allochthonous siliciclastic input (Breuer et al., 2013a; Kilian et al., 2017). Regional and inter-basin variability in Holocene SR at the three sites investigated here suggest that long-distance sediment transport into small enclosed basins either plays no significant role or varies from basin to basin.
The relative contribution of terrestrial and aquatic sediment com- ponents depends on tidal, climatic and morphological characteristics of the fjords (Hinojosa et al., 2014). In particular, both the relationship of Fig. 5. Accumulation rates of organic carbon in the studied cores. Shaded areas indicate 95% confidence interval. Red stars in vertical axes indicate the present- day mean value of AR OC in Patagonian fjords after Smith et al. (2015). a) CHU, b) BC and c) BT. Green arrow indicates the marine transgression (MT) in this record. Vertical shaded areas denote cold periods (Late Glacial, beginning of Neoglacial period and the LIA, Kilian and Lamy, 2012). (For interpretation of the references to colour in this figure legend, the reader is referred to the Web version of this article.)
local and/or regional catchments and the areal extent of related basins affect sedimentation and individual accumulation rates of the distinct components (Cui et al., 2017; Smeaton and Austin, 2017; Smeaton et al., 2017). Fjord basins within well definable catchments, as used in this study, have the advantage that past changes in land surface properties (soil and plant development) as well as Holocene coastline evolution can be better constrained.
One of the previous studies on Holocene sediments from the Pacific side of the Magellan fjord region comes from a 560 m deep site near Cape Pilar (core PC-03; Harada et al., 2013, Fig. 1b). This core is mainly composed of siliciclastic allochthonous sediments and is characterized by high early Holocene SR, but very low SR during the Neoglacial after 5.5 kyr BP. Higher values in the early Holocene have also been reported from shallow bays (<100 m WD; TM1, Palm2 and Par1; Fig. 1b) within the fjord system of the western Strait of Magellan (Kilian et al., 2007b;
Lamy et al., 2010).
Among the newly investigated sediment cores, only the CHU record shows significantly higher early Holocene SR compared to the late Ho- locene, whereas the sediment cores BT and BC, located ~100 km north- northwest of CHU and closer to the Pacific coast, show a general subtle
increase in SR throughout the Holocene. Relatively higher SR between 8 and 7 kyr BP in the BT record might be related to the deepening of the basin due to the ongoing marine transgression (MT). The shallower sill at this site probably causes a higher sensitivity of the sedimentation dynamics to sea-level changes compared to the other two sites.
Since the glacial retreat in the western Strait of Magellan occurred before ca. 16 kyr (Kilian et al., 2007b), we suggest that the generally higher early Holocene SR observed at many sites (TM1, PAR1, PC-03, Palm2 and CHU; Fig. 1b) may be attributed to a strong input of silici- clastic material and OCterr from the surrounding land areas due to extremely high early Holocene precipitation rates (Lamy et al., 2010, Fig. 5d–h) as well as associated outwash of unconsolidated glacial detritus deposited during the Late Glacial (Breuer et al., 2013a). A possible explanation for the comparatively lower early Holocene SR at BC and BT sites is that the coastal area, apart from the ice caps in the inner fjords, may have had less availability of unconsolidated glacial material and less variable precipitation rates between early and late Holocene. Since there is less correlation between wind strength and precipitation in the borders of the SWW and towards the open Pacific Fig. 6. Proxies of terrigenous input to the study sites. a) N/C ratios of BC and
BT cores. Note the inverted scale. b) Accumulation rates of terrestrial carbon in core BC. c) Accumulation rates of terrestrial carbon in core BT. d) AAS cali- brated XRF scanner of the matrix corrected Ti cps expressed as wt% of TiO2 in BC and BT cores. The star indicates high Fe content in BT sediments (Suppl.
Fig. S7b). e) Particle size distribution in BT core. White arrows indicate extreme depositional events. Vertical shaded areas denote cold periods (Late Glacial, beginning of Neoglacial period and LIA, Kilian and Lamy, 2012).
Fig. 7.Proxies of aquatic productivity at the studied sites. a), b), and c) Accumulation rates (AR) of CaCO3 in CHU, BC and BT cores, respectively. d) Matrix-corrected XRF Br cps of BC and BT cores. Black stars indicate low values related to single depositional events in BC core. e) Accumulation rates of aquatic organic carbon (OCaq) of BC and f) of BT records. MT ¼ marine transgression. Vertical shaded areas denote cold periods (Late Glacial, begin- ning of Neoglacial period and LIA, Kilian and Lamy, 2012).
(Garreaud et al., 2013), changes in strength, width and position of the SWW zone might have less impact on the precipitation rates in this coastal area, which could have hyper-humid climatic conditions during the whole Holocene.
5.2. OCterr supply and vegetation development
The N/C–Ti–Br based mass calculation indicate that the contribution of OCterr to the overall OC range is between 20 and 80 wt% at the BC and BT, with higher values during the early and mid-Holocene compared to the late Holocene. The supply of OCterr depends on the relationship between the areas of vegetation-covered catchment and the sediment basin (Smeaton and Austin, 2017). Additionally, changes in precipita- tion and runoff may also influence the amount of OCterr transported and deposited into fjord and lake basins, partly also during sudden deposi- tional events triggered by earthquakes, volcanic eruptions or extreme precipitation events (Lamy et al., 2010).
In the Magellan region, the terrestrial organic matter supply to lakes and fjord basins started after the Late Glacial ice retreat (Kilian and Lamy, 2012). Pollen records from a lake sediment core of Tamar Island (Fig. 1b) indicate a primary plant succession starting after ~15.5 kyr BP, when glaciers retreated towards the Gran Campo Nevado ice cap located 60 km further east and the establishment of a dense forest vegetation after ~12 kyr BP (Lamy et al., 2010; Kilian et al., 2007b). The amount of pollen from peat-forming plant communities generally increased throughout the Holocene. Besides climate forcing, this can be partly related to long-term plant succession due to soil development and increasing soil thickness (Biester et al., 2003; Lamy et al., 2010; Yu et al., 2010). Next to Tamar Island, a 3 to 5-fold higher AR OCterr during the early Holocene (compared to the mid- and late Holocene) in fjord cores TM1 and Palm2 has been interpreted as reflecting stronger SWW and higher precipitation that significantly increased the OC transport from terrestrial to aquatic systems (Lamy et al., 2010). This interpretation can
be extrapolated to our CHU site, which is characterized by very high AR OC and low N/C ratios during the early Holocene (Fig. 5b). Further evidence for more humid conditions and stronger terrestrial input, and probably a more brackish environment during the early Holocene in Churruca fjord comes from high contributions of freshwater diatoms and the occurrence of chrysophyte cysts (C. Lange, unpublished data).
Moreover, the OC input from terrestrial sources could have been enhanced at the CHU site by the transport from the nearby shallow Brazo Le�on, which turned into a fluvial system as an additional catchment area during times of sea level low stand (Fig. 2a).
5.3. Marine transgression and its effect on water column structure and paleoproductivity
The Late Glacial to Holocene eustatic sea level rise (120 m; Lambeck et al., 2014, Fig. 8a) has significantly controlled the coastline evolution globally. In previously glaciated regions eustatic effects are partly superimposed by e.g. isostatic movements. Moreover, in tectonically active region like the Strait of Magellan, vertical movement in the order of several meters, could also have added to the eustatic and isostatic effects (Bentley and McCulloch, 2005; Breuer et al., 2013b; De Muro et al., 2018). Although the referenced studies provide some elements of the evolution of the coastline in the western Magellan fjord system and formation of terraces since the LGM, their influence on the aquatic en- vironments in terms of development of e.g. stratified/mixed water col- umns and local sedimentary systems have not been considered.
The investigated bays and fjord have sills at different water depths, which may have controlled the timing of the MT and the influence from open Pacific waters, depending on the isostatic uplift rates. Based on the first occurrence of foraminifera and the increase in AR CaCO3 in a coastal sediment core next to Tamar Island (TM1, Fig. 1b), Kilian et al.
(2007a) suggested a first significant MT in the western Strait of Magellan at 14.3 kyr BP. This was probably related to the rapid sea-level rise Fig. 8.a) Global sea level rise (red line; Lambeck et al., 2014) and the hypothetical isostatic adjust- ment curve at BT site. Depth changes at the basin entrance are indicated with vertical blue lines.
MWP1B: Meltwater pulse 1B. Glacial retreat timing from Kilian and Lamy (2012). b) CaCO3 accumula- tion rates at BT site shown with 4 points moving average smoothed curve. Length of vertical blue lines refer to changes in water depths at this site sill.
Sea-level highstands of records from the Pacific Ocean (Chiba et al., 2016; Clement et al., 2016;
Miklavi�c et al., 2018; Yokoyama et al., 2016). (For interpretation of the references to colour in this figure legend, the reader is referred to the Web version of this article.)
during meltwater pulse 1A from 120 to 80 m (Lambeck et al., 2014).
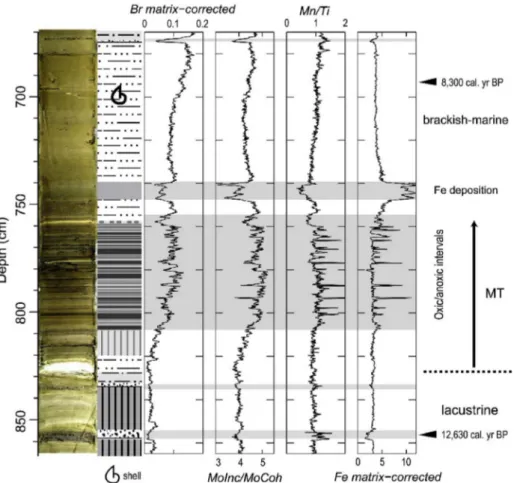
The bay of the BC site has at present a deeper sill (15 m WD) and already shows marine conditions at the base of the record at 13 kyr BP, while the shallower-sill site BT documents the MT at ca. 12.2 kyr BP. This suggests that the MT in both BT and BC sites occurred when the global sea level was 60–70 m lower than at present; therefore the Pacific coastline was isostatically depressed by a similar degree at this time (Fig. 8). The preservation of OC-rich laminae in the BT record between ca. 12.2 and 10.4 kyr BP suggests anoxic conditions at the sediment-water interface during this period. The halocline likely established around 12.2 when the marine water started to enter the basin, while the precipitation rates were high (Lamy et al., 2010). The start of brackish conditions in BT is indicated by the increase of AR of CaCO3 and OCaq and XRF Br content (Fig. 7). After ca. 11.7 kyr BP, peaks of Fe and Mn/Ti associated with laminations might be related with alternating sulfidic and oxic water masses since the onset of the MT (Sternbeck and Sohlenius, 1997). The progressive deepening of the BT sill during the early and mid-Holocene has probably resulted in more mixing in the water column. Further establishment of oxic condition in the sediment-water interface is indi- cated by remnants of marine organisms (Chlamys sp. and Desmophyllum sp.; Fig. 9).
Records from the central basin of the Strait of Magellan indicate the increment of aquatic productivity after the MT through the Atlantic entrance (cores JPC67, Bertrand et al., 2017, and MD07/3132, Aracena et al., 2015). In both BT and BC cores from the Pacific coast, AR CaCO3
increased slightly during the early Holocene and reached a maximum between ca. 6.5 and 7 kyr BP (Fig. 7b and c). This could be explained by maximum sill depths at this time and a highest coastline elevation. As illustrated in Fig. 8, we suggest that the rates of eustatic rise were higher than the isostatic uplift rates causing a deepening of the sills and increased sea water intrusion into the bays reaching a maximum around 7 kyr BP. Afterwards, the eustatic sea-level stabilized on a global scale,
while the local isostatic uplift may have continued slightly. This again could have caused shallower sills at the BT and BC sites reducing the marine influence in the second half of the Holocene. This is e.g., indi- cated by the decrease in AR CaCO3 (Fig. 7b and c). The long-term decrease of AR CaCO3 since ca. 7 kyr BP could have been related in general to paleoproductivity changes due to Neoglacial glacier advances and related cold melt water discharge, a reduced degree of MT as dis- cussed above or phases of precipitation-related surface water freshening.
The higher sensibility to sea-level changes at BT site might be indicated by the increase in AR CaCO3 around 4 kyr BP, which could be related with the sea-level highstand documented in other areas of the Pacific Ocean (Fig. 8; Chiba et al., 2016; Clement et al., 2016; Miklavi�c et al., 2018; Yokoyama et al., 2016).
Holocene variations in the relative abundance of carbon from different sources in fjord sediments respond to changes in oceanography and sea-level (Knies, 2005; Moossen et al., 2013). At the studied sites, AR CaCO3 are affected by the enhanced input of marine nutrients by an increasing degree of MT, which is a plausible explanation for the increment in productivity. Cuevas et al. (2019) report that chlorophyll-a concentration within the water column is favored by oceanic nutrients in southern Patagonia. Carbonate producer organisms, in particular benthic foraminifera (Pawłowska et al., 2017) have a range of pH tolerance that varies from species to species. Laboratory culture exper- iments indicate that salinity induced pH changes affect calcification and reproduction in benthic foraminifera. The response to salinity changes is not linear, but with salinities <20 psu the reproduction rate is <3% and salinities <10 psu cause the death of specimens preceded by dissolution of the entire test (Saraswat et al., 2011).
Overall accumulation rates of OC in BC and BT are lower than in the CHU record, but still in the same order of magnitude. Our estimates range between 7.5 and 36.2 g m-2 y-1, which are comparable with values published from Scotland (3.0–32.1 g m-2 y-1; Smeaton et al., 2016) and
Fig. 9. Marine transgression in BT record. Photographic mosaic, core description (Suppl. Fig. S4), and XRF proxies (see section 5.3).