behalf of Association for the Sciences of Limnology and Oceanography.
doi: 10.1002/lno.11639
Organic matter composition and heterotrophic bacterial activity at declining summer sea ice in the central Arctic Ocean
Judith Piontek,
1,2Luisa Galgani ,
1,3Eva-Maria Nöthig,
4Ilka Peeken,
4Anja Engel
1*
1Biological Oceanography, GEOMAR Helmholtz Centre for Ocean Research Kiel, Kiel, Germany
2Biological Oceanography, Leibniz Institute for Baltic Sea Research Warnemünde, Rostock, Germany
3Department of Biotechnology, Chemistry and Pharmacy, Center for Colloid and Surface Science (CSGI) at the University of Siena, Siena, Italy
4Alfred Wegener Institute, Helmholtz Centre for Polar and Marine Research, Bremerhaven, Germany
Abstract
The Arctic Ocean is highly susceptible to climate change as evidenced by rapid warming and the drastic loss of sea ice during summer. The consequences of these environmental changes for the microbial cycling of organic matter are largely unexplored. Here, we investigated the distribution and composition of dissolved organic matter (DOM) along with heterotrophic bacterial activity in seawater and sea ice of the Eurasian Basin at the time of the record ice minimum in 2012. Bacteria in seawater were highly responsive to fresh organic matter and remineralized on average 55% of primary production in the upper mixed layer. Correlation analysis showed that the accumulation of dissolved combined carbohydrates (DCCHO) and dissolved amino acids (DAA), two major components of fresh organic matter, was related to the drawdown of nitrate. Nitrate-depleted surface waters at stations adjacent to the Laptev Sea showed about 25% higher concentrations of DAA than sta- tions adjacent to the Barents Sea and in the central Arctic basin. Carbohydrate concentration was the best pre- dictor of heterotrophic bacterial activity in sea ice. In contrast, variability in sea-ice bacterial biomass was largely driven by differences in ice thickness. This decoupling of bacterial biomass and activity may mitigate the nega- tive effects of biomass loss due to ice melting on heterotrophic bacterial functions. Overall, our results reveal that changes in DOM production and inventories induced by sea-ice loss have a high potential to enhance the bacterial remineralization of organic matter in seawater and sea ice of the Arctic Ocean.
The Arctic is highly sensitive to anthropogenic changes in climate forcing and has warmed about two times faster than the global average over recent decades (Arctic Climate Impact Assessment 2004). Sea-ice loss is a sensitive indicator of cli- mate change that coincides with other consequences like tem- perature anomalies in the Atlantic inflow and a weakening of the halocline in the eastern Eurasian Basin, referred to as
“Atlantification”(Quadfasel et al. 1991; Polyakov et al. 2017).
There is growing evidence for increasing phytoplankton pro- ductivity in the Arctic Ocean. Based on satellite observations,
it has been estimated that Arctic net primary production increased by 30% between 1998 and 2012 mainly due to reduced ice concentration and longer growing seasons (Arrigo and van Dijken 2015). For the Eurasian Basin, estimates derived from the 14C-bicarbonate method (Steemann Niel- sen 1952) combined with an irradiance-based model revealed a doubling of net primary production between 1982 and 2012 (Fernández-Méndez et al. 2015). Little is known about the effects of ongoing environmental changes on the heterotro- phic recycling of organic matter in the Arctic Ocean. The main proportion of oceanic carbon remineralization is carried out by heterotrophic bacteria that, consequently, largely drive the respiratory flux of CO2 from the ocean back to the atmo- sphere. The low temperatures in Arctic seawater slow down enzymatic reactions and can affect the integrity and function- ality of bacterial cell membranes (Feller and Gerday 2003).
Yet, low seawater temperature per se does not prevent hetero- trophic bacterial activity and many studies demonstrated an active microbial loop in the polar oceans (e.g., Yager and Deming 1999). Recent studies identified the availability of reactive organic matter as a major factor regulating bacterial
*Correspondence: aengel@geomar.de
This is an open access article under the terms of the Creative Commons Attribution License, which permits use, distribution and reproduction in any medium, provided the original work is properly cited.
Additional Supporting Information may be found in the online version of this article.
Special Issue:Biogeochemistry and Ecology across Arctic Aquatic Ecosys- tems in the Face of Change. Edited by: Peter J. Hernes, Suzanne E. Tank and Ronnie N. Glud
activity in cold oceans (Kirchman et al. 2009; Ducklow et al. 2012; Piontek et al. 2015). In particular, the availability of fresh, reactive dissolved organic matter (DOM) derived from phytoplankton exudates, sloppy feeding and viral lysis of phytoplankton cells drives the coupling between heterotro- phic bacterioplankton and phytoplankton (Carlson and Hansell 2014). Source-specific optical and chemical properties of DOM revealed that the surface Arctic Ocean contains a complex DOM mixture that originates from inflowing Atlantic and Pacific waters, river runoff, and intense primary produc- tion in the summer season (Kattner et al. 1999; Gonçalves- Araujo et al. 2018). Additionally, melting sea ice provides a strong seasonal pulse of DOM into seawater that is used effi- ciently by bacterial communities in the surface Arctic Ocean (Niemi et al. 2014; Holding et al. 2017; Underwood et al. 2019).
In general, turnover times of organic compounds in seawater are largely dependent on their molecular weight and structural complexity. Labile DOM in the surface ocean is remineralized within hours to days and pools do not exceed nanomolar con- centrations. About 15–20% of the net community production in marine systems consist of semi-labile compounds with turnover times of weeks to months that accumulate in the upper mixed layer during the productive season (Carlson and Hansell 2014). Important components of labile and semi-labile organic matter are carbohydrates, amino acids, and their poly- mers that are produced during phytoplankton blooms and preferentially utilized by heterotrophic bacteria (Engel et al. 2011; Catalá et al. 2016; Sperling et al. 2017). Besides the chemical properties of the substrate molecules, the efficiency of bacterial organic matter remineralization may be cod- etermined by genetic capabilities for the synthesis of enzymes involved in hydrolysis and metabolization. Although enzy- matic hydrolysis and subsequent uptake of organic com- pounds are considered as redundant functions in bacterial communities, Arctic bacterioplankton showed a small spec- trum of polysaccharide-cleaving enzymes that may hamper the access to semi-labile DOM (Arnosti et al. 2011).
This study explores the spatial distribution of DOM along with heterotrophic bacterial activity in the marginal ice zone and the fully ice-covered part of the Eurasian Basin. The sam- pling took place during summer 2012, when the Arctic sea ice coverage shrank to the minimum of 3.4×10⁶km2(Parkinson and Comiso 2013). Concentrations of particulate and dis- solved organic carbon and nitrogen, as well as concentrations and composition of carbohydrates and amino acids, were ana- lyzed. Furthermore, rates of heterotrophic bacterial activity were determined to better characterize the cycling of fresh material in seawater and sea ice. The coupling of heterotro- phic bacterial activity to the production and accumulation of organic matter in seawater and sea ice is investigated and potential effects of sea-ice loss on bacterial organic matter recycling in a warmer and fresher future Arctic Ocean are discussed.
Material and methods
Seawater sampling
Samples were collected at 28 stations during the cruise PS 80 with RV Polarstern from 02 August 2012 to 08 October 2012 (Fig. 1). On 16 September 2012, the Arctic sea ice reached a record minimum extent of 3.4 million km2 (Parkinson and Comiso 2013). Stations were located between 77.4N to 88.8N and 17.8E to 133.3E in the Amundsen and Nansen Basin. Nineteen stations were located in the marginal ice zone of the Eurasian Basin, 7 of which adjacent to the Barents Sea, 2 adjacent to the Kara Sea, and 10 adjacent to the Laptev Sea (Fig. 1A). Four stations with 90–100% ice concen- tration were sampled in the central Arctic Basin north of 86N. Furthermore, five stations were sampled at the shelf break. Two were located at the Barents Sea shelf break and three at the shelf break of the Laptev Sea (Fig. 1A). At each sta- tion, seawater was sampled at 3–6 depths in the upper 150 m of the water column using a rosette sampler equipped with 24 Niskin bottles. Additionally, 21 samples were collected at 500–3000 m depth. Deep-sea water was sampled at Sta. 383 and 396 in the Barents Sea sector, at Sta. 244 in the Kara Sea sector, at Sta. 263 and 341 in the Laptev Sea sector, and at Sta. 377 and 380 in the central Arctic Basin (Fig. 1A). The CTD-system was used to determine continuous depth profiles of temperature and salinity. Furthermore, a sensor for chlorophylla(Chla)fluorescence was mounted. Data on sea- water temperature, salinity, fluorescence, inorganic nutrient concentrations, and primary production used in this study can be retrieved from the PANGAEA database (Rabe et al. 2012;
Bakker 2014; Fernández-Méndez et al. 2014).
Sea-ice sampling
Sea-ice samples were obtained at eight stations referred to as Ice1 to Ice8 (Fig. 1A). Sea-ice cores were collected with a Mark II Coring System (9 cm inner diameter, Kovacs Enter- prises, Roseburg, Oregon, U.S.A.). First-year ice and multiyear ice were distinguished by length and physical properties of the ice cores (Nicolaus et al. 2012; Fernández-Méndez et al. 2015). First-year ice was sampled at ice stations 1–6, while ice stations 7 and 8 were covered with multiyear ice. Ice cores were cut into sections of 10–20 cm length. Each section was vertically split with a band saw into subsamples of equal volume. For the analysis of bacterial thymidine and leu- cine uptake, subsamples of each section were melted in 180 mL autoclaved artificial seawater of salinity 35 to prevent the effects of osmotic shock. Depending on the length and the density of the sea-ice section, the ratio of melted sea-ice sample to artificial seawater (volume : volume) ranged from 1 : 0.6 to 1 : 2.6. A second subsample of each ice section was melted without the addition of artificial seawater for measure- ments of bulk salinity, the analyses of carbohydrates and amino acids and bacterial cell enumeration (Rintala et al. 2014).
Bulk salinity was measured using a conductivity meter (WTW
3300i, Xylem Analytics Germany Sales GmbH & Co. KG, WTW, Weilheim, Germany).
Melt pond sampling
At five out of the eight ice stations melt ponds could be sampled. Surface-water samples were manually collected from three to eight melt ponds per station for the analysis of amino acids, bacterial cell numbers, thymidine, and leucine uptake.
Analysis of Chla
To determine the Chla concentration, 1–2 L of seawater were filtered onto Whatman GF/F-filters. Filters were trans- ferred into liquid nitrogen and kept at−80C for later analysis by high-performance liquid chromatography (HPLC). Thefil- ters were homogenized for 20 s with 50μL internal standard (canthaxanthin), 1.5 mL acetone and small glass beads in a Precellys® tissue homogenizer. The internal standard is used to correct for solvent and sample loss. Homogenized filters were centrifuged and the supernatant was filtered through a 0.2μm PTFE filter (Rotilabo). An aliquot of 100μL was trans- ferred to the auto sampler and mixed with 1 mol L−1ammo- nium acetate solution (ratio 1 : 1) just prior to injection into the HPLC system. Pigments including Chla were then mea- sured by reverse-phase HPLC using a Waters 600 controller equipped with a VARIAN Microsorb-MV3 C8 column (4.6×100 mm). Solvent A consisted of 70% methanol and
30% 1 mol L−1 ammonium acetate, and solvent B of 100%
methanol. The gradient was modified after Barlow et al. (1997).
Eluted pigments were detected by absorbance (440 nm) and fluorescence (excitation: 410 nm, emission: > 600 nm). Chla was identified by comparing its retention times with those of Chlastandards (Sigma) and the online diode array absorbance spectra between 390 and 750 nm stored in the library. Chla concentrations were quantified based on peak areas of external standards, which were spectrophotometrically calibrated using extinction coefficients published by Bidigare (1991) and Jef- frey et al. (1997).
Analysis of organic carbon and nitrogen
Particulate organic carbon (POC) and nitrogen (PN) in sea- water were determined by filtering 0.5–1.0 L of seawater at low vacuum (~ 200 mbar) onto precombusted (4 h at 500C) Whatman GF/F filters. After filtration, filters were stored at
−20C until analysis. Before analysis, filters were soaked in 0.1 mol L−1HCl for removal of inorganic carbon and dried at 60C. POC and PN concentrations were determined with a Carlo Erba CHN elemental analyzer.
For the analysis of dissolved organic carbon (DOC) and total dissolved nitrogen (TDN), 20 mL of seawater werefiltered through precombusted glassfiberfilters (GF/F, Whatman) into precombusted glass ampoules. Samples were acidified by addi- tion of 20μL 30% hydrochloric acid. Ampoules were sealed by Fig 1.Sea-ice conditions and hydrography in the study area. (A) Ice map with stations of seawater and sea-ice sampling (BSB, Barents Sea shelf break;
BSS, Barents Sea sector; KSS, Kara Sea sector; LSB, Laptev Sea shelf break; LSS, Laptev Sea sector; CB, Central Arctic Basin). (B) Temperature-salinity dia- gram of seawater sampled in different regions and depth intervals. Color code according to panel (A).
flame and stored at 0–4C. Samples were analyzed by the high-temperature catalytic oxidation method (TOC-VCSH, Shimadzu) (Sugimura and Suzuki 1988; Qian and Mop- per 1996). The instrument was equipped with a TNM-1 detec- tor (Shimadzu) for the simultaneous analysis of TDN. To estimate concentrations of dissolved organic nitrogen (DON), concentrations of inorganic nitrogen were subtracted from TDN. The concentration of total organic carbon (TOC) was determined by summation of POC and DOC concentrations.
Analysis of carbohydrates and amino acids
Concentration and composition of combined carbohy- drates and amino acids were determined in seawater and melted sea-ice samples. Additionally, amino acids were ana- lyzed in melt pond samples. Samples for both components were collected in precombusted glass vials (450C for 8 h) and stored frozen at−20C. Seawater and melt-pond samples were filtered through a 0.45μm syringefilter (Acrodisk, Pall Corpo- ration), while melted sea-ice samples were collected without prefiltration.
Analysis of combined carbohydrates was conducted by high-performance anion exchange chromatography coupled with pulsed amperometric detection (ICS 3000, Dionex) using a CarboPac PA10 analytical column (Dionex). For preparation, samples were desalinated using a dialysis membrane with a 1 kDa molecular-weight cutoff (Spectra Por, Spectrum). This desalination procedure excludes carbohydrates < 1 kDa from analysis. After desalination, samples were hydrolysed with 1 mol L−1hydrochloric acid and subsequently neutralized by acid evaporation under dinitrogen atmosphere and the addi- tion of ultrapure labwater. A detailed description is given in Engel and Händel (2011). Concentrations of the neutral sugars fucose, rhamnose, arabinose, galactose, glucose, and man- nose/xylose were determined. Mannose and xylose coeluted and were, therefore, quantified as a mixture. In addition to neutral sugars, concentrations of the amino sugars glucos- amine and galactosamine as well as of the acidic sugars glucuronic acid and galacturonic acid were analyzed. The sum concentration of all individual neutral sugars, amino sugars, and acidic sugars is given in monomer equivalents per liter.
As seawater samples were prefiltered, the sum concentra- tions represent the pool of dissolved combined carbohydrates (DCCHO). The carbon-normalized yield of DCCHO (%DOC) in seawater was calculated by
DCCHOð%DOCÞ= DCCHO−C=DOC×100
where DCCHO-C is the summed carbon concentration in all measured carbohydrates. It was calculated by multiplying the monomer concentration of each sugar with the respective number of carbon atoms and subsequent summation.
As sea-ice samples were not prefiltered, the sum concentra- tion of individual sugars corresponds to total combined carbo- hydrates in sea ice, referred to as TCCHO.
Analysis of amino acids was carried out by HPLC after hydrolysis with 6 mol L−1hydrochloric acid at 100C for 20 h, neutralization and derivatization with ortho-phthaldialdehyde (Lindroth and Mopper 1979). The HPLC system (Agilent 1260) was equipped with a C18 column (Phenomenex Kinetex). Con- centrations of aspartate, glutamate, serine, glycine, threonine, arginine, alanine, γ-aminobutyric acid, tyrosine, valinine, iso- leucine, phenylalanine, and leucine were detected. The sum concentration of all individual amino acids is given in mono- mer equivalents per liter. As seawater and melt-pond samples were prefiltered, the sum concentrations represent the pool of dissolved amino acids (DAA). The carbon-normalized yield of DAA (%DOC) in seawater was calculated by
DAAð%DOCÞ= DAA−C=DOC×100
where DAA-C is the summed carbon concentration in all mea- sured amino acids. It was calculated by multiplying the mono- mer concentration of each amino acid with the respective number of carbon atoms and subsequent summation.
As sea-ice samples were not prefiltered, the sum concentra- tion of individual amino acids corresponds to total amino acids (TAA).
Bacterial cell numbers
Samples of seawater, melt ponds, and melted sea ice were fixed on board with glutaraldehyde at 2% final concentration and stored at −20C until analysis by flow cytometry (FACSCalibur, Becton Dickinson) within 3 months after the cruise. Bacterial cells were counted after staining with the DNA-binding dye SybrGreen I (Invitrogen). Two populations with high nucleic acid and low nucleic acid content, respec- tively, could be distinguished by differences in fluorescence intensity. Cell numbers were estimated after visual inspection and manual gating of the populations in the cytogram using the software CellQuest Pro (Becton Dickinson). Fluorescent latex beads (Polyscience, Becton Dickinson) were used to nor- malize the counted events to volume.
Cell numbers of sea-ice bacteria were converted into bacte- rial biomass using a mean carbon content of 0.03 pg C bacterium−1as determined by Gradinger and Zhang (1997) for Arctic pack ice.
Bacterial thymidine and leucine uptake
Rates of thymidine and leucine uptake were determined in seawater, melt ponds, and melted sea-ice samples to investigate heterotrophic bacterial activity. Thymidine is incorporated into newly synthesized DNA and its uptake rate is a measure for cell multiplication. Leucine is used for the build-up of new cellular proteins and the uptake rate can be used to estimate bacterial biomass production. Uptake rates were determined using tritium-labeled tracers.3H-thymidine and3H-leucine with spe- cific activities of 70 Ci mmol−1 and 100 Ci mmol−1, respec- tively, were added to separate incubations.
For seawater and melt ponds, 1.5 mL of sample were incu- bated with3H-thymidine and 3H-leucine at 10 nmol L−1and 20 nmol L−1 final concentration, respectively. Triplicate sam- ples were incubated along with a poisoned control for 3–8 h close to in situ temperature. Incubation times were adjusted for the individual stations based on the sensor-derived Chla fluorescence that was determined during the CTD cast. Samples were processed by the centrifuge method according to Smith and Azam (1992). Briefly, samples were centrifuged at 14,000×gafter the addition of cold 5% trichloroacetic acid to obtain a cell pellet that was afterward washed twice with cold 5% trichloroacetic acid. Incorporation into the trichloroacetic acid-insoluble fraction was measured by liquid scintillation cou- nting after resuspension of the cell pellet in scintillation cock- tail (Ultima Gold AB, Perkin Elmer). The bacterial biomass production in seawater samples was estimated from leucine uptake applying the conversion factor of 1.5 kg C mol leucine−1, assuming no intracellular isotope dilution (Simon and Azam 1989). The bacterial carbon demand in seawater was estimated assuming a bacterial growth efficiency of 20% (del Giorgio and Cole 1998). Thymidine uptake was converted into cell production using the factor 1.3× 10¹⁸cells mol thymidine−1(Riemann et al. 1990).
The Q10factor for leucine and thymidine uptake was deter- mined from a subset of 29 seawater samples. For each sample, two series of three replicate samples were spiked with the radioactive tracers as described above and placed at 0C and 4C, respectively, for equal incubation times. The Q10factor was then estimated by
Q10=ðR4=R0Þ2:5
whereR4andR0are the rates determined at 4C and 0C, respec- tively. The ratio R4/R0was derived from the slopes of regression lines of rates at 0C against rates at 4C.
Sea-ice samples melted in artificial seawater (see above) were spiked with 3H-thymidine and 3H-leucine at final con- centrations of 20 nmol L−1 and 40 nmol L−1, respectively.
Melted samples of two to five ice-core segments with similar thickness were pooled with equal proportions, resulting in incubations for the top, middle, and bottom part of the ice core. Duplicates were incubated for 13–21 h at 0C along with a poisoned control. After incubation, samples were fil- tered onto 0.2 μm polycarbonatefilters (Millipore) that were rinsed two times with 5 mL cold 5% TCA. Filters were placed in a scintillation vial and radio-assayed after the addition of scintillation cocktail (Ultima Gold AB, Perkin Elmer). To derive rates per sea-ice volume, the rates deter- mined for sea-ice samples melted in artificial seawater were multiplied with the factor d to correct for the dilution according to
d=vm=ðvm−vASWÞ
wherevmis the total volume after sea-ice melting (mL) andvASWis the volume of added artificial seawater (ASW) (mL). Bacterial bio- mass production in sea ice was estimated from thymidine uptake using conversion factors of 2.09×10¹⁸cells mol thymidine−1 and 0.03 pg C bacterium−1 (Smith and Clement 1990; Gradinger and Zhang 1997).
Statistical analysis
Differences in organic matter concentrations, bacterial abundance, and activity between the investigated areas of the Eurasian Basin were tested for significance by ANOVA on ranks combined with post hoc Mann–Whitney rank sum test. Differ- ences between samples collected at ≤40 m and at 41–150 m were tested by the Wilcoxon rank sum test for the individual sampling areas Barents Sea sector, Laptev Sea sector, and central Arctic Basin. Significance was accepted forp< 0.05.
Principal component analysis (PCA) was conducted with the R packages FactoMineR for analysis and Factoextra for visualization (Lê et al. 2008).
Results
Hydrographic characteristics of sampling regions
Seawater samples can be assigned to different water masses of the Arctic Ocean based on temperature and salinity charac- teristics according to Rudels (2009) (Fig. 1B). Highest salinities up to 34.9 were measured at 10–40 m depth at the Barents Sea shelf break and in the adjacent Barents Sea sector, indicating Atlantic Water inflow from the Norwegian Sea into the Arctic Ocean. Surface salinity (≤10 m) was reduced to 31.9–33.8 at stations located close to the ice margin (Sta. 201, 209, 214, and 215) (Fig. 1A,B). Profiles of Sta. 214 and 215 in the Barents Sea sector showed enhanced water column stratification and a thin upper mixed layer of about 15 m depth (Supporting Information Fig. S1). Samples collected at 0–40 m in the Laptev Sea sector and in the central Arctic Basin reveal temper- ature and salinity characteristics of the Polar Mixed Layer that develops during progressive heat exchange with the atmo- sphere and freshening by river runoff. The water column of stations located at the Laptev Sea shelf break and beyond in the Laptev Sea sector was strongly stratified with a mixed layer depth of about 20–30 m (Supporting Information Fig. S1). Sur- face samples of three stations located at the Laptev Sea (Sta.
298, 311, 316) showed typical features of Laptev Sea Shelf Water with salinities of 28.0–30.9 in coincidence with high temperatures of 2.5–3.1C (Fig. 1A,B). Most samples collected at 41–150 m represent upper and lower halocline water with negative temperatures at salinities of 33.3–34.5 in all investi- gated regions (Fig. 1B).
Organic matter in seawater
Comparing the sampling regions in the Eurasian Basin rev- ealed no spatial differences in POC and PN concentrations.
POC : PN ratios ranged from 5.1 to 9.7 and were similar in all
investigated regions. POC concentrations were significantly higher in the upper water column than at 41–150 m depth in the Laptev Sea Sector (Mann–Whitney ranked sum test, p= 0.0001) but not in the other regions. PN concentrations in the upper (≤40 m) and lower (41–150 m) water column were similar in all regions of the Eurasian Basin. The contribution of POC to TOC showed a broad range from 3.3% to 22.8%
without significant differences between Barents Sea sector, Laptev Sea sector, and central Arctic Basin (Table 1).
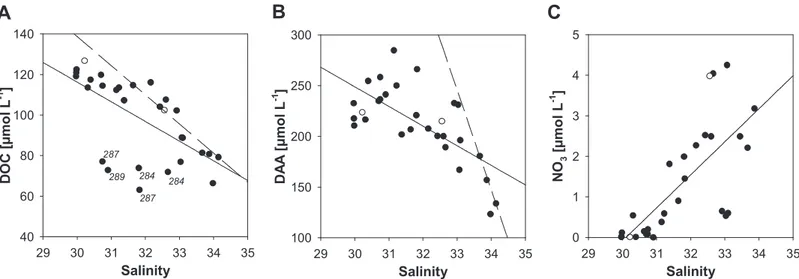
Concentrations of DOM revealed spatial variability within and between the sampling regions (Table 1). Within the sam- pling regions, highest variability was determined in the upper water column (≤40 m) of the Barents Sea sector. Concentra- tions of DCCHO and DAA significantly decreased with depth in the Laptev Sea Sector and the central Arctic Basin, while the upper and lower water column in the Barents Sea sector showed similar concentrations (Table 1). A comparison of the different sampling areas in the Arctic Basin revealed significantly higher DOC and DAA concentrations in the upper water column of the Laptev Sea sector compared to the Barents Sea sector (Table 1) (ANOVA on ranks,p< 0.05; post hoc Mann–Whitney rank sum test,p≤0.001). Concentrations of both constituents were inversely related to salinity in the upper 40 m of the Laptev Sea sector (Fig. 2). Three stations located close to the ice margin in the Laptev Sea sector (Sta. 284, 287, and 289) showed larger deviations of DOC concentrations from the regression line that were likely induced by freshening of surface waters by intense sea-ice melting. Theoretical dilution lines for DOC and DAA were derived from concentrations published for the Lena River by Lara et al. (1998) combined with concentrations deter- mined at maximum salinity in the Laptev Sea sector in this study. The dilution line of DOC deviates only slightly from the regression line. In contrast, the extrapolated DAA concentra- tion of 830 nmol L−1 for the freshwater endmember is far below DAA concentrations in the Lena delta (average DAA con- centration 3.5μmol L−1; Lara et al. 1998) (Fig. 2).
Across all sampling regions and depths, concentrations of DCCHO and DAA were inversely related to nitrate concentra- tions (Fig. 3A). The correlation coefficients further increased when samples collected in the Barents Sea sector and across the Barents Sea shelf break were not included. No such rela- tionship was determined for silicate and DCCHO and DAA concentrations, respectively (Fig. 3B).
On average, 2.8% and 0.8% of DOC in the upper 150 m of the water column were contained in DCCHO and DAA, respectively. These fractions were reduced to 2.2% and 0.4%
for DCCHO and DAA, respectively, in deep ocean samples col- lected at 500–3000 m (Table 1). The molecular composition shows that DCCHO were dominated by glucose (22–80 mol%) and mannose/xylose (14–55 mol%). From surface to the deep ocean, seawater became depleted in rhamnose, arabinose, and galacturonic acid and proportions of fucose and galactose were strongly reduced (Table 2). The DAA composition in seawater
was characterized by the dominance of glycine (28–46 mol%) Table1.OrganicmatterandChlaconcentrationsinthesamplingregionsoftheEurasianBasin. Region/ depth DOC (μmolL−1) DON (μmolL−1)DOC:DON DCCHO (nmolL−1) DCCHO (%DOC) DAA (nmolL−1)
DAA (%DOC)
POC (μmolL−1)
POC (%TOC)
PN (μmolL−1)POC:PNChla(mgm−2) ≤40ma,bbb,cc BarentsSea Sector
63(56–153)6.3(3.6–11.6)11.7(5.7–28.6)354(238–1179)2.7(1.3–10.7)165(141–369)0.8(0.4–2.3)8.0(6.0–19.4)10.7(5.0–22.8)1.3(0.9–3.3)7.3(6.3–8.6)10.7(8.4–43.3) LaptevSea Sector 107(63–122)7.9(7.0–10.6)13.0(10.2–17.0)428(269–666)2.3(1.5–4.4)219(167–285)0.7(0.6–1.4)10.2(5.7–24.0)10.5(5.4–17.1)1.8(0.8–3.7)7.4(5.1–9.7)14.2(9.6–16.0) Central Basin
85(66–163)7.4(4.8–8.8)11.9(8.0–25.6)389(237–746)2.9(1.5–5.0)172(152–244)0.6(0.4–1.0)7.9(3.2–16.4)8.9(3.3–16.4)1.3(0.5–2.8)7.3(6.0–8.8)8.4(6.9–10.0) 41–150mb BarentsSea Sector 60(57–74)5.7(2.7–18.2)11.8(3.2–25.3)316(206–888)2.9(1.7–7.9)177(115–344)0.9(0.6–2.0)7.0(3.3–10.1)9.1(5.3–14.8)1.1(0.5–1.6)7.5(6.9–9.3) LaptevSea Sector
73(56–99)6.9(4.7–9.2)12.1(7.2–15.9)273(182–526)2.3(1.4–3.9)137(92–188)0.6(0.4–0.8)6.7(3.7–10.9)7.6(5.1–14.5)1.1(0.4–2.0)7.3(5.8–10.1) Central Basin
70(59–93)7.0(4.3–9.3)11.6(7.0–14.7)271(185–325)2.4(1.6–2.7)138(114–156)0.6(0.5–0.7)6.2(4.4–27.5)8.3(5.1–22.8)1.0(0.7–1.6)7.2(6.6–22.7) 500–3000m57(46–96)7.7(5.3–10.6)8.1(5.9–18.1)226(141–566)2.2(1.6–6.1)83(63–157)0.4(0.3–0.6)NaNaNaNa Themedianisgivenaswellasminimumandmaximumvaluesinparentheses(DOC,dissolvedorganiccarbon;DON,dissolvedorganicnitrogen;DCCHO,dissolvedcombinedcarbohy- drates;POC,particulateorganiccarbon;PN,particulatenitrogen;Na:notavailable).LabelsdenotesignificantdifferencesbetweentheBarentsSeaSector,theLaptevSeaSector,andthe centralArcticBasinasderivedfromANOVAonranksandposthocWilcoxonranksumtest(a:p<0.05forBarentsSeaSectorvs.centralArcticBasin,b:p<0.05forBarentsSeasector vs.LaptevSeasector,c:p<0.05forLaptevSeasectorvs.centralArcticBasin).
that showed increasing proportions with depth. Aspartate, ser- ine, threonine, alanine, and glutamate contributed 9–16 mol
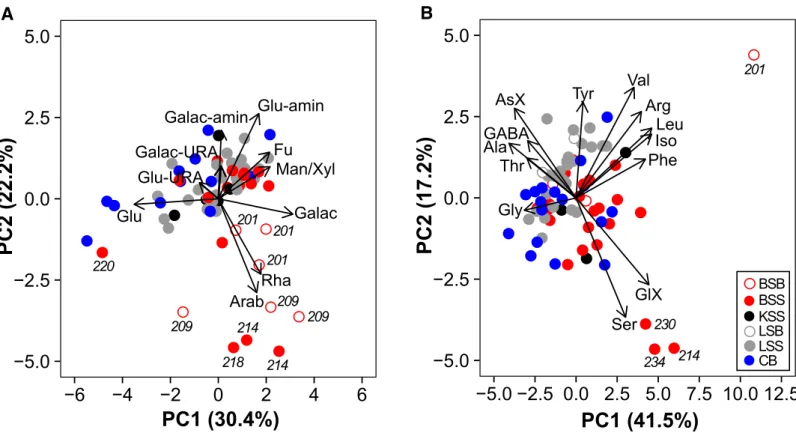
% each to DAA (Table 3). PCA was conducted to test for spatial differences in DCCHO and DAA composition in the upper water column (≤40 m) (Fig. 4). Most samples clustered together, revealing no region-specific DCCHO and DAA com- position. However, PCA of DCCHO composition separated a subset of samples originating from the Barents Sea sector and the Barents Sea shelf break on PC2 (Fig. 4A). Stations 201, 209, 214, and 218, which were located in the transition zone from open waters at the Barents Sea shelf break to the ice margin in the Eurasian Basin, showed higher proportions of rhamnose (8.1 mol%) and arabinose (4.1 mol%), when com- pared with the median of all samples collected at 0–40 m depth (rhamnose: 4.1 mol%, arabinose: 0.9%). PCA revealed also compositional differences in DAA between four samples collected at the Barents Sea shelf break and in the adjacent Barents Sea sector (Sta. 201, 214, 230, and 234) and all other samples. Three out of these four samples were characterized by elevated proportions of glutamate (15 mol%) and serine (17 mol%) compared to the median of all surface samples (glu- tamate: 9 mol%, serine: 10 mol%) (Fig. 4B).
Heterotrophic bacterial activity in seawater and its coupling to phytoplankton production
Uptake rates of leucine ranged from 0.98 to 18.24 pmol L−1h−1and conversion into bacterial biomass pro- duction resulted in 0.01–1.17μg C L−1d−1(Table 4). Bacterial cell production estimated from thymidine uptake ranged from 1.3×10³to 1.6×10⁵cells mL−1d−1(Table 4). Bacterial activ- ity showed significant differences between the sampling
regions in the Eurasian Basin. The bacterial uptake of leucine in the upper water column (≤40 m) was significantly higher at stations in the Barents Sea sector and in the Laptev Sea sec- tor than in the central Arctic Basin, revealing higher bacterial biomass production in the marginal ice zone than in the fully ice-covered part of the Eurasian Basin. Communities in the Barents Sea sector and in the Laptev Sea sector showed similar uptake rates and bacterial cell numbers in surface waters (≤40 m), while rates and abundances at 41–150 m were signif- icantly higher in the Barents Sea sector (Table 4). Ratios of leu- cine to thymidine uptake in the upper water column were significantly higher in the Barents Sea sector than in the Laptev Sea sector and the central Arctic Basin. This indicates higher bacterial protein production relative to DNA synthesis in the Laptev Sea sector and the central Arctic Basin compared to the Barents Sea sector (ANOVA on ranks,p< 0.05; post hoc Mann–Whitney rank sum test,p≤0.05) (Table 4).
Stations in the Laptev Sea sector showed significantly higher Chlaconcentrations than those in the Barents Sea sec- tor and the central Arctic Basin, indicating higher standing stocks of phytoplankton at the time of our study (ANOVA on ranks, p< 0.05; post hoc Mann–Whitney rank sum test, p≤0.05) (Table 1). In order to investigate the coupling between heterotrophic bacteria and phytoplankton, bacterial biomass production was depth-integrated over 50 m to encompass the upper mixed layer and the euphotic zone at all stations. Correlation analysis of log-log transformed data rev- ealed that bacterial production was significantly related to both Chlaconcentrations and primary production (Fig. 5A,B).
Ratios of bacterial production to primary production ranged from 0.03 to 0.23 with a mean ratio of 0.11 (Fig. 5C).
Fig 2.Concentrations of dissolved organic carbon (DOC) (A), dissolved amino acids (DAA) (B), and nitrate (NO3) (C) at≤40 m related to salinity at the Laptev Sea shelf break (open symbols) and in the Laptev Sea sector (closed symbols). Concentrations of DOC and DAA for the freshwater endmember were derived from Lara et al. (1998) to construct the dilution lines (dashed). Regression lines (solid): (A)y=−9.7x+ 407,r2= 0.41,p= 0.0002,n= 29, (B)y=−19.4x+ 830,r2= 0.47,p< 0.0001,n= 29, (C)y= 0.81x−24.5,r2= 0.53,p< 0.0001,n= 29. Numbers given in panel (A) denote stations of seawater sampling.
Assuming a bacterial growth efficiency of 20%, the mean ratio suggests that on average 55% of primary production was remineralized by heterotrophic bacterioplankton on short time scales. Highest ratios of 0.19–0.23 imply that primary production was completely consumed by heterotrophic bacterioplankton at Sta. 201, 234, 333, and 383 and presum- ably no fresh organic matter accumulated in the upper mixed layer at the time of our study. Changes in ratios of bacterial production to primary production were largely driven by changes in primary production. Ratios of bacterial production
to primary production showed the tendency to decrease with increasing primary production, suggesting a lower percentage of bacterial remineralization at stations with intense phyto- plankton growth (Fig. 5C).
An experimental temperature increase from 0C to 4C in short-term incubations of 3–8 h had a consistent positive effect on bacterial leucine and thymidine uptake. Regression lines reveal an increase in leucine and thymidine uptake by a factor of 1.40 (0.04) and 1.29 (0.04) for leucine and thy- midine, respectively (Fig. 5D). This factorial increase at a 4C Fig 3.Concentrations of dissolved combined carbohydrates (DCCHO) (A,B) and DAA (C,D) related to nitrate (NO3) and silicate (SiOH4) concentrations in seawater. Lines are shown for significant regressions. Regression analyses were conducted with the whole data set (solid lines) and without samples col- lected at the Barents Sea shelf break and in the adjacent Barents Sea sector (dashed lines) (BSB, Barents Sea shelf break; BSS, Barents Sea sector; KSS, Kara Sea sector; LSB, Laptev Sea shelf break; LSS, Laptev Sea sector; CB, Central Arctic Basin). (A) All samples:y= −17.2x+ 459,r2= 0.13, p< 0.0002, n= 100; without Barents Sea sector and shelf break:y =−22.5x+ 459,r2= 0.36, p< 0.0001, n= 67; (C) All samples:y =−8.1x+ 213,r2 = 0.21, p< 0.0001,n= 108; without Barents Sea shelf break and sector:y=−10.6x+ 218,r2= 0.58,p< 0.0001,n= 75.
Table2.Sumconcentrationandmonomercompositionofdissolvedcombinedcarbohydratesinseawaterandtotalcombinedcarbohydratesinseaice. SampletypeTotal(nmolL−1)CHO:AA
mol% FuRhaGalac-aminArabGlu-aminGalacGluMan/XylGalac-URAGlu-URA Seawater 0–40m407(237–1179)2.1(1.0–6.6)6.8(3.7–11)4.1(0.9–16)0.4(0.0–1.0)0.9(0.0–7.7)6.9(3.5–9.8)9.0(2.8–15)37(22–71)30(14–45)0.8(0.0–3.5)0.0(0.0–1.0) 41–150m295(182–888)2.1(0.6–5.0)5.3(1.8–9.0)2.5(0.0–14)0.4(0.0–1.0)0.5(0.0–12)5.4(1.9–8.3)6.7(2.1–15)46(24–74)30(17–49)0.2(0.0–2.3)0.0(0.0–0.0) 500–3000m226(141–566)2.6(1.5–5.7)3.4(1.5–5.7)0.0(0.0–3.6)0.0(0.0–1.0)0.0(0.0–0.3)3.8(1.9–6.0)3.8(1.1–6.1)49(34–80)35(15–55)0.0(0.0–0.8)0.0(0.0–0.0) Seaice1015(285–3721)3.0(0.2–12.6)1.6(0.3–5.6)0.3(0.0–0.9)0.0(0.0–0.0)1.9(0.0–5.6)1.2(0.0–3.9)4.0(1.0–8.8)68(42–87)18(5.8–45)0.6(0.0–2.2)2.0(0.6–4.3) Themedianisgivenaswellasminimumandmaximumvaluesinparentheses(CHO,carbohydrates;AA,aminoacids;Fu,fucose;Rha,rhamnose;Galac-amin,galactosamine;Arab, arabinose;Glu-amin,glucosamine;Galac,galactose;Glu,glucose;Man/Xyl,mannose/xylose;Galac-URA,galacturonicacid;Glu-URA,glucuronicacid). Table3.Sumconcentrationandmonomercompositionofdissolvedaminoacidsinseawaterandmeltpondsandtotalaminoacidsinseaice. SampletypeTotal(nmolL−1)
mol% AsXGlXSerGlyThrArgAlaGABATyrValIsoPheLeu Seawater 0–40m182(116–484)16(12–19)8.9(7.4–15)10(8–19)33(28–39)9.3(4.5–12)0.9(0.1–1.8)13(10–14)1.0(0.4–3.6)0.7(0.1–1.3)2.3(1.6–3.0)1.3(0.9–2.0)1.1(0.6–1.7)1.7(0.9–2.9) 41–150m138(92–344)15(12–18)8.4(6.6–15)10(7–18)36(31–41)10(5.9–12)0.7(0.0–4.6)13(8.7–14)1.1(0.2–1.5)0.5(0.0–1.3)2.0(1.3–4.2)1.2(0.6–2.7)0.9(0.5–1.9)1.3(0.4–4.1) 500–3000m83(63–157)13(10–15)7.2(5.3–13)8.9(6.8–17)40(32–46)10(7.5–15)0.6(0.0–1.5)13(10–15)1.2(0.6–1.8)0.3(0.0–1.1)1.6(1.2–2.3)1.0(0.4–1.5)1.1(0.3–1.8)0.8(0.3–2.9) Seaice289(65–3319)10(6.6–14)23(19–35)17(5.8–24)19(8.7–23)6.0(3.7–7.2)1.3(0.5–13.6)10(8–13)0.9(0.2–18)1.2(0.0–2.1)3.3(1.0–5.9)2.1(1.4–2.9)1.4(0.8–2.3)3.0(2.2–5.1) Meltpond191(86–2473)15(12–20)12(10–15)12(7.6–18)4.3(1.9–5.1)20(15–30)8.0(5.5–10.7)12(10–15)1.2(0.7–2.2)1.5(1.2–2.0)4.6(2.9–5.5)3.1(1.7–4.8)1.9(0.8–3.1)4.1(2.1–6.3) Themedianisgivenaswellasminimumandmaximumvaluesinparentheses(AsX,aspartate;GluX,glutamate;Ser,serine;Gly,glycine;Thr,threonine;Arg,arginine;Ala,alanine; GABA,γ-aminobutyricacid;Tyr,tyrosine;Val,valinine;Iso,isoleucine;Phe,phenylalanine;Leu,leucine).
temperature difference corresponds to Q10-values of 2.3 and 1.9 for leucine and thymidine uptake, respectively.
Organic matter and heterotrophic bacterial activity in sea ice and melt ponds
Ice-core profiles revealed a highly variable vertical distribu- tion of TCCHO and TAA concentrations (Fig. 6). In most ice cores, bottom layers showed the highest concentrations of TCCHO but elevated concentrations were also detected in sev- eral surface and middle ice sections (Fig. 6). Carbohydrates in sea ice were dominated by glucose (42–87 mol%) and mannose/
xylose (6–45 mol%). Sea-ice carbohydrates also included a sub- stantial proportion of glucuronic acid (0.6–4.3 mol%). Gluta- mate (19–35 mol%) was the most abundant amino acid in sea- ice samples that were further enriched in serine (6–24 mol%).
Concentrations of DAA in melt ponds were in the range of seawater samples collected at ≤40 m. Melt pond samples showed a more even amino acid composition than seawater samples and included higher proportions of threonine (15– 30 mol%) and arginine (6–11 mol%) (Table 3).
Sea-ice samples contained on average 1.0×10⁵bacteria mL−1 (Fig. 6; Supporting Information Table S1). The vertical
distribution of bacterial cells in sea ice was directly related to bulk salinity that increased from surface to bottom ice (Fig. 6;
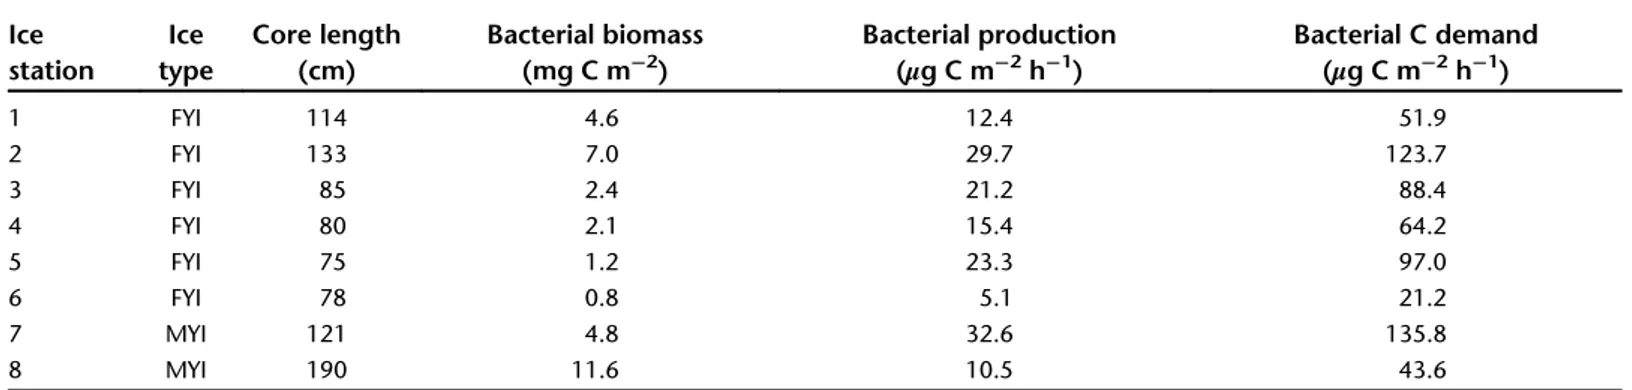
Supporting Information Table S2). Depth-integrated bacterial biomass in ice cores ranged from 0.8 to 11.6 mg C m−2. It was significantly related to the ice core length and, consequently, to ice thickness (r2 = 0.98, p< 0.001,n = 8) (Table 5, Supporting Information Table S3). Thymidine and leucine uptake in sea ice did not show consistent vertical patterns. Leucine uptake was directly related to CCHO concentrations and showed higher var- iation within and between ice cores than thymidine uptake.
Bacterial biomass production in sea ice estimated from depth- integrated thymidine uptake averaged 18.8 μg C m−2 h−1 (Table 5; Fig. 6). Assuming a bacterial growth efficiency of 24%
(Nguyen and Maranger 2011), this corresponds to an average bacterial carbon demand of 78.2μg C m−2h−1(Table 5). Sea-ice primary production was estimated to be 2.2 mg C m−2 d−1 at the time of our study (Fernández-Méndez et al. 2015). Hence, the bacterial carbon demand corresponded to approximately 85% of primary production in sea ice during late summer.
Ranges of bacterial abundances, leucine, and thymidine uptake in melt ponds were similar to those in bottom sea ice and higher than in the top and middle sections of the ice cores (Table 6).
A B
Fig 4.Principal component analysis of monomer composition of dissolved combined carbohydrates (DCCHO) (A,B) and dissolved amino acids (DAA) (B) in seawater≤40 m. (A) Fu, fucose; Rha, rhamnose; Galac-amin, galactosamine; Arab, arabinose; Glu-amin, glucosamine; Galac, galactose; Glu, glu- cose, Man/Xyl, mannose/xylose; Galac-URA, galacturonic acid; Glu-URA, glucuronic acid. (B) AsX, aspartate; GluX, glutamate; Ser, serine; Gly, glycine;
Thr, threonine; Arg, arginine; Ala, alanine; GABA,γ-aminobutyric acid; Tyr, tyrosine; Val, valinine; Iso, isoleucine; Phe, phenylalanine; leu, leucine. Sam- pling regions (A,B): BSB, Barents Sea shelf break; BSS, Barents Sea sector; KSS, Kara Sea sector; LSB, Laptev Sea shelf break; LSS, Laptev Sea sector; CB, Central Arctic Basin.