The N170 as a marker of Reading Proficiency
Inaugural-Dissertation in der Fakultät Humanwissenschaft der Otto-Friedrich-Universität Bamberg
Vorgelegt von
Ulrike Kagel
aus Parchim
Bamberg, den 20.11.2019
Tag der mündlichen Prüfung: 25.04.2020 Dekan: Universitätsprofessor Dr. Jörg Wolstein.
Erstgutachter: Universitätsprofessor Dr. Jascha Rüsseler
Zweitgutachter: Universitätsprofessor Dr. Claus-Christian Carbon URN: urn:nbn:de:bvb:473-irb-488426
DOI: https://doi.org/10.20378/irb-48842
Dieses Werk ist als freie Onlineversion über das Forschungsinformationssystem (FIS; https://fis.uni-bamberg.de) der Universität Bamberg erreichbar. Das Werk steht unter der CC-Lizenz CC-BY.
i
Dedication
I thank
My family, who supported me all my life, Dr. Klaus Kagel, who inspired me,
and
Dr. C. Hoffmann,
I also thank Prof. Dr. Jascha Rüsseler for his support.
iii
Contents
Dedication ... i
1 Introduction ... 5
1.1 Overview of language-related event-related potentials (ERPs) ... 5
The N170 – A Marker for Reading Proficiency? ... 8
2.1 Definition ... 8
2.2 Sources of the N170 Signal ... 9
2.2.1 The N170 and Word Specificity ... 10
2.2.2 Studies of Fast vs. Slow Readers ... 13
3 Other ERP-Markers for Reading Problems ... 14
3.1 The Mismatch Negativity (MMN) ... 14
3.1.1 What does the MMN reflect? ... 14
3.1.2 Is the MMN a possible marker for reading problems? ... 16
3.2 The P200 Component ... 23
3.2.1 What does the P200 reflect? ... 23
3.2.2 Why is this component a possible biological marker for reading problems? ... 24
3.3 The N200 Component – Two Kinds ... 25
3.3.1 What does the N200 reflect? ... 25
3.3.2 Is the N200 a possible marker for reading problems? ... 26
3.4 The P300 component ... 28
3.4.1 What does the P300 reflect? ... 28
3.4.2 Is the P300 a possible marker for reading problems? ... 30
3.5 The N400 component ... 32
3.5.1 What does the N400 reflect? ... 32
3.5.2 Is the N400 a possible marker for reading problems? ... 32
3.6 The N450 component ... 36
3.6.1 A short excursion: A Component that shows Differences between Rhyming and Non-Rhyming Stimuli ... 36
The Present Studies ... 37
4.1 Background ... 37
4.1.1 Habituation of the N170 ... 37
4.2 Experiment 1: The Habituation of the N170 in Adults ... 38
4.3 Experiment 2: The Habituation of the N170 in Children ... 50
4.4 Experiment 3: A Test of the Phonological Mapping Hypothesis ... 57
4.4.2 Method ... 62
4.4.3 General Discussion ... 86
4.4.4 Conclusion ... 88
iv
Appendix ... 90
5.1 Study 1 (N170-Adults) ... 90
5.2 Study 2 (N170-Children) ... 91
5.3 Study 3 ... 92
References ... 98
5
1 Introduction
The major aim of the thesis is to investigate a new biological marker for reading proficiency.
One typical marker for dyslexia is the mismatch negativity (MMN) of the auditory event-related brain potential. In the present studies I shall explore a marker that is more reading-specific: the N170 component (also called N1). This component is more reading specific because it responds to and is modulated by visual stimuli depending on the expertise of the reader with a specific stimulus class such as words or faces. In contrast, the MMN is primarily sensitive to deviant auditory stimuli in an otherwise consistent series of auditory events.
The first two studies examined whether there is a correlation between habituation of the N170 and reading speed in adult normal readers and 2nd graders. The ongoing habituation of the N170 signal represents the automatization of the reading process. In a third study rhymes were used to explore the relation between N170 laterality, phonological abilities (rhyming) and reading ability/speed.
1.1 Overview of language-related event-related potentials (ERPs)
Visual stimuli like faces, pictures of objects and words elicit the N170 component after 150 ms to 200 ms in temporo-parietal regions while real visual objects rather activate temporal- occipital regions. The N170 is investigated in order to analyze a print-specific ERP. Other typical language-related components also appear depending on the task. The MMN appears around 100-200 ms post-stimulus and is an auditory evoked potential that is thought to be a good candidate as a biomarker for reading difficulties (see Section 3.1). I will review research on the early left anterior negativity (ELAN) which basically represents automatized processing of syntactic structure (parsing) (Hahne & Friederici, 1999). I will also review research on the P200 component that peaks at about 150 – 275 ms and which is investigated primarily in the auditory domain. The N400 reflects the processing of semantic information while the P300 reveals insights in tasks that require an intentional discrimination response (see Figure 1 and Figure 2).
6
Figure 1: A schematic overview of some language-related potentials.
In the next sections the different language-associated ERPs and their relation to dyslexia or specific language impairment (SLI) are reviewed.
7
Figure 2: Spatial-chronologically organization of the auditory sentence processing. On the right side of the time line the sentence processing model of Angela Friederici (Friederici, 2002) is depicted. On the left side, other language related ERPs and their function are summarized in regards to the time line. Figure adapted from Jäncke (2013), Lehrbuch Kognitive Neurowissenschaften, p.637.
Latency in ms
8
2 The N170 – A Marker for Reading Proficiency?
2.1 Definition
The N170 is a negative deflection of the event-related brain potential that is elicited by visual stimuli at temporo-parietal electrodes with a maximum amplitude 150-200 ms post-stimulus. It is evoked by visual stimuli in general and is prone to the expertise of the observer. The N170 amplitude was found to be larger, if experts were looking at stimuli that were more familiar to them than others. That means, as an example, that the N170 evoked by pictures of animals is higher for animal experts vs. non-experts (Tanaka & Curran, 2001) and can be modulated, to take an example from another study, by the expertise of car-experts (Gauthier, Curran, Curby,
& Collins, 2003). The present doctoral thesis addresses the N170 component that is elicited by words or letters, i.e. it is sensitive to the tuning for print and visual print expertise.
9
2.2 Sources of the N170 Signal
ERP and magnetoencephalographic (MEG) data of Tarkiainen et al (1999) and in the study by Maurer et al (2005b) found that there is print-specific activation in parts of the occipito- temporal cortex. FMRI data support this hypothesis and found sensitivity to word-like stimuli in the fusiform gyrus – the so-called visual word form area (VWFA).
Figure 3 left: Lateral view of the left hemisphere. The indicated area shows the position of the VWFA. Reprinted from list of brain pictures In Venngage. Retrieved January 29, 2018 from: https://infograph.venngage.com/p/212935/12-major-landmarks-of-the-brain;
Figure 3 right: Horizontal view of the brain, sight from beyond, again the VWFA is indicated by a red circle, please note that the VWFA is located below the cerebellum.
Reprinted from a list of figures of the brain. Retrieved January 29, 2018 from:
https://faculty.washington.edu/chudler/gif/colorb9.gif.
Left visual word form area (VWFA)
10
2.2.1 The N170 and Word Specificity
Early reading-specific processes seem to be a form of perceptual expertise. Bentin, Mouchetant- Rostaing, Giard, Echallier, and Pernier (1999) found that the N170 is larger in the left hemisphere for orthographic stimuli compared to non-orthographic stimuli like symbols. It was also found that the N170 is more left lateralized for native Japanese speakers compared to monolingual English speakers who were presented a new script (the Japanese scripts).
Compared to the Japanese participants, the English participants showed a bilateral N170 activation pattern for the novel script in the grand averages amplitude (words vs. novel words).
This reflects that the N170 is not specific to the alphabetic systems (Maurer, Zevin, &
McCandliss, 2008). Additionally, researchers found that the N170 is almost not evident in pre- school kindergarten children, but increases in amplitude when children have approximately two years of reading training in school (Maurer et al., 2006) and is still present in adults (Maurer, Brem, Bucher, & Brandeis, 2005). Zhao, Li, Zhao, Gaspar, and Weng (2015) showed that even short training sessions of Chinese characters modulate the N170 in preliterate children.
Boltzmann and Rüsseler (2013) showed that adult functional illiterates display an N170 that is not different for orthographic and non-orthographic stimuli. However, when they learned to read fluently, the N170 amplitude became larger for orthographic stimuli, and the amplitude- gain of the N170 for orthographic stimuli correlated positively with the gain in reading ability.
Thus, the N170 that is evoked by orthographic stimuli like words or letters can be considered to reflect early specialized neural processing for print that arises through training of reading The N170 correlates with the ability to read and, thus, might be used as a marker for reading proficiency and as a predictor for reading problems. For example, Zhao et al. (2015) found that the N170 amplitude increases after a short visual identification training of Chinese characters in preschoolers. The mean amplitude increase was observed in the right hemisphere.
Maurer et al (2005b) examined children that were not able to read but had letter and word knowledge. The study was designed to investigate whether there are signs of a fast specialization for letter strings (i.e. words and other letter strings). Additionally, the authors compared the processing of word and symbol strings in adults versus children. The results showed that the N170 did not differ between letter and symbol strings in children which were not able to read. Furthermore, children with low letter knowledge had a letter string specialization, i.e. N170-amplitude was larger for words compared to symbols. This could be caused by a previously acquired visual familiarity with letter stings. In another study, Maurer et al (2011) found in a longitudinal study that the N170 deficit for tuning in dyslexic children persists until approximately 5th grade (with a developmental delay). Nevertheless, the N170
11
tuning deficit was present in the beginning- when dyslexic children learn to read. Similar results were found in other studies (Grossi et al 2001; Taylor & Keenan, 1999; Holcomb et al, 1992;
Kok & Rooijakkers, 1985). Furthermore, Mahé, Bonnefond, Gavens, Dufour and Doignon- Camus (2012) found that dyslexics exhibit superior N170 tuning for print compared to healthy controls. These studies show that the N170 component evoked by words or letter strings is an index for the ability to read. It is very specific for print tuning and represents clearly defined features of reading.
Better reading ability leads to a larger left-lateralization of the N170
Typically, the N170 has been shown to be lateralized slightly to the left in the context of reading (Cao et al., 2013; Maurer et al., 2006; Maurer, Blau, Yoncheva, & McCandliss, 2010; Maurer, Schulz, Brem, der Mark et al., 2011). However, left lateralization of the N170 has been shown to be lacking in children who cannot read. In those children the phonological mapping skills are not yet developed (Kast, Elmer, Jancke, & Meyer, 2010; Maurer et al., 2006; Maurer et al., 2007). These results demonstrate that the N170 component could be an index for early phonological mapping that develops shortly after familiarization with print (Maurer &
McCandliss, 2007b). In line with this idea, Tong et al. (2016) found that younger children (M=7.7 years) had a bilateral N170 response, while older and more experienced children (M=9.4 years) had a more left lateralized N170 signal (mean amplitude).
Mahé, Bonnefond, Gavens, Dufour and Doignon-Camus (2012) found that dyslexics process verbal and nonverbal printed material similarly which suggests that these participants had no specific visual tuning for printed language. The print tuning of the N170 component was investigated in a lexical decision task with symbol strings and four sets of word-like stimuli.
The authors found that there was a tuning for healthy controls but not for dyslexic adults. Tuning was indexed by calculating the differences of the mean N170 amplitudes for letter vs. non-letter stimuli. Furthermore, Mahé, Bonnefond and Doignon-Camus (2013) compared controls, dyslexic adults and poor readers that were reading-matched with the same kind of stimuli as in Mahé et al. (2012) to demonstrate that dyslexia is linked with the hallmark that there is a specific lack of tuning. Like control readers, poor readers showed more pronounced left occipito- temporal negativities in contrast to dyslexics (in absolute mean amplitudes). To summarize, N170 left-lateralization seems to reflect expertise for phonological processing of visually presented letters or words that is compromised in dyslexia. Thus, left-lateralization of the N170 evoked by words, pseudowords or letters might be a useful marker of reading abilities.
12
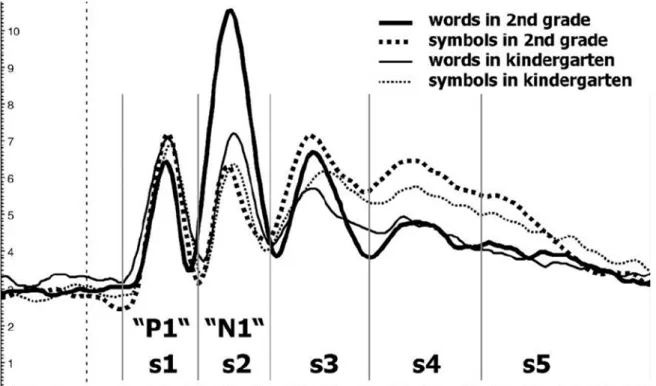
There are few studies leading the way to an N170 component that is a usable biological marker for reading ability. It is – as described above- very sensitive to impairments of the reading ability in adults and children. A very positive feature of this component is that it actually develops with the children’s ability to read. As they evolve from a beginner to fluent reader the N170 can be observed to take the shape of an inverted U-curve (Maurer et al., 2006; Tong et al., 2016; see figure 5). When the child learns to read, the N170 grows. When the child develops to a fluent, eloquent reader the N170 lowers again:
Figure 4: Development of the N170 in kindergarten children and children and second graders.
Reprinted from “Coarse neural tuning for print peaks when children learn to read”
adapted figure of Maurer, 2006, NeuroImage, Volume 33 (2), 749-758.
13
Figure 5: Approximated N170 amplitude over the life span based on publication by Maurer (2006). The amplitude probably rises until the age of 9/10 years and then lowers with age.
Next, I will look at the few studies that investigated the automatization process in reading and used the N170 component to examine such processes. Such studies look at the habituation of the N170 to repeated exposure to the same printed stimuli (see figure 4 and 5).
2.2.2 Studies of Fast vs. Slow Readers
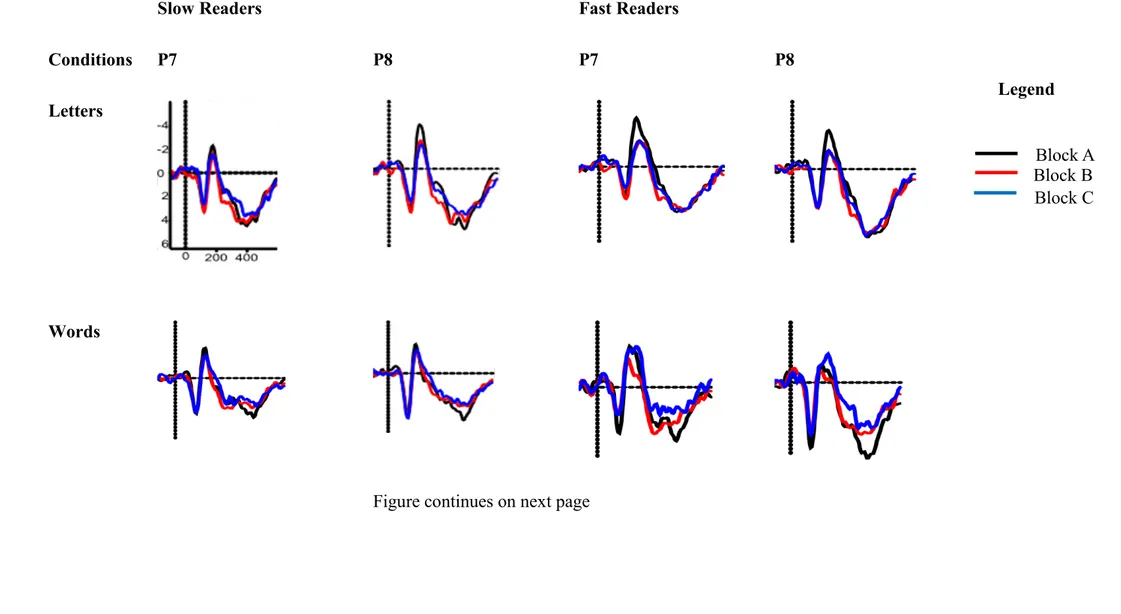
Reading might be more automatized in fast readers and may be reflected in a faster habituation / adaptation of the N170 amplitude with increasing reading ability. Korinth, Sommer, and Breznitz (2013) presented single letters to slow and fast readers. They observed an interesting pattern in fast readers only: a double peak – two subcomponents – in the time window from 160 ms to 200 ms. These subcomponents are temporally and topographically distinct.
Furthermore, they studied adaptation effects, i.e., a reduction of N170 absolute mean amplitude after multiple presentations of the same letter. Adaptation effects were weaker for slow compared to fast readers. However, in a more recent study with Hebrew readers, Korinth and Breznitz (2014) did not find a difference in N170 habituation of slow and fast readers.
Taken together, these results indicate that (1) the N170 amplitude increases with better reading ability; (2) better reading ability leads to a larger left-lateralization of the N170 and (3) the habituation / adaptation of the N170 amplitude might be more pronounced with increasing reading ability. These results show that the N170 might be a useful biological marker of reading ability. In the next section I recapitulate findings from other language related ERP components which show that the N170 might be a better marker for reading problems.
3 5 6 7 9 16 Age in years
14
3 Other ERP-Markers for Reading Problems
These studies aim to find a marker for the reading ability that can be used for individual diagnostic decisions/risk predictions. Previous studies have also tried to find an index for reading problems using ERPs other than the N170 as a relevant ERP for individual diagnostic decision making with regards to developmental reading difficulties. In the following sections other ERPs than the N170 are reviewed in relation with reading problems.
3.1 The Mismatch Negativity (MMN)
In the following section the MMN and its applications is described quite thoroughly, compared to other ERPs. The reason is that the MMN has an important position as a biological marker of reading problems.
3.1.1 What does the MMN reflect?
The MMN of the auditory evoked potential is elicited by deviant stimuli interspersed in a sequence of otherwise physically identical sounds even if these are not attended to (Näätänen et al., 1978). The MMN represents the early, low-level stages of auditory information processing at the subcortical and cortical levels (Escera, Leung, & Grimm, 2014). It can be used to study reading problems in children or infants, because the subject does not have to attend to the stimuli. This makes it especially attractive in studying infants or patients who have problems in communicating or performing tasks. MMN usually peaks 100 – 200 ms after the onset of the deviant stimulus with a maximum amplitude over frontal and central scalp locations. It has been described for unexpected changes for a range of stimulus attributes like a decrement in stimulus duration, frequency or intensity changes or changes of the spatial location of stimulus origin (for a recent review, see Bartha-Doering, Deuster, Giordano, Am Zehnhoff-Dinnesen, & Dobel, 2015). These and other results have led to the conclusion that the MMN is generated by a discriminative process that detects any change in a sequence of sounds by using memory traces established by the previous auditory stimulation (Fishman, 2014). In many studies, the MMN has been found to be of lower amplitude or even absent in dyslexics (for a review, see Bishop, 2007; Kujala & Näätänen, 2001). This has led researchers to explore the potential of the MMN as a marker for reading difficulties (Hämäläinen, Salminen, & Leppänen, 2013; Lohvansuu et al., 2014; Lyytinen, Erskine, Hämäläinen, Torppa, & Ronimus, 2015).
15
Some studies show that the MMN can also be used to test the phonological system of the auditory cortex (Cheour et al., 1998; Dehaene-Lambertz, 1997; Näätänen et al., 1997; Rinne et al., 1999; Shtyrov, Kujala, Palva, Ilmoniemi, & Näätänen, 2000). Näätänen et al. (1997) compared vowel processing in Estonian and Finnish participants by using four vowels, /e/, /ö/, and /o/ that were shared by these two languages and /õ/ which belongs to Estonian, but not Finnish. The researchers found that in Estonian, the deviant /ö/, /õ/ and /o/ elicited MMNs that were increasingly larger as the physical difference between the standard and the deviant vowel increased. In Finns, the MMN showed another but similar amplitude behavior with the exception that there was an amplitude attenuation for the Estonian /õ/, which suggests that there was no phonological representation (or long-term memory trace) for this vowel. A source localization with MEG indicated that the MMNm (the magnetic equivalent of the MMN) was enhanced for the native-language phoneme in the left temporal cortex as compared to the non- native language phoneme, for which the MMNm was small in both hemispheres. There is quite a large amount of evidence that the MMN can serve as an index of learning–associated neural plasticity. This has been shown for non-speech and speech stimuli as well as in learning situations in the laboratory and in natural conditions (Kraus et al., 1995; Kujala et al., 2001;
Menning, Roberts, & Pantev, 2000; Näätänen, Schröger, Karakas, Tervaniemi, & Päävilainen, 1993; Tremblay, Kraus, & McGee, 1998b; Winkler et al., 1999). As an example, Näätänen and colleagues (Näätänen & Alho, 1995) showed that the MMN gradually emerged in those participants who learned to discriminate complex spectro-temporal sound patterns, but not in those who did not learn them. Kraus et al. (1995) and Tremblay, Kraus, and McGee (1998a) got similar results by investigating the discrimination learning of speech contrasts that were initially impossible to discriminate for their participants with the MMN being elicited when participants learned to discriminate the speech contrasts.
These examples demonstrate that the MMN reflects auditory processing, a function that might be compromised in developmental dyslexia. Thus, the MMN has been studied in developmental dyslexia to explore its usability as a biomarker for reading problems.
16
3.1.2 Is the MMN a possible marker for reading problems?
3.1.2.1 MMN and dyslexia or SLI
The MMN is used quite often used to investigate dyslexia or other language problems like specific language impairment (SLI).
MMN to Speech Stimuli
Bishop (2007) summarized eleven studies that investigated the rapid auditory temporal processing (RATP; Tallal, 1980) theory. The RATP hypothesizes that dyslexic readers have difficulties in processing rapidly changing auditory stimuli. Rapid stimulus discrimination is necessary to distinguish, for example, /d/ and /p/. Difficulties in distinguishing these sounds might lead to weak phonological representations and, in turn, to problems with grapheme- phoneme mapping when starting to learn to read and write. Examples for speech stimuli used in these MMN-studies are: /da/ vs. /ga/and /ba/ vs. /ga/.
Most studies that examined differences between normal and dyslexic readers with speech stimuli reported small to middle effect sizes ranging from 0 to 0.5 (i.e. Alonso-Búa, Díaz, &
Ferraces, 2006; Bradlow et al., 1999; Heim et al., 2000; Paul, Bott, Heim, Wienbruch, & Elbert, 2006). Only three studies had large effect sizes for specific and different time windows over which the MMN was computed for the studies (Schulte-Körne et al., 1998; Schulte-Körne, Deimel, Bartling, & Remschmidt, 2001; Sharma et al., 2006). Notable in regard to the effect sizes in studies with speech stimuli is that only the stimuli /da/ vs. /ga /elicited an effect size in which the confidence intervals did not include zero. Two studies found effect sizes around 0.5- 0.8 (Sharma et al., 2006; Uwer, Albrecht, & Suchodoletz, 2002). To summarize, most confidence intervals of the effect sizes include zero. Only some studies found reliable differences in auditory processing between dyslexic and normal readers.
17
3.1.2.1.2 MMN to Non-speech Auditory Stimuli (that involve temporal processing)
For non-speech stimuli the MMN review found similar effect sizes. Most studies report an effect size between 0 to 0.5 (i.e. Alonso-Búa et al., 2006; Baldeweg et al., 1999; Kujala, Lovio, Lepistö, Laasonen, & Näätänen, 2006; Uwer, Albrecht, & Suchodoletz, 2002). Larger effect sizes were obtained in some studies (two out of seven studies: Korpilahti & Lang, 1994;
Stoodley, Hill, Stein, & Bishop, 2006). Examples for stimuli are duration deviants or different frequency pattern changes that differ in temporal characteristics. Taken together, for studies using non- speech stimuli, there are few studies (4) with the effect sizes in which the confidence intervals do not include zero.
Korpilahti and Lang (1994) observed effect sizes (Cohen’s d ~ 0.7 vs. 0.9) for the duration deviants 50 vs. 500 ms compared to 50 vs. 110 ms (the duration deviant varied from 50-300 ms). Both effect sizes were different from zero. Another study (Stoodley, Hill, Stein, & Bishop, 2006) used pure tones as the standard stimuli and modulated tones as the deviant. Stoodley et al. (2006) found only large to very large effects sizes around d~1 with the 20 Hz-modulated deviants in an early (150-300 ms) and late time window (300-500 ms) and had confidence intervals which did not include zero. Studies with non-speech auditory stimuli also do not display a coherent picture. The review displays mixed results for the possibility of the MMN being a suitable candidate for a biological marker for reading problems for non-speech auditory stimuli.
MMN to Frequency Deviants
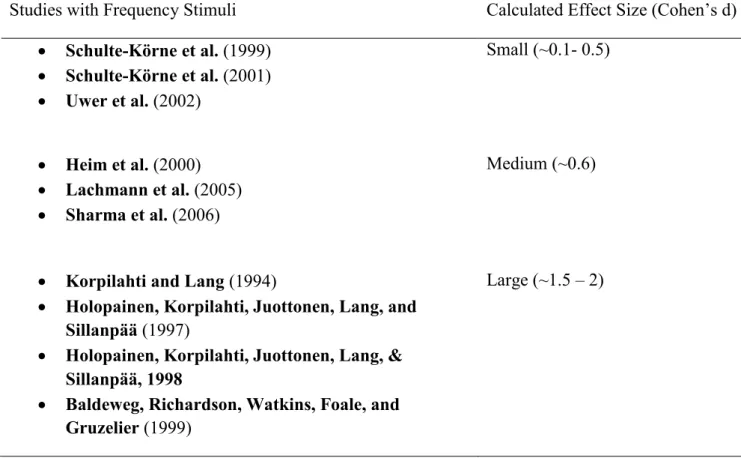
The previous studies used tone stimuli where standards and deviants differ in frequency. Here, stronger differences between the normal and clinical group were observed in the reviewed studies. Small effect sizes were found by Schulte-Körne, Deimel, Bartling, and Remschmidt (1999), Schulte-Körne, Deimel, Bartling, and Remschmidt (2001) and Uwer et al. (2002), while medium effect sizes were presented by Heim et al. (2000), Lachmann, Berti, Kujala, and Schröger (2005) and Sharma et al., 2006. Compared to the other kind of stimuli, there was quite a large portion of the studies that had very strong effect sizes that range from approx.1.5 up to 2 (Korpilahti & Lang, 1994; Holopainen et al. 1997, 1998; Baldeweg et al., 1999).
18
Table 1: Overview of effect sizes and studies in Bishop’s review (2007).
Studies with Frequency Stimuli Calculated Effect Size (Cohen’s d)
Schulte-Körne et al. (1999)
Schulte-Körne et al. (2001)
Uwer et al. (2002)
Small (~0.1- 0.5)
Heim et al. (2000)
Lachmann et al. (2005)
Sharma et al. (2006)
Medium (~0.6)
Korpilahti and Lang (1994)
Holopainen, Korpilahti, Juottonen, Lang, and Sillanpää (1997)
Holopainen, Korpilahti, Juottonen, Lang, &
Sillanpää, 1998
Baldeweg, Richardson, Watkins, Foale, and Gruzelier (1999)
Large (~1.5 – 2)
When reviewing the studies with different stimuli, only research with frequency deviants show explicitly lower amplitudes for dyslexia, the other mentioned stimuli (speech stimuli, non- speech auditory stimuli) do not demonstrate such results in a convincing way.
3.1.2.2 The MMN for early dyslexia identification
In developmental impairments like dyslexia, it would be helpful if the disorder is identified before any major developmental delays appear and interventions could be introduced.
Additionally, interventions would then be more effective because the plasticity of the brain is higher in such early developmental stages (Paterson, Heim, Friedman, Choudhury, & Benasich, 2006). It is well known that there is a strong genetic component in the case of dyslexia (Hallgren, 1950; Rutter, Tizard, and Whitmore, 1970; Bishop & Snowling, 2004; Liu, Wu, Zhou, & Gong, 2019). It is important to develop early indices of the disorder in infants with relatives that are at risk. In the Jyväskylä longitudinal study on dyslexia (Finland) the perceptual dysfunctions of infants with a genetically elevated risk for dyslexia were evaluated and it follows up the development of these infants. Results of Leppänen, Pihko, Eklund, and Lyytinen (1999) showed that the central auditory processing in infants with genetic risk differed from that in control children. The authors used a pseudo-word /ata/ as standard stimulus.
19
Additionally, two deviant stimuli (/atta/), one having a small and the other a larger increment in the duration of the stop consonant - the silent gap corresponding to the occlusion stage of the stop consonant - were presented. The duration changes are phonetically relevant in the Finnish language because they can alter the meaning of a word. Leppänen and colleagues (1999) found several differences in the electrophysiological responses of the two groups as newborn babies.
The duration changes elicited MMN-type responses which differed both in amplitude and scalp distribution between the at-risk and control children. The small duration difference between the deviant and the standard stimulus elicited an MMN in the control children, but not in the at-risk children, whereas the larger duration difference elicited an MMN in both groups. Nevertheless, the MMN was smaller in the at-risk compared to the control group over the left hemisphere, whereas no group differences were found over the right hemisphere. This suggests a decreased discrimination accuracy of the duration of speech stimuli in the at-risk infants. Furthermore, the results show a dysfunction of the left hemisphere in the at-risk children which is consistent with several previous studies indicating functional and structural abnormalities in the left hemisphere in dyslexia (Raschle, Zuk, & Gaab, 2012). Additionally, a significant correlation between the behavioral measures and the MMN was found. A comparison of the MMN laterality and the infants’ head-turning responses to duration deviants indicated that a stronger left-hemisphere dominance correlated with better behavioral discrimination of the deviant stimuli (more head turns in response to the occurrence of the deviant). These results suggest that with the MMN, dysfunctions of the phonological and auditory processing in dyslexia can be determined in infants even if they are only six months of age.
Taken together the review of Bishop (2007) displays an ambiguous research situation (until 2007) for the MMN in relation to language impairment. Effect sizes are varying strongly or are non-existent. Besides the missing effect sizes, the review encountered some problems: The age of the participants ranges from five years until in adult age and also the sample sizes varied a lot in the review. Additionally, other characteristics like stimulus construction and presentation are quite different across the studies. The mother tongues of the participants differ a lot. They include English, Finnish, German, Mandarin and Norwegian which all have different characteristics. The following section presents some studies that were published after 2007.
3.1.2.3 MMN to speech stimuli
A very (developmentally) early MMN is called the mismatch response (MMR) which is frontally positive in young children but in adults it is frontally negative and called the MMN.
In 17 month old infants, van Zuijen et al. (2012) found that the MMR correlates with language
20
comprehension and with word and pseudo-word reading fluency in second grade. The authors interpreted this result as a better temporal auditory processing and as a precursor of language comprehension. They also found a correlation between preliterate expressive language abilities and reading fluency. This is in line with the results of Lovio, Näätänen, and Kujala (2010). The authors found a reduced MMN in children with a risk for dyslexia through having at least one dyslexic parent. The reduced MMN was found in the conditions vowel, vowel-duration, consonant, and intensity changes. In another study, Neuhoff et al. (2012) found three separate MMN components to speech stimuli. The late MMN was diminished in children with dyslexia and their unaffected siblings compared to the control group, while the other two components did not show any group differences.
3.1.2.4 MMN to Frequency Deviants
For frequency stimuli, Rinker et al. (2007) found, beside reversed activity in the hemispheres, an absent MMN2 in the second recorded time window. Children with SLI seem to have a deficit in frequency discrimination. The authors reported that this is especially the case for tones below 750 Hz and for a frequency difference of 50 Hz. Similar results were found by Ahmmed, Clarke, and Adams (2008) who examined both individual and grand averaged amplitudes of the MMN.
The results show that in terms of grand average, the control group can distinguish deviant tones that only differ from the standard tone by between 2% and 5% in order to generate an MMN response while children with SLI have smaller MMN with the same deviant tone separation.
The results suggest that children with SLI need a frequency separation of at least 10% in order to generate an MMN that is similar to the control group. It might be that children with SLI have a deficit in the mechanism of generating a similar MMN. The authors identified two SLI subgroups with a high and low score in the Auditory Fusion Test-Revised (high score=HAG, low score=LAG). The authors examined the grand average MMN for 5% and 10% contrasts for the subgroups and found that a significant difference for the HAG group while there was no MMN present in the 5% contrast for this group. There was no grand average MMN for all kinds of contrast deviants for the LAG subgroup which leads to the conclusion that these groups have poor neural responses generating only a small MMN. Again (like in the frequency studies before 2007) the MMN to frequency deviants show that the MMN is a rather good marker for reading difficulties.
21
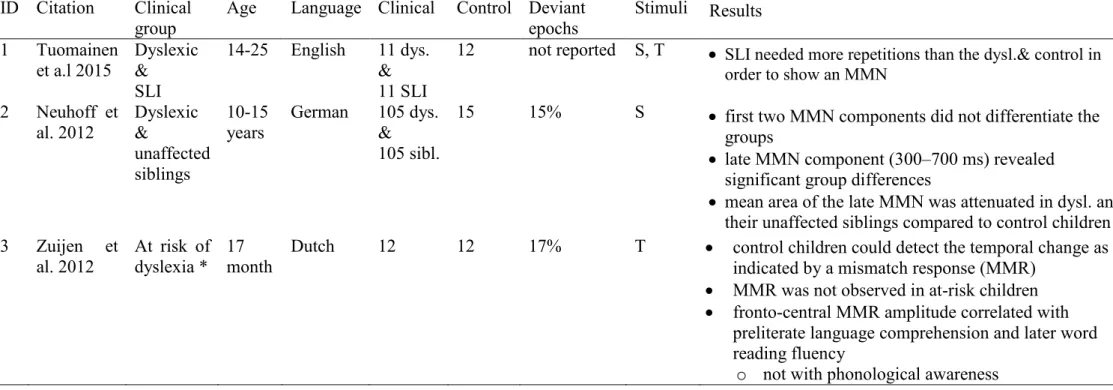
Table 2: Overview over some recent studies (2007-2015) that examine the MMN in regards to reading or language problems. Note: F=frequency;
T=temporal (non-speech); S=speech, *at least 1 dyslexic parent.
ID Citation Clinical
group Age Language Clinical Control Deviant
epochs Stimuli Results 1 Tuomainen
et a.l 2015 Dyslexic
&
SLI
14-25 English 11 dys.
&
11 SLI
12 not reported S, T SLI needed more repetitions than the dysl.& control in order to show an MMN
2 Neuhoff et
al. 2012 Dyslexic
&
unaffected siblings
10-15
years German 105 dys.
&
105 sibl.
15 15% S first two MMN components did not differentiate the groups
late MMN component (300–700 ms) revealed significant group differences
mean area of the late MMN was attenuated in dysl. and their unaffected siblings compared to control children 3 Zuijen et
al. 2012 At risk of dyslexia * 17
month Dutch 12 12 17% T control children could detect the temporal change as indicated by a mismatch response (MMR)
MMR was not observed in at-risk children
fronto-central MMR amplitude correlated with preliterate language comprehension and later word reading fluency
o not with phonological awareness
Table continued on next page
22 4 Lovio et al.
2010 At risk of
dyslexia* 6-7 Finnish 10 9 10%, but 2 deviants were alternating
S amplitudes of MMN were smaller for the vowel, vowel- duration, consonant, and intensity deviants in children at risk for dyslexia
5 Rinker et
al. 2007 SLI 7-11 German 13 13 not reported T Reversed hemispheric activity in SLI
In 2nd time window MMN2 was absent for the children with SLI
6 Ahmmed
et al. 2008 SLI 7-11 English 19 19 15% , but 3
deviant frequencies
T SLI who had poor temporal processing abilities generated a positive mismatch response (2% ISIs
difference)
good temporal processing abilities generated only P‐ MMR in response to contrasts up to 10% ISIs 7 Schaadt et
al 2019 Dyslexic Mean
age 9 German 16 19 Uni-modal
vs. Bimodal speech
S reduced MMR with later onset to visual-auditory speech information in children with spelling problems
compared to children without spelling problems
comparing bimodal and monomodal speech perception:
children without spelling problems showed significantly larger responses in the visual-auditory experiment compared to the visual-only response, whereas children with spelling problems did not.
ID Citation Clinical group
Age Language Clinical Control Deviant epochs
Stimuli Results
23
Taken together, the MMN of the event-related brain potential seems to be a good predictor of reading difficulties. However, it seems not to be reading specific, i.e. the MMN is also compromised in SLI and in auditory processing deficits that do not lead to reading problems.
Thus, it might be useful to look for a more specific biological index of reading expertise.
3.2 The P200 Component 3.2.1 What does the P200 reflect?
Shaul (2008) describes the possible relationship between the auditory P200 component and dyslexia. The auditory P200 has a fronto-central scalp distribution that peaks at the vertex (Hyde, 1997; for a review; Oades, Dittmann-Balcar, & Zerbin, 1997). Other studies used pure tones and found that the P200 amplitude has strong parietal distributions. Contrarily, standard stimuli show maximum amplitudes at parieto-central sites (Dunn, Gomes, & Sebastian, 1996).
Other authors (e.g. Oades et al., 1997) found that auditory P200 maxima are rather posterior in children, but are more centrally localized in adults when they were presented a three-tone auditory oddball task. This suggests that the P200 shifts anteriorly to the vertex with increasing age. The same authors also found that amplitudes increased with age, and that the component latencies decrease at lateral sites with increasing age. In contrast, other authors found different maturing of the P200 component: Martin and Lovegrove (1988) found that the N100-P200 increased up to the age of 14 years, but Johnson (1989) found no such change. Licht, Bakker, Kok, and Bouma (1992) found a decreasing P240 from grade one to three. Oades et al. (1997) assumed that these inconsistent results might show that P200 measures are unreliable for reflecting developmental changes.
The visual P200 has been studied less well. Nevertheless, visual potentials in non-linguistics tasks in children have been conducted by Hennighausen, Remschmidt, and Warnke (1994). The authors used pattern reversals and found that the P200 appeared earliest at the occipital sites (75-225 ms) and then moved towards the central and frontal sites (170-265 ms).
Using word-stimuli, Hagoort and Kutas (1995) found that the P200 component appears in response to both visually and aurally presented words at around 180-250 ms. Visually, the P200 can be observed across the head, but is larger over the fronto-central sites. The P200 is larger when it is presented visually compared to an aural presentation (Hagoort & Kutas, 1995, 2000).
24
Studies suggest that the P200 is not just an exogenous component, but might also relate to endogenous or cognitive processing (Dunn, Dunn, Languis, & Andrews, 1998; McDonough, Warren, & Don, 1992). The P200 is also thought to be an index of feature detection (Luck &
Hillyard, 1994), selective attention (e.g. Hackley, Woldorff, & Hillyard, 1990; Schulte-Körne, Bartling, Deimel, & Remschmidt, 2004b), and other early sensory stages of item encoding (Dunn et al., 1998). Other research shows that a P200-like component is thought to be linked with short-term memory storage (e.g. Chapman, McCrary, & Chapman, 1978), retrieval (Chapman et al., 1978; Friedman, Vaughan, & Erlenmeyer-Kimling, 1981; Taylor, Smith, &
Iron, 1990) and working memory functions (Raney, 1993; Smith, 1993; Stelmack, Saxe, Noldy- Cullum, Campbell, & Armitage, 1988). There has been the idea among researchers that the anterior and posterior P200 components represent different aspects of stimulus feature detection and encoding. Some research assumes that P200s might be differentiated on the bases of their source location. Dunn et al. (1998) suggested that frontal P200 components may represent partial or complete word retrieval from long-term memory into working memory.
In language research, a study by Dambacher, Kliegl, Hofmann, and Jacobs (2006) investigated the effects of frequency, predictability and position of words in word-by-word sentence- reading. They found that the P200 component was larger for words at the beginning and end of a sentence compared to words that were in the middle of a sentence, which shows that those words are accessed quickly and independent of the context information.
3.2.2 Why is this component a possible biological marker for reading problems?
3.2.2.1 P200 and dyslexia
Shaul (2008) states that only a handful of studies have been published on the P200 component in regard to dyslexics, but the available data shows that probably a similar pattern may characterize young and adult dyslexics at the linguistic level in visually presented stimuli.
Harter, Diering, and Wood (1988) found smaller P200 amplitudes in the left hemisphere compared to the right hemisphere in dyslexic children during a letter recognition task using an intra-location selective attention paradigm. Naylor, Wood, and Harter (1995) report similar results for adult readers. The authors found evidence for a smaller P200 in the left hemisphere in dyslexic adults who used the same task. Participants showed a general reduction in the positivity beginning at around 150 ms until 500 ms. Nevertheless, adult dyslexics seem to have a more diffuse, bilateral reduction of ERP responses. Schulte-Körne et al. (2004b) did not find any differences in the P200 amplitude and latency in dyslexic children while another study
25
(Taroyan, 2015) found longer latencies for dyslexics. In another study by Schulte-Körne, Bartling, Deimel, and Remschmidt (2004a) the researchers investigated in-motion-onset visual evoked potentials (i.e. P100, P200) in order to examine the magnocellular deficit theory and found reduced amplitudes for the P100 and the P200 in dyslexic children. Furthermore, they found that the group difference for the P200 becomes larger if the stimuli moved faster. Meng, Tian, Jian, and Zhou (2007) found no differences between normally reading and dyslexic Chinese children in homophonic, orthographic and baseline conditions (for Chinese characters).
One disadvantage of the P200 is that it has a similar pattern for children and adults as well. This is not very suitable for looking at the development of the component. Furthermore, consistent relationships between reading ability and P200 amplitude or latency have not been found in the very few studies that investigated this issue. Thus, it remains unclear whether the P200 component might be useful as a biomarker of reading ability. Only few recent studies investigated the relationships between the P200 and language disorders.
3.3 The N200 Component – Two Kinds
3.3.1 What does the N200 reflect?
3.3.1.1 Attention-sensitive N200
The N200 is a negative component peaking at around 200-350 ms and usually appears at fronto- central sites (Oades et al., 1997). Research on the visual N200 in children that used pattern reversal stimuli in which the participants were required to fixate but not to respond, has shown that this component is occipitally distributed at 190-440 ms, the central sites at 215-260 ms, and the frontal sites at about 205-390 ms (Hennighausen et al., 1994). Research on the auditory modality suggests that this component peaks fronto-centrally at the Fz electrode when using a two-tone oddball paradigm (Enoki, Sanada, Yoshinaga, Oka, & Ohtahara, 1993; Johnstone, Barry, Anderson, & Coyle, 1996a). When the auditory N200 was elicited by a three-tone task the researchers found that N200 amplitudes and latencies tend to decrease with age and show a right bias from about 14 years of age. In this age range, a larger midline activation to common versus rare tones also develops. Frontal maxima appear for non-target processing at all ages, but only become apparent for target processing around age 17. Oades et al. (1997) found that N200 latencies are longer at frontal compared to posterior electrode sites. The N200 is usually considered to reflect processing that is associated with focused attention, stimulus classification and discrimination (Näätänen & Picton, 1987; Ritter, Simson, Vaughan, & Macht, 1982;
26
Vaughan Jr & Kurtzberg, 1992) and it might also be evoked in unattended situations (Picton, 1995).
Studies showed that the N200 amplitude increases with task difficulty and in response to deviant stimuli. Latency seem to be shorter during focused attention compared to diffuse attention and latencies are shorter after deviant compared to standard stimuli (Oades et al., 1997; Oades, Zerbin, & Dittmann-Balcar, 1995). Other research shows that the N200 component is the first index of target detection (Potts, Hirayasu, O'Donnell, Shenton, & McCarley, 1998). Studies that used word paradigms showed that the N200 may be elicited by physically unexpected stimuli (for discussion, see Deacon, Breton, Ritter, & Vaughan, 1991; Herning, Speer, & Jones, 1987;
Polich, 1985).
Researchers assume that the N200 is associated with “mismatch detection”, which is typically sensory (see Niznikiewicz & Squires, 1996; for a review). This view is supported by research showing that the N200 is related to the degree of mismatch between a stimulus template of a neuronal model (Näätänen & Picton, 1986; Ritter et al., 1982). Further research on visual spatial attention and letter target detection shows that the N200 may reflect an early, partly automatic process of template matching (Wijers, Lange, Mulder & Mulder 1997).
3.3.2 Is the N200 a possible marker for reading problems?
The following section reviews some results that show the connection between the N200 and reading or language related problems.
3.3.2.1 N200 and dyslexia
There are only a few reports about the N200 in dyslexic readers. Those studies usually find that N200 latencies occur later in dyslexic readers compared to typical readers, but there were no amplitude differences detected. This applied to visual and auditory tasks. In the auditory modality Fawcett, Chattopadhyay, Kandler, Jarrat, Nicolson, and Proctor (1993b) found evidence of longer N200 latencies in dyslexic children in response to tones in an oddball paradigm. The majority of studies used visual stimuli, such as Taylor and Keenan (1990) who found a later N200 in dyslexics with visual processing impairment in response to linguistic (letters, words and non-words) and nonlinguistic stimuli (symbols). Neville, Coffey, Holcomb, and Tallal (1993) used a visual recognition paradigm and found attenuated N200 latencies in dyslexics. In another study (Taylor & Keenan, 1999), three visual target tasks were presented to dyslexic children who had an auditory processing deficit and to typically reading children.
The detection tasks included an orthographic task where targets were letters with closed loops,
27
a phonological task in which targets were letters that rhymed with v, and semantic tasks where 3-letter animal names were presented. The authors found longer latencies in the semantic task in dyslexic children compared to typically reading children. Bergmann, Hutzler, Klimesch, and Wimmer (2005) found no latency changes in several ERPs, except a small one for the N200 in dyslexic readers (13 ms). Instead of finding a reduced N220 they found an enhanced component for words (and a tendency for letter strings) right after a reduced contingent negative variation (CNV). The authors interpret this pattern as a slow response of brain regions (left posterior areas) that are involved in a compensatory visual letter string processing.
3.3.2.2 The Magnocellular Theory and the N200
The magnocellular theory proposes that the magnocellular dysfunction is not only restricted to the visual pathways but also includes auditory and tactile modalities (for an overview see review by Stein , 2018). Some studies found evidence for the magnocellular theory and dyslexia (see review by Stein, 2018) some did not. One study that found evidence for the magnocellular- dorsal pathway deficit in dyslexia was the study by Jednorog, Marchewka, Tacikowski, Heim,
& Grabowska (2011). They investigated whether coherent vs. incoherent motion modulates the amplitude of N200 in a similar way in dyslexic and in control children. They found higher N200 amplitudes for coherent compared to random motion in the right hemisphere for controls but not for dyslexics. To summarize, it is possible to show a magnocellular deficit with the corresponding paradigm, but the evidence is mixed.
3.3.2.3 Language – Related N200 (or ELAN- Early Left Anterior Negativity)
In several studies, it has been found that phrase-structure violations trigger early negative deflections of the brain waves in the left frontal region. Both groups of participants showed this effect between 200-400 ms post critical word onset. No major differences in the distribution of the ELAN between the two groups were detected, but the ELAN peaked significantly earlier in the dyslexic group. The ELAN has been assumed to reflect a highly automatized processing phase of syntactic parsing (Hahne & Friederici, 1999). The results of the present study indicate that dyslexic individuals also make use of this very early mechanism and that they detect these violations even faster than the controls (Rispens, 2004).
28
3.4 The P300 component
3.4.1 What does the P300 reflect?
The P300 is a positive-going ERP-component that peaks around 280-600 ms after stimulus presentation. It is distributed centro-parietally and appears in tasks that require active discrimination (i.e. oddball paradigms) (Dunn et al., 1998; Wilson, Swain, & Ullsperger, 1998).
In passive procedures, such as tasks that do not require an intentional discrimination response, P300-like waveforms seem to have a frontal-central scalp distribution, and can occur much earlier or later than 300 ms, and typically habituate over relatively few trials (Polich, 1989;
Polich & Heine, 1996). Some research shows that the distribution of the P300 tends to be more symmetrical with increasing age, as evidenced by a significant increase in the ratio of the P300 at Fz to Pz (e.g., Johnstone, Barry, Anderson, & Coyle, 1996b). This is the case for auditory (Friedman & Simpson, 1994; Iragui, Kutas, MItchiner & Hillyard, 1993; Johnstone et al., 1996b) and visual (Molenaar, Wijker, & Molen, 1989) tasks. Even though the auditory and the visual P300 component show similar, but not identical, scalp distributions, the P300 seems to be smaller and shorter in latency in auditory responses compared to the visual P300 (Polich
& Heine, 1996). Other studies found that language stimuli elicit a larger P300 over the left hemisphere (McCarthy & Nobre, 1993; Nobre & McCarthy, 1995). The P300 is adjusted as a function of psychological parameters that reflect information processing of stimuli (Erez &
Pratt, 1992). Therefore, authors suggest that the P300 is an index of central information processing during task-related decision making (Palmer, Nasman, & Wilson, 1994). Different processes that are associated with the P300 are the dynamic updating of information in working memory (Donchin & Isreal, 1980; Fitzgerald & Picton, 1983), cognitive resource allocation and task involvement (Kramer, Strayer, & Buckley, 1991), and mental effort, or workload (Humphrey & Kramer, 1994; Wilson et al., 1998). The P300 latency is assumed to represent higher-order cognitive processes such as stimulus evaluation and categorization (Polich, 1987;
Polich & Heine, 1996). It has been assumed that the P300 latency is a temporal measure of neural activity underlying the speed of attentional allocation and immediate memory operations (Cohen & Polich, 1997; Polich & Heine, 1996). The amplitude of the P300 is thought to be related to task relevance (Hillyard & Picton, 1987), and probability, or expectancy (Comerchero
& Polich, 1999; Duncan-Johnson & Donchin, 1982; Gehring, Gratton, Coles, & Donchin, 1992;
Johnson, 1988) of the eliciting stimulus. Another feature of the P300 is the sensitivity to task/decision difficulty (Palmer et al., 1994). As an example: P300 amplitudes are larger and latencies are longer during oddball as opposed to single-stimulus recognition (Polich & Heine, 1996). The P300 seems to be inversely related to decision confidence (Hillyard, Squires, Bauer,
29
& Lindsay, 1971; Ruchkin, Sutton, & Stega, 1980), decision difficulty and stimulus discriminability (Johnson, 1986).
When using word stimuli, it was found that word type might affect the P300. Nobre and McCarthy (1995) found that, compared to other word types, exemplars elicited a larger P300 with a maximal amplitude over parietal sites. The amplitude and distribution were not different in other word types. It was also found that the P300 amplitude is larger for non-rhyming than rhyming stimuli (Ackerman, Dykman, & Oglesby, 1994; Bonte & Blomert, 2004; Molfese, Fletcher, & Denton, 2013).
Some researchers differentiated between P300a and P300b components. These two components are thought to differ in brain sources and physiological correlates (Cycowicz, Friedman, &
Rothstein, 1996). Usually, auditory or visual P300b have a central/ parietal distribution with a latency of about 280-350 ms. P300a components typically have a fronto-central distribution and have a relatively short peak latency and habituate quickly (Comerchero & Polich, 1999;
Dunn et al., 1998; Knight, 1996; Squires, Squires, & Hillyard, 1975). Both modalities elicit a frontal-central maximum P300 (or P300a) when novel stimuli appear, while frequent non-target stimuli elicit a central-parietal P300 (or P300b) (Comerchero & Polich, 1999; Verbaten, Huyben, & Kemner, 1997). In typical participants, the P300a is elicited primarily by novel stimuli which suggests that it might be associated with passive shifts of attention, or the orienting response (Comerchero & Polich, 1999; Cycowicz et al., 1996; Halgren & Marinkovic, 1995; Halgren, Marinkovic, & Chauvel, 1998). Further research underlines the view that the P300a may be more closely related to attentional processes and the P300b with categorization (Comerchero & Polich, 1999). The same authors showed that the ease of perceptual discrimination influences the P300a and P300b. The participants had to respond to a target with a button press in three-stimulus auditory and visual paradigms. The target stimulus was frequently occurring, and the non-target stimulus was infrequently occurring. Auditory stimuli were tones, and the visual stimuli were solid blue shapes. The results show that however difficult the discrimination was, the target stimulus in both modalities elicited a P300 that peaked over parietal sites. When the perceptual discrimination between the target and non- target was difficult (i.e. the target was very similar to the standard), the P300b amplitude attenuated and latency lengthened in response to target stimuli. The non-target stimuli in difficult discrimination conditions in both modalities elicited a P300 that was largest over the frontal sites and whose latency was much shorter than the latency for targets. For this reason, the P300 elicited by infrequent occurring non-targets in both modalities was very similar to the
30
P300a found in “novel” stimulus paradigms. The authors assume that these results can show that frontal lobe functions - such as attentional focus - are related with the P300a.
3.4.2 Is the P300 a possible marker for reading problems?
3.4.2.1 The P300 component and dyslexia
Many researchers found that the P300 has smaller amplitudes and longer latencies in response to both linguistic and nonlinguistic auditory and visual stimuli in dyslexics (Barnea, Lamm, Epstein, & Pratt, 1994; Duncan et al., 1994; Erez & Pratt, 1992; Fawcett et al., 1993; Harter, Anllo-Vento, Wood, & Schroeder, 1988; Harter, Diering et al., 1988; Holcomb, Ackerman, &
Dykman, 1985, 1986; Johannes, Mangun, & Münte, 1994a; Taylor & Keenan, 1990, 1990, 1999). In a more recent study using an auditory oddball paradigm with a dyslexic group of children, Papagiannopoulou and Lagopoulos (2017) observed that the amplitude of the P300 in central regions was reduced and the latency was delayed over all brain regions, but most pronounced frontally. This effect was found even though the performance in reaction times was comparable.
In the auditory modality, some researchers found smaller, but longer P300 components in dyslexic children while using simple auditory stimuli (Holcomb et al., 1986; Lovrich & Stamm, 1983). Other authors found a reversed pattern (Fawcett, Chattopadhyay, Kandler, Jarrat, Nicolson, & Proctor, 1993a). The authors observed longer P300 latencies but no differences in P300 amplitudes to target tones among dyslexic adolescents performing a selective choice reaction oddball task.
Similar results have been found in the visual domain. Neville et al. (1993) found that language impaired, reading disabled children had smaller P300 amplitudes compared to typically reading children when visual stimuli in target detection tasks were presented to them. Duncan et al.
(1994) observed attenuations in visual P300s in dyslexics compared to typically reading men with increasing task demands, but further analysis showed that group differences were accounted for by dyslexic readers with several symptoms of ADHD in their childhood. Other authors reported differences in P300 latencies such as Johannes, Mangun, and Münte (1994b), who examined visual P300s in dyslexics and typically reading children using a simple visual discrimination task. The authors found that while the P300 amplitude did not differ in the two groups, the P300 latencies were longer in dyslexics. Additionally, the component was distributed almost symmetrically over the two hemispheres in dyslexic readers, but was displayed predominantly in the left hemisphere in typical readers.