of a Pedestrian Navigation App
Robert Jackermeier
∗, Bernd Ludwig
Information Science, University Regensburg, Germany, [firstname.lastname]@ur.de
* Corresponding Author
Abstract:
Knowledge about real-life user behaviour is an important factor for the design of navigation systems. Prompted by the observation that users tend to use our campus navigation app in unexpected ways, we present a naturalistic study of navigation logs. The data set consists of sensor and interaction data from over 4600 sessions, collected over a span of several months from hundreds of users. In our analysis, we demonstrate how the core concepts from navigation literature, i. e. wayfinding and locomotion, can be observed, but also point out differences to previous studies and assumptions. One of our main findings is that the application is mostly used to plan routes in advance, and not to navigate along them.
Furthermore, detailed case-studies of actual navigation sessions provide a unique insight into user behaviour and show that persons are often not focused on their navigation task but engaged otherwise. Based on these results, we formulate design implications that do not only apply to future iterations of our application, but can be seen as best practices for pedestrian navigation apps in general.
Keywords: pedestrian navigation, naturalistic study, user behaviour
1. Introduction
Information about a user’s context is an essential require- ment for any system that aims to provide targeted assis- tance. In personal navigation systems, determining the ex- act location is usually of primary interest, but other factors such as user behaviour should be considered just as impor- tant. Navigation success depends on whether the system can use this information to decide when and how to present new instructions. As a step towards this goal, in the present study we explore what insights can be gained based on nat- uralistic log data of our campus navigation app.
For the past 4 years, we have been providing a web-based navigation system for our university campus, with about 50-100 daily visits leading to 15-30 navigation sessions during weekdays, and up to 500 visits during large con- ferences or when a new semester begins. This underlines the necessity for such a system and indicates that many people are — at least partly — unfamiliar with the envi- ronment. In order to provide additional assistance during the whole navigation process, we released the system as a smartphone application, with the main advantage of ac- cess to device sensors and functionality that can be used for indoor positioning. Being able to collect more sensor data also allows for additional insights about the behaviour during navigation, which is especially of interest for the present work. Looking at the log files however, we noticed that usage patterns differed from what we had expected based on previous studies, e. g. causing worse positioning performance and aborted navigation sessions.
This leads us to the questions at hand: How is a (pedes- trian) navigation system actually used in real life? And how does user behaviour in the wild differ from that in controlled experiments?
In the remainder of the paper, we first look at related work, then briefly describe the app and data collection method.
After a gaining an overview of the data set, we highlight several aspects in more detail by means of illustrative ex- amples, followed by a discussion of the results and possi- bilities for future work.
2. Related Work
Many studies about smartphone use in general employ nat- uralistic methods, e. g. by investigating the influence of context and interactions with other people (Brown et al., 2014) or by analysing app usage patterns (B¨ohmer et al., 2011, Jones et al., 2015). To our knowledge however, no studies focusing on smartphone-assisted pedestrian navi- gation behaviour based on naturalistic log data have been published so far, most likely due to the lack of systems in academic use.
In their study of pedestrian outdoor navigation, Webber et al. observed three different strategy groups, ranging from persons who need constant support to ones that are mostly inattentive (Webber et al., 2012). Test persons were sent on predefined routes, with an experimenter following be- hind, intervening only if needed. A true naturalistic study was done by Ruggiero et al., who collected a large data set of walking trajectories by means of a camera setup in or- der to derive mathematical models, but the experiment was confined to a small indoor area (Ruggiero et al., 2018). Fi- nally, Brajdic and Harle investigated the influence of differ- ent carrying modes of mobile devices on step detection. In their semi-controlled experiment, they roughly instructed test persons to walk along a path in varying speeds of their choosing, carrying devices in different positions and orien- tations (Brajdic and Harle, 2013).
In an earlier study of ours (Jackermeier and Ludwig, 2018),
12 test persons were sent on 3 routes (ranging from 151 to 190 metres) each, with the navigation app as guidance and an experimenter following behind. The same setup was used in our latest controlled study, where 100 test per- sons had to navigate along a route of more than 300 metres across multiple buildings on the campus.
We observe that both in our own studies and in the lit- erature, the experiment setup usually consists of prede- fined test routes that have to be completed from start to fin- ish, with some help by the experimenter if necessary, e. g.
when the test person gets lost (Webber et al., 2012). As the experiments are carried out on special test devices and not on the test persons’ personal devices, there is no possibility of interruptions due to received messages or phone calls, and therefore the system under evaluation always stays in the foreground.
Furthermore, we made the experience that test persons, be- ing in an experiment situation, usually pay attention to the navigation instructions and are carrying the device in front of their body, pointing the screen towards them, even with- out being told to do so. Consequently, they are ready to interact with the system at any time.
In the following sections, we will explore how well these observations and assumptions hold up in a naturalistic sce- nario.
3. Navigation App and Data Set
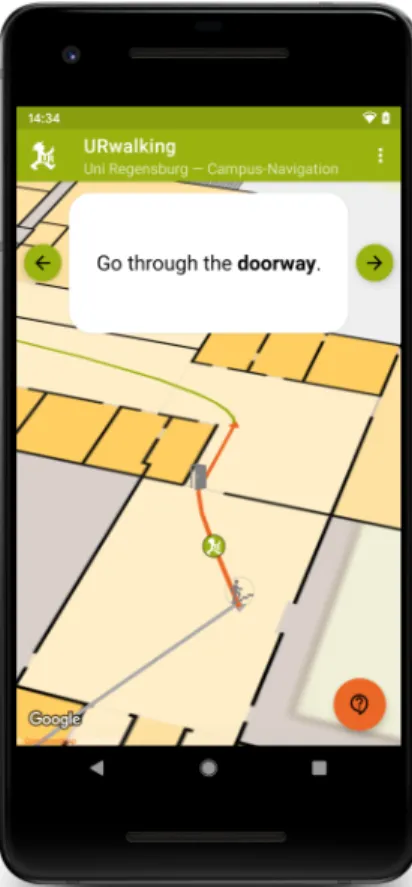
The navigation app used in this study was designed for An- droid smartphones and tablets, providing the same basic functionality as our existing web application. This entails the calculation and presentation of arbitrary routes across the campus, text-based instructions that rely on nearby land- marks, and the possibility to swipe through these instruc- tions and to zoom and pan the map. Since we expected the app to be used as a companion during walks across the campus, an indoor/outdoor localisation system is cou- pled with the navigation logic. Nearby landmarks can be displayed on demand, with the option to take pictures and add new ones. In case of erroneous localisation, users can correct their position, automatically triggering a re-routing process, if needed. The app’s user interface during naviga- tion, with schematic map, route segments, navigation in- structions and estimated user position, is shown in Fig. 1.
The app is available for free in the Google Play Store.
Users can opt in to anonymously share their usage data for research purposes. Over a period of almost ten months, 4655 sessions from 643 different devices were registered.
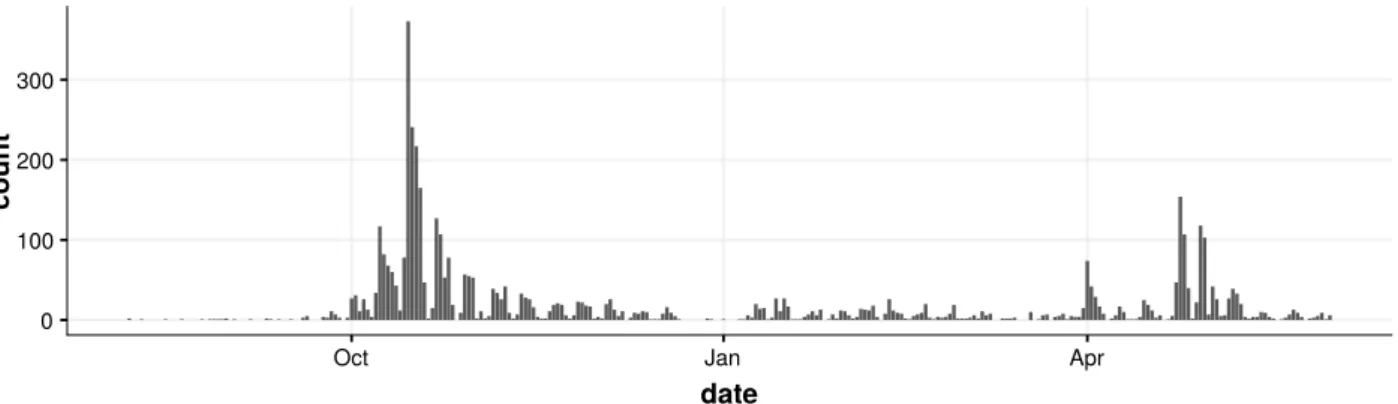
At the beginning of the semester, the number of daily ses- sions peaked at over 300 (suggesting that many of our users are students), the regular amount being about 10–20 on weekdays, with very little activity on weekends (see Fig. 2).
In every session, several different kinds of data are col- lected:
• start, destination, and the route that was calculated by the routing server
• interactions with the user interface (zooming, pan- ning, switching instructions, ...)
• sensor data (detected steps, device orientation and ac- celeration, Wi-Fi, GPS, ...)
Figure 1. User interface of the app during navigation.
• position during navigation (as estimated by the app’s positioning system)
• device information (randomly generated device ID, Android version, available sensors)
A session begins as soon as the navigation view opens, i. e. after the route has been calculated. Since the user’s progress keeps being tracked while the app is in the back- ground, sessions continue until it is explicitly closed.
As is common when analysing naturalistic log data, some cleanup was inevitable. All sessions that originated from our own devices, may it be due to development, testing, or controlled experiments, were excluded. Since not all Android devices contain the same types of sensors, they produce different logs, sometimes even with implausible timestamps, which led to difficulties in determining the true session length when the app was closed unexpectedly.
For these cases, a heuristic based on several different sen- sor logs was used.
4. Finding Actual Navigation Sessions
During a quick glance over the log files, it became apparent from different factors such as session length or starting po- sition that many sessions do not contain any navigation on campus, contrarily to the originally intended use of the app.
Since the upcoming analysis focuses on sessions where ac- tual navigation happens, those that aren’t of interest need to be filtered out first.
4.1 Session Length
The length of a session can be measured in multiple ways.
A look at the duration reveals a long-tail distribution (Fig.
0 100 200 300
Oct Jan Apr
date
count
Figure 2. App usage over time. Notice the periodic weekly patterns and the peaks when a new semester starts (in October and — to a lesser extent — in April).
3), where the median session length amounts to just 80 sec- onds. This result is in line with the observations for general app usage (B¨ohmer et al., 2011). Since — as mentioned above — a navigation session continues while the app is in the background, defining session length by duration is somewhat problematic. In fact, some of the longer ses- sions can only be explained by periods of other activities happening inbetween.
A better way to measure session length is by counting the amount of steps a user takes, especially in combination with the chosen route. In a large portion of all sessions (57%), we only observe a small amount of steps (0–10), and therefore cannot consider them to be actual navigation sessions. Between 10 and 100 steps are registered in an- other 16% of the sessions, while the rest (26%) consists of more than 100 steps. Taking the route into account, we find that — assuming an average step length of 0.7 metres — in 13% of the cases the walked distance equals or exceeds the route length. This, of course, does not necessarily mean that the navigation was finished successfully. Users can optionally tell us in the app that they reached their destina- tion, which happened in 3.8% of the cases. In 22% of all sessions the route (length) is completed at least halfway; in 29% the walked distance amounts to a quarter or more.
We conclude from these observations that many users do not use the app as a companion, and even those who ini- tially intended to follow the route often abort the naviga- tion process after a while.
4.2 Start Positions
The initial user position is determined by Android’s builtin location services, which in turn are leveraging GPS, Wi-Fi and cellular information. While positioning accuracy in- side buildings is usually not high enough to pinpoint exact locations, it is definitely possible to distinguish between locations on and off the university campus.
About 46% of all sessions are started on the campus, while 24% originate from somewhere else. In the remaining 30%, no user position was detected, either due to the session being too short, technical difficulties, or system settings preventing access. Routes can only be calculated within the campus borders, therefore well-known locations such as the bus station often serve as manually entered start- ing points when the actual user location is off-campus. A Wilcoxon rank-sum test indicates that sessions started on
the campus last significantly longer (Mdn = 2.36 min) than those started elsewhere (Mdn = 0.97 min, W = 1461408, p < 0.01).
In this context, we can also investigate the distances be- tween the initial user position and the starting point of the route. While it is not evident from the log files whether a user opted to use the current position as starting point, the respective coordinates are available. As a heuristic, we can assume that distances below 25 metres are likely due to the
“start from current position” feature — the device’s posi- tioning accuracy is usually lower than that inside buildings.
This happens in only 17% of all sessions, while in another 8% the distance lies between 25 and 50 metres. In all other cases it is either even higher (45%) or, as described above, could not be determined (31%).
To conclude the overview over the data set, we observed that many users evidently just use the application to look up routes in advance, without planning to engage in actual, guided navigation. Sessions are oftentimes very short, do not originate from where the route begins, or are aborted after a little while.
5. Behaviour during Navigation
For the analysis of user behaviour during actual navigation, the sessions are filtered using the following criteria, based on what we’ve learned until now and considering the size of the campus: A session has to start within the university campus, with a route of 100 metres or more that is com- pleted at least half-way. Furthermore, the session needs to last at least 2 and at most 30 minutes. After applying these restrictions, we are left with 395 sessions from 211 differ- ent users/devices, to which all of the following figures and observations relate. In order to illustrate the different as- pects of the analysis, we introduce each concept by means of a representative example before applying the method to the data set in general.
5.1 Activity Patterns and Pauses
The first aspect of interest is whether different navigation phases as described in the literature can be observed from our data. Navigation is generally thought of as a com- bination of wayfinding and locomotion (Montello, 2005).
Therefore, one would expect to see short orientation peri-
ods, followed by locomotion, maybe with a planning phase
at the beginning.
0 500 1000 1500 2000
0 20 40 60
duration [minutes]
count
Figure 3. Distribution of session durations. (308 sessions > 60 minutes omitted for clarity.)
0 2 4 6
09:55 10:00 10:05 10:10
time accel. magnitude [ m /s
2]
moving stationary
Figure 4. Example for a navigation session with intermittent stationary or inactive periods. Grey areas indicate when steps were detected.
One of the best ways to infer this information is by analy- sing accelerometer readings in order to find out when the device is almost stationary, meaning that the user either is standing still or put it down somewhere. Fig. 4 shows an example for a session where this behaviour can be ob- served. After filtering out noise using a moving average with a window size of 200 (corresponding to an interval of 2 seconds at 100 Hz sampling frequency), a threshold of 0.2 m/s
2is applied to distinguish between a stationary and a moving device, indicated by red and green dots respec- tively. The flat red line near the beginning suggests that the device is resting completely, while the intermittent periods of low activity later on likely correspond to phases where the user stops and needs to re-orient himself.
Looking at the data set in general, we find that these (al- most) stationary periods amount to 15.9% of navigation time across all sessions.
Moments of pausing or hesitation during the navigation where the device is not necessarily at rest can also be iden- tified by looking at the data reported by Android’s step de- tector sensor. Again in Fig. 4, the periods where steps were detected at most five seconds apart are marked in grey, re- vealing a lot of inactivity (i. e. lack of locomotion) through- out the session, coinciding with but also going beyond the stationary phases mentioned before.
Indeed, when applied to the whole data set, we find that
users spend only 59.3% of their time walking actively, paus- ing five times per session on average. With a stricter defi- nition where all pauses longer than one second are counted
— still significantly longer than a typical step, even for slow gait (Oberg et al., 1993) —, this number further de- creases to 49.3% (Mdn = 16 pauses / session).
Until now, we’ve assumed that a user’s attention is exclu- sively on the navigation system. As mentioned in Sec- tion 3 however, navigation sessions and data collection do continue in the background (since e. g. the position has to be tracked during these periods as well). For about half of the sessions, detailed logs about when the app itself is paused, i. e. other apps were used inbetween or the screen was turned off, are available.
Fig. 5 shows an interesting case where the periods during which the app is in the background (marked in grey) cor- respond to a higher activity (in terms of measured accel- eration magnitude). Our log data does not provide infor- mation whether another app was used during this time or whether the screen was simply turned off. The latter seems more plausible for this example, with the higher accelera- tion caused e. g. by a swinging arm or periodic step motion (see next section).
In the data set in general, these background periods occur
at least once in 145 out of 208 sessions, with a median
0.0 2.5 5.0 7.5 10.0
07:26 07:28 07:30 07:32 07:34
time accel. magnitude [ m /s
2]
moving stationary
Figure 5. Example for a navigation session where the app is running in the background on several occasions (marked in grey).
amount of 2 per session and a long-tail distributed duration (Mdn = 27 seconds). This means that persons are often either interrupted, e. g. by phone calls or messages, or turn off the device deliberately; the reason for the latter could simply be that they don’t need navigation assistance at the moment.
5.2 Device Orientation and Carrying Mode
The fact that users sometimes put the app aside — phys- ically or metaphorically — needs to be explicitly consid- ered in a navigation concept. Instead, our initial assistance strategy relied on the user being able to receive instructions at any time and place.
As mentioned above, based on what we had observed in previous studies, we expected users to hold the device in front of their body during navigation, pointing roughly in walking direction. This assumption can be tested by look- ing at the device orientation, measured by Android’s Game Rotation Vector sensor, which fuses data from accelerom- eter and gyroscope.
While without ground truth it is not possible to make any statements about whether the compass direction coincides with the walking direction, we can infer the current car- rying mode by looking at the angle in Z direction, i. e.
whether the device is held horizontally or pointed upwards or downwards. In contrast to e. g. Brajdic and Harle, who investigate six different modes or positions (Brajdic and Harle, 2013), we only distinguish between two cases that can be recognised relatively easily from unlabelled data:
In what we’ll call active usage mode — in the literature referred to as “texting mode” (Klein et al., 2018) — the device needs to be about horizontally or tilted upwards, or specifically somewhere in the range of –20 and +60 de- grees that accounts for most of the values in controlled ex- periments where the phone was always held that way. Con- trarily, we call it passive mode when the device is pointing downwards at an angle below –20 degrees, which usually means it is swinging besides the body, or pointing almost straight up or down, indicating that is was put away into a pocket. For our analysis, the exact carrying position (front/back pocket, bag, ...) does not matter. Instead, the two modes reflect whether the user can immediately react to new navigation instructions (and therefore use the app in its intended way) or not.
Fig. 6 illustrates the observations on a real example. As above, a moving average is applied that helps smoothing
the signal in case of large variance, e. g. when the de- vice is swinging in an outstretched arm, which otherwise might lead to many mode changes. The device is initially held almost horizontally, then after a while pointed straight down (red dots, passive mode), most likely put into a pants pocket, before being pulled out again. Over the course of the navigation process, this procedure is repeated several times.
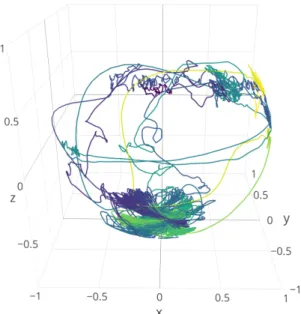
When the same session is visualised in all three dimen- sions, additional patterns emerge: The graph shown in Fig.
7 can be thought of as the trace left behind by an imag- inary laser pointer attached to the device along the local Y axis, i. e. parallel to the long side of the screen, while the device is located at the origin of the coordinate sys- tem. Clearly visible are the clusters near the middle (with z approximately between 0 and 0.5) and at the bottom, cor- responding to active and passive mode. Whenever a mode change occurs, a line can be seen connecting the two clus- ters. Note that we use the unfiltered data set here, allowing us to identify repeating patterns near the bottom, created by periodic walking motion with the device in the pocket.
Applying this analysis to all navigation sessions, we ob- serve that active mode accounts for 71.8% of all time. How- ever, in just about a quarter (26.0%) of the sessions, the device is held in active mode over the course of the whole navigation process. In all remaining sessions at least one mode change happens, with a median amount of 4, occur- ring from very early on in many sessions, peaking roughly at the two-minute mark.
Fig. 8 shows the device orientation distribution across all navigation sessions. Notice the sharp peaks at -1 and 0, corresponding to the device pointing straight down (pre- sumably in a pocket) and laying flat, respectively. Besides that, users mostly opt to hold the device angled slightly upwards.
In comparison, in our latest controlled study (mentioned in Section 2), the overall time in active mode was over 99%, and in 77 out of the 100 runs, the device was always held that way. The median amount of mode changes across all runs therefore is zero. Test persons were given the same app that is publicly available, the only difference being that they had to explicitly confirm the completion of each nav- igation step.
In our earlier study (Jackermeier and Ludwig, 2018), test
persons were not required to interact at all; in fact, the ex-
-1.0 -0.5 0.0 0.5 1.0
13:54 13:56 13:58 14:00
time
dir ection v ect or [z]
mode
active passive
Figure 6. Example for a navigation session with multiple mode changes, suggesting that the user is either familiar with or able to partially memorise parts of the route.
Figure 7. The same session as in Fig. 6, visualised in 3D. The coloured trace on the unit sphere indicates device orientation over time.
perimenter was remotely controlling the app, thereby guar- anteeing the test person to be always provided with action- able and valid navigation instructions. But still, all of them opted to keep the device in active mode the whole time, consequently no mode changes were detected at all.
In contrast to these experiments, the naturalistic data pre- sented so far proves that the assumption of a user who can interact with the navigation app at any time does not hold up in reality.
5.3 Explicit Interactions
Until now, the analysis focused on the sensor capabilities a native application provides. Additional insight into user behaviour can be gained by the explicit interactions with the app’s interface, i. e. when the user pans or zooms the map, switches between instructions manually etc.
By default, the map follows the user position, keeping the current route section centred. Instructions change automat- ically when a new route section is entered, but can also be switched manually by either pressing the buttons next to them or by swiping them left or right (see Fig. 1).
-1.0 -0.5 0.0 0.5 1.0
0 300000 600000 900000
count
direction vector [z]
Figure 8. Device orientation across all navigation sessions.
Fig. 9 revisits the example from section 5.1, this time addi- tionally displaying interaction data. Map interactions (“pan”
and “zoom”) tend to occur in clusters, while instructions are switched throughout the session, in this case only ever forward and never back to a previous one. Combined with acceleration data and information about the application state (grey background periods), this completes the picture about when wayfinding and locomotion occurs.
Looking at the whole data set, panning or zooming the map happens at least once in a majority of navigation sessions (89.6%), with a median of 18.5 of those interactions. In- structions are changed significantly less frequently in only 52.6% of all navigation sessions (Mdn = 8.5 interactions / session). It is worth noting that 9 out of 10 times, the in- struction is moved forward, suggesting that users generally want to plan ahead.
In terms of additional interactions, in 1 out of 10 sessions a nearby landmark is clicked on in order to display a picture that provides aid during wayfinding. Other options such as landmark upload, proactive position correction or the feedback functionality occur even less frequently.
6. Discussion and Future Work
The analysis has shown that the main concepts known from
the literature can be identified in our naturalistic data set.
0.0 2.5 5.0 7.5 10.0
07:26 07:28 07:30 07:32 07:34
time accel. magnitude [ m /s
2]
action
forward pan zoom