Gp130 Signaling In POMC Neurons Is Required For CNTF-Induced Anorexia
Inaugural-Dissertation zur
Erlangung des Doktorgrades
der Mathematisch-Naturwissenschaftlichen Fakultät der Universität zu Köln
vorgelegt von Ruth Kuschewski
aus Köln
Berichterstatter: Prof.Dr. med. Jens C. Brüning PD Dr. F. Thomas Wunderlich
Tag der mündlichen Prüfung: 26.05.2011
Table of Contents
1. Table of Contents
1. Table of Contents... I
2. Figure Index... III
3. Table Index ... III
4. Abbreviations ... IV
5. Introduction ... 1
5.1. Obesity... 1
5.2. Energy homeostasis ... 1
5.3. Insulin and the insulin receptor ... 2
5.4. Leptin ... 3
5.4.1. The leptin receptor ... 4
5.5. Central regulation of energy homeostasis ... 6
5.5.1. The hypothalamus... 6
5.5.2. POMC, the melanocortin system and the regulation of energy homeostasis ... 8
5.6. The hypothalamic-pituitary-adrenal axis... 12
5.7. Gp130 and cytokine signaling... 13
5.7.1. Cytokines ... 13
5.7.2. The interleukin-6-type cytokine family ... 13
5.7.3. Class I cytokine receptors and gP130 ... 13
5.7.4. Cytokine signaling ... 15
5.8. CNTF ... 17
5.8.1. CNTF and the CNS ... 18
5.8.2. Axokine ... 18
5.9. Objectives ... 19
6. Material and Methods ... 20
6.1. Chemicals ... 20
6.2. Animals ... 22
6.2.1. Generation of PomcCre-gp130lox/lox mice... 22
6.2.2. Restraint stress and LPS treatment... 22
6.2.3. Glucose and insulin tolerance tests... 23
6.2.4. Indirect calorimetry and food intake... 23
6.2.5. Icv cannula implantation... 24
6.2.6. Icv injections... 24
6.2.7. Axokine treatment ... 24
6.2.8. Molecular biology ... 25
6.2.9. Isolation of genomic DNA... 25
6.2.10. Polymerase chain reaction (PCR) ... 25
Table of Contents
6.3. Analytical procedures ... 27
6.3.1. ELISA and RIA ... 27
6.3.2. Protein extraction ... 27
6.3.3. Western blot analysis ... 27
6.4. Immunohistochemistry... 28
6.4.1. Intraveneous stimulation and tissue preparation ... 28
6.4.2. Tissue preparation without stimulation ... 29
6.4.3. POMC cell counting... 29
6.4.4. Immunostainig for c-Fos... 30
6.5. Statistical methods... 30
7. Results ... 31
7.1. POMC-restricted inactivation of gp130... 31
7.2. Abolished CNTF-stimulated STAT3 tyrosine phosphorylation in POMC cells of gp130∆POMC mice. 33 7.3. Unaltered POMC cell numbers and stress response in gp130∆POMC mice. ... 35
7.4. Normal energy and glucose homeostasis in gp130∆POMC mice. ... 37
7.5. Blunted anorectic response to centrally injected CNTF in gp130∆POMC mice. ... 40
7.6. CNTF fails to induce c-Fos immunoreactivity in the PVN of gp130∆POMC mice. ... 42
7.7. Reduced weight loss in gp130∆POMC mice after chronic Axokine treatment. ... 43
8. Discussion... 45
8.1. CNTF: a potential therapeutic tool for the treatment of obesity... 45
8.2. POMC-specific deletion of gp130. ... 46
8.3. Impaired anorectic response to acute central CNTF treatment and reduced body weight loss during chronic systemic Axokine treatment in gp130∆POMC mice. ... 47
8.4. Hypothalamic and peripheral effects of CNTF... 50
8.5. Disruption of gp130 provides insight to several signaling pathways ... 52
8.6. Perspectives ... 53
9. Summary... 54
10. Zusammenfassung ... 55
11. References... 56
12. Acknowledgements ... 69
13. Erklärung ... 70
Index
2. Figure Index
Figure 1.1: Leptin receptor signaling. ... 5
Figure 1.4: Schematic anatomical structure of the hypothalamus. ... 7
Figure 1.5: Central regulation of energy homeostasis. ... 9
Figure 1.6: The HPA-axis ... 12
Figure 1.2: Class I cytokine receptors. ... 15
Figure 1.3: Cytokine signaling. ... 16
Figure 3.1: POMC-specific inactivation of the gp130 gene... 31
Figure 3.2: eGFP immunoreactivity pattern in the ARC of gp130∆POMC mice... 32
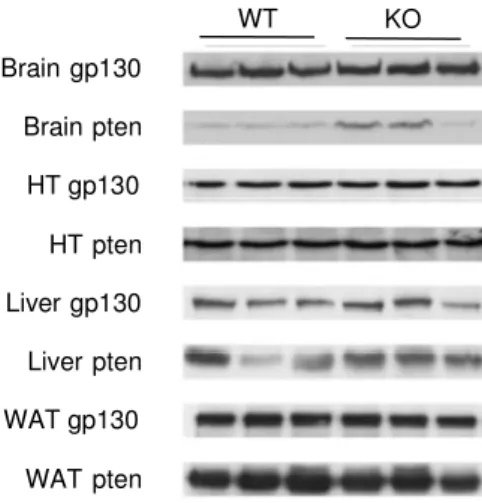
Figure 3.3: Western blot analysis of gp130 expression. ... 33
Figure 3.4: Specific ablation of gp130 signaling in POMC neurons. ... 34
Figure 3.5: Unaltered POMC cell numbers and distribution... 35
Figure 3.6: Pituitary POMC expression. ... 36
Figure 3.7: Unaltered stress response in gp130∆POMCmice... 37
Figure 3.8: Normal energy homeostasis in gp130∆POMC mice... 38
Figure 3.9: Unaltered glucose metabolism in gp130∆POMC mice. ... 39
Figure 3.10: Blunted anorectic response to centrally injected CNTF in gp130∆POMC mice... 41
Figure 3.11: Gp130∆POMC mice are resistant to the acute anorectic effect of centrally injected CNTF. ... 42
Figure 3.12:. The effect of chronic Axokine treatment is impaired in gp130∆POMC mice ... 43
3. Table Index
Table 1: Chemicals... 20Table 2: Oligonucleotides for genotyping ... 26
Abbreviations
4. Abbreviations
°C degrees Celsius
3’ three prime end of DNA sequences 5’ five prime end of DNA sequences
A adenosine
a.m. ante meridiem ACTH adrenocorticotrophin AgRP agouti-related peptide AKT proteinkinase B
ALS amyotrophic lateral sclerosis AMPK AMP activated protein kinase ARC arcuate nucleus
BAT brown adipose tissue BBB blood brain barrier BMI body mass index
bp base pairs
C cytosine
c DNA concentration
CaCl2 calcium chloride
cAMP cyclic adenosine monophosphate cDNA complementary DNA
CLAMS Comprehensive Laboratory Animal Monitoring System
cm centimeter
CNS central nervous system CNTF ciliary neurotrophic factor
CNTFAx15 Axokine, recombinant human variant of CNTF Cre site specific recombinase from phage P1 CRH corticotrophin-releasing hormone
CT-1 cordiotrophin-1
Abbreviations
Da Dalton
DAPI 4',6-diamidino-2-phenylindole
db/db mice homozygous for a point mutation in the leptin receptor gene ddH2O double destilled water
DMH dorsomedial hypothalamic nucleus DMSO dimethylsulfoxide
DNA desoxyribonucleic acid DNase desoxyribonuclease
dNTP desoxyribonucleotide-triphosphate DTT 1,4-Dithio-DL-threitol
e.g. exempli gratia
ECL enhanced chemiluminescence EDTA ethylendiamine tetraacetate
eGFP enhanced green fluorescent protein ELISA enzyme-linked immunosorbent assay Erk extracellularsignal-regulated kinase EtBr ethidium bromide
EtOH ethanol
floxed / lox loxP flanked
FOXO1 forkhead-O transcription factor 1
g gram
G guanine
G6Pase α glucose-6-phosphatase α
Gab growth factor receptor binding protein associated binder GABA γ-aminobutyric acid
GFP green fluorescent protein GLP-1 glucagon-like peptide 1 GLUT-4 glucose transporter 4 gp130 glycoprotein 130
Grb2 growth factor receptor binding protein 2 GTT glucose tolerance test
Gusb glucuronidase beta
h hour
Abbreviations
H&E hematoxylin/eosin H2O2 hydrogen peroxide HCl hydrochloric acid
HEPES N-2-hydroxyethylpiperazine-N’-2-ethansulfonic acid HFD high fat diet
HGP hepatic glucose production HPA hypothalamic-pituitary-adrenal
Hprt-1 hypoxanthine guanine phosphoribosyl transferase-1 i.e. id est
ip. intraperitoneal
icv intracerebroventricular IGF-1 insulin-like growth factor-1 IKK inhibitor of kappaB kinase IL-11 interleukin-11
IL-6 interleukin-6
IL-6R interleukin-6 receptor IR insulin receptor
IRES internal ribosome entry site IRS insulin receptor substrate ITT insulin tolerance test
JAK Janus kinase
JNK c-Jun N-terminal kinase;
k kilo
kb kilobase pairs KCl potassium chloride kDa kilodalton
KOH potassium hydroxide
L liter
LacZ gene encoding the enzyme ß-galactosidase Lepr leptin receptor
LH lateral hypothalamic area
Abbreviations
m milli
M molar
MAPK mitogen-activated protein kinase MCR melanocortin receptor
ME median eminence
MEK MAPK/Erk Kinase MgCl2 magnesium chloride
min minute
mm milimeter
mRNA messenger RNA
MSH melanocyte-stimulating hormone
n nano-
n counts
Na2HPO4 disodium hydrogen phosphate Na3O4V sodium orthovanadate
NAc nucleus accumbens NaCl sodium chloride NaF sodium fluoride
NaH2PO4 monosodium phosphate NaHCO3 sodium bicarbonate NaOH sodium hydroxide
NIRKO neuron-restricted insulin receptor knockout mice NMR nuclear magnetic resonance
NPY neuropeptide Y
ob/ob mice homozygous for mutation in the leptin gene ObRb long isoform of the leptin receptor
OD optical density OSM oncostatin M
p pico-
P phospho
PAGE polyacrylamid gel electrophoresis PB phosphate buffer
PBS phosphate buffered saline
Abbreviations
PCR polymerase chain reaction
PDK1 phosphoinositide-dependent protein kinase 1 PFA paraformaldehyde
PH pleckstrin homology
PI3 kinase phosphatidylinositol 3 kinase PIP2 phosphatidylinositol (4,5) bisphosphate PIP3 phosphatidylinositol (3,4,5) trisphosphate POMC pro-opiomelanocortin
PTB phosphotyrosine binding
PTEN phosphatase and tensin homolog PVN paraventricular nucleus
Raf proto-oncogene serine/threonine protein kinase Ras Ras small GTPase
rhCNTF recombinant human CNTF RNA ribonucleic acid
RNAi RNA interference RNase ribonuclease rpm rounds per minute RT room temperature
RT-PCR real-time polymerase chain reaction
s second
s.c. subcutanous
SCD-1 stearoyl-CoA desaturase-1 SDS sodiumdodecylsulfate
sec second
SEM standard error of the mean
SH src homology
Shp-2 tyrosine phosphatase-2 SIM-1 single minded homolog-1 SN substantia nigra
SOCS suppressor of cytokine signaling
Abbreviations
ß-me ß-mercaptoethanol
STAT signal transducer and activator of transcription TAE Tris-acetic acid-EDTA buffer
TBP TATA-box binding protein TBS Tris buffered saline
TE Tris-EDTA buffer Th tyrosine hydroxylase TNF-α tumor necrosis factor-α
Tris 2-amino-2-(hydroxymethyl-)1,3-propandiole
Trp tryptophan
TWEEN polyoxethylene-sorbitan-monolaureate
Tyr tyrosine
U units
UV ultraviolet
V Volt
v/v volume per volume
VMH ventromedial nucleus of the hypothalamus VO2 volume of consumed oxygen
VTA ventral tegmental area w/v weight per volume WAT white adipose tissue WHO World Health Organization ZnSO4 zinc sulfate
µ micro-
Introduction
5. Introduction
5.1. Obesity
The prevalence of adult obesity and overweight among children has increased dramatically during the last decades. The World Health Organization (WHO) released that in 2005 approximately 1.6 billion adults were overweight and at least 400 million adults were obese. The WHO further projects that by 2015, approximately 2.3 billion adults will be overweight and more than 700 million will be obese. Overweight and obesity are defined as abnormal or excessive fat accumulation that may impair health (1), either leading to serious health consequences. Risk increases progressively as Body Mass Index (BMI) increases. Raised BMI is a major risk factor for chronic diseases including cardiovascular diseases (e.g. hypertension, heart diseases and stroke), diabetes mellitus type 2, sleep apnea and certain forms of cancer (2-4).
The BMI is a simple index of weight-for-height that is commonly used in classifying overweight and obesity in adult populations and individuals. It is defined as the weight in kilograms divided by the square of the height in meters (kg/m2). The World Health Organization defines "overweight" as a BMI equal to or more than 25, and
"obesity" as a BMI equal to or more than 30 (1).
The fundamental cause of obesity and overweight is an energy imbalance between calories consumed on one hand, and calories expended on the other hand. The rapid increase in obese people results from a combination of genetic predisposition, enhanced availability of high-energy foods, and decreased physical activity in modern society. Lifestyle modifications and obesity drugs are the current efforts to diminish the growing epidemic, but so far, none of them is capable of ensuring a consistent and effective weight loss. As a result, new therapeutic approaches are required to treat the obesity epidemic.
5.2. Energy homeostasis
Obesity is the result of a long-term positive body energy balance namely, energy intake is greater than energy expenditure thus, excess calories are stored in the form
Introduction
Energy homeostasis is primarily regulated by the central nervous system (CNS) (5).
Neuronal systems involved in regulation of energy intake, energy expenditure and endogenous glucose production sense and integrate input from peripheral hormones and nutrient-related signals that transmit information about body energy stores and energy availability to the brain (5). Under circumstances of sufficient energy stores and energy availability, the CNS receives afferent signals that lead to the activation of anabolic pathways (inhibition of energy intake and endogenous glucose production, increase of energy expenditure and mobilization of fat stores).
Conversely, in the state of low energy stores and food deficiency, catabolic responses are activated to promote positive energy balance (increased energy intake and glucose production, decreased energy expenditure).
The afferent signals that are crucial for the regulation of energy homeostasis include the pancreatic β-cell hormone insulin as well as the adipocyte-derived hormone leptin.
5.3. Insulin and the insulin receptor
The anabolic peptide-hormone insulin is produced by the β-cells of the pancreatic islets of Langerhans. Insulin was discovered in 1921 by F. Banting, C. Best, J.
Macleod and J. Collip., two years later, F. Banting and J. Macleod were awarded the Nobel Prize in Medicine for their discovery. In 1953, the primary sequence of insulin was decoded (7), followed by the crystal structure of the active form in 1966 (8). One year later, Steiner et al. identified the inactive precursor proinsulin, which is cleaved to insulin by different endopeptidases (9, 10).
Insulin secretion from the pancreatic ß-cells is triggered predominantly in response to increased blood glucose levels (11, 12). Additionally, plasma insulin levels are also directly linked to the degree of body adiposity (13, 14). Insulin acts on peripheral tissues, particularly on muscle cells and adipocytes via translocation of the glucose transporter to remove the glucose from the blood and store it in form of glycogen (11, 15). Moreover, insulin promotes anabolic processes such as stimulation of amino acid uptake and protein synthesis in muscle, glycogen synthesis in liver and muscle as well as lipogenesis in adipose tissue. Catabolic processes, on the other hand, such as glycogenolysis, lipolysis and proteolysis are inhibited by insulin (16).
Introduction
In addition to its peripheral action, insulin circulates in proportion to the amount of body fat, crosses the blood-brain-barrier via a saturable transporter and acts on the CNS as an adiposity signal (17-20).
The heterotetrameric insulin receptor is ubiquitously expressed and belongs to the family of ligand-activated receptor tyrosine kinases. Binding of insulin leads to autophosphorylation of the receptor on three intracellular tyrosine residues resulting in complete activation of the intrinsic tyrosine activity of the receptor.
Receptor autophosphorylation results in recruitment and binding of intracellular proteins via their phosphotyrosine binding domains. Signaling molecules for the insulin receptor include the insulin receptor substrate (IRS) proteins 1-4 which are phosphorylated upon binding to the receptor, and thereby serve as a docking platform for other proteins, leading to the action of different downstream signaling pathways.
There are two major pathways activated by the IRS proteins, the Ras/Raf Mitogen activated protein (MAP) kinase and the PI3 (phosphatidyl-inositol 3) kinase pathway (21).
5.4. Leptin
Leptin is a 16-kDa protein encoded by the ob (obese) gene with a structure similar to the 4-α-helical bundle cytokines (22). It is a circulating hormone secreted by the adipose tissue. First described in 1994 (23), leptin has proven to be a key metabolic protein that has actions throughout the body. Mice with mutations of the gene encoding leptin (ob/ob mice) as well as mice with mutations compromising the leptin receptor (db/db mice) become pathologically obese, infertile, hyperphagic, hypothermic, and diabetic (24). Analogous to insulin, plasma leptin levels are correlated directly with adipose tissue mass, and circulating leptin is transported into the brain via a saturable process (25, 26). A neuron-specific deletion of the leptin receptor bears analogy to the phenotype of the db/db mouse, indicating that the major role of leptin action to control energy homeostasis is accounted for by its signaling in the CNS (27).
Introduction
5.4.1. The leptin receptor
Several leptin receptor isoforms (LEPR-A to F) are encoded by a single leptin receptor gene, each containing an identical ligand binding domain, but varying by the presence or absence of a transmembrane domain or a complete cytosolic domain (28). Among the different isoforms, all arising from alternative mRNA splicing and/or proteolytic processing of the single Lepr gene (29, 30), only the long form of the leptin receptor (Ob-Rb) has been shown to activate intracellular signaling (31). Many effects of leptin on energy homeostasis are assignable to its action in the CNS, especially in the mediobasal hypothalamus, where the Ob-Rb is highest expressed (32). Ob-Rb is highly conserved among species and is essential for leptin action as observed in db/db mice, which actually lack only the Ob-Rb (31, 33).
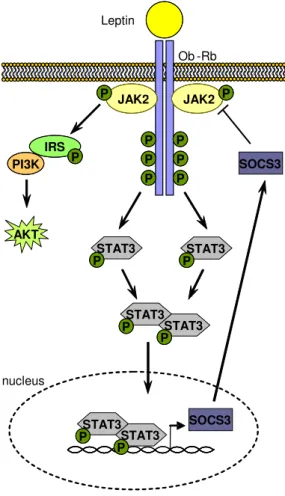
The leptin receptor is a single membrane-spanning receptor, belongs to the class I cytokine receptor family and shows the highest similarity to gp130 (glycoprotein 130) which is the common signal transducer for the interleukin 6 (IL-6) family of cytokines (34). Hormone binding to the Ob-Rb results in dimerization of the receptor and activation of the janus kinase/signal transducer and activator of transcription (JAK/STAT) signaling pathway (35). Activation of the constitutively associated JAK2 leads to autophosphorylation on three different tyrosine residues of the receptor, whereas each phosphorylated tyrosine residue results in the activation of a different downstream signaling pathway (in figure 1 exemplified with STAT3) (36, 37).
Phosphorylated STAT molecules dimerize and translocate to the nucleus to modulate transcription of multiple target genes via STAT-responsive elements (36). Here.
STAT3 activates transcription of suppressor of cytokine signaling (SOCS) 3 (38), which is a negative regulator of proximal leptin signaling and directly binds to JAK2 in a leptin-dependent manner (39). SOCS3 attenuates leptin receptor signaling by inhibiting JAK-induced tyrosine phosphorylation of the receptor.
Binding of leptin to the leptin receptor also mediates tyrosine phosphorylation of IRS and thereby activation of the PI3-kinase signaling pathway (40).
Introduction
Ob -Rb Leptin
nucleus IRS
JAK2 JAK2
P
P P
P P
P P P
STAT3 P
SOCS3 SOCS3 PI3K P
AKT
STAT3 P
STAT3 P STAT3
P
STAT3 P STAT3
P
Figure 1.1: Leptin receptor signaling.
Binding of leptin to Ob-Rb leads to activation of JAK2 and subsequently to JAK2-mediated phosphorylation of three different intracellular tyrosine residues of the receptor, resulting in the activation of different downstream signaling pathways. Phosphorylation and activation of STAT3 molecules lead to a dimerization of STAT3. The dimers translocate to the nucleus and activate target genes including SOCS3, resulting in inhibition of leptin signaling via negative feedback loop.
Additionally, phosphorylated JAK2 directly activates the IRS/PI3K and the Shp2/Erk (not illustrated) signaling pathway. Abbreviations: AKT, protein kinase B; IRS, insulin receptor substrate; JAK, janus kinase; Ob-Rb, long form of the leptin receptor; PI3K, phosphatidyl inositol 3 kinase; SOCS, suppressor of cytokine signaling; STAT, signal transducer and activator of transcript.
Introduction
5.5. Central regulation of energy homeostasis
5.5.1. The hypothalamus
During the last decades, the research on central regulation of energy balance has focused on the hypothalamus. In vertebrates, the hypothalamus is a part of the diencephalon located below the thalamus, building up the floor of the third cerebral ventricle. Conventional histological techniques revealed nuclei as clusters of neurons within the hypothalamus. The mammalian hypothalamus consists of more than 40 histologically distinct nuclei areas, which can often be further divided into subnuclei (41). Classical experiments utilizing lesions or electrical stimulation indicated that some of these nuclei act as discrete feeding and satiety centers (42). Here, the arcuate nucleus (ARC), the paraventricular nucleus (PVN), the ventromedial nucleus of the hypothalamus (VMH), the dorsomedial hypothalamic nucleus (DMH) and the lateral hypothalamus (LH) are the nuclei, which have been shown to be involved in regulation of feeding behavior (figure 1.4). Importantly, the hypothalamus has been shown to be involved in the regulation of many other body functions, e.g. the cardiovascular system, thermoregulatory- and stress responses, the regulation of drinking behavior and the autonomous nervous system (43). In addition, the hypothalamus plays an essential role in assuring the survival of the species by controlling the expression of sexual and maternal behaviors. Of fundamental importance to the function of the hypothalamus is its close connection with the pituitary gland and the now clearly established pathways for neural control of endocrine secretion patterns (44, 45).
Introduction
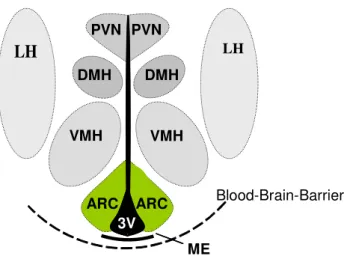
Figure 1.4: Schematic anatomical structure of the hypothalamus.
Diagram of the mediobasal hypothalamus, showing major hypothalamic regions implicated in regulation of food intake and energy expenditure. Abbreviations: 3V, third ventricle; ARC, arcuate nucleus, DMH, dorsomedial hypothalamic nucleus; LH, lateral hypothalamus; ME, median eminence;
VMH, ventromedial nucleus of the hypothalamus; PVN, paraventricular nucleus.
The ARC is located in the mediobasal hypothalamus flanking the base of the third cerebral ventricle right above the median eminence (figure 1.4), which is part of the inferior boundary of the hypothalamus. In the CNS, there are discrete areas localized in the ventricular walls, known as circumventricular organs (CVO) (46), in most of which the blood-brain-barrier (BBB) displays special characteristics. The median eminence is one of the brain windows which allows peptides and proteins secreted by the neural tissue to reach the blood stream, and enables neural cells to sense circulating plasma molecules, including insulin and leptin (47-49). The PVN is located at the dorsal end of the third ventricle and represents the hypothalamic part where numerous neuronal pathways involved in the regulation of energy balance converge, including projections from the ARC (41). Lesions of the PVN as well as the VMH, which is located directly above the ARC, results in severe hyperphagia and obesity (50, 51). The DMH is located dorsal of the VMH and was suggested to integrate information from the ARC, the PVN, and the LH (52). The LH, a very large and
LH
Blood-Brain-Barrier PVN PVN
ARC VMH
DMH
ARC ME DMH
VMH
3V
LH
Introduction
5.5.2. POMC, the melanocortin system and the regulation of energy homeostasis
The melanocortin model is of great importance explaining the neuronal control of energy balance (5, 53). In this model, the ARC is considered a critical region for diverse reasons. Two functionally opposing neuronal populations have been studied in great detail: the orexigenic agouti related peptide / neuropeptide Y (AgRP/NPY)- expressing and the anorexigenic pro-opiomelanocortin (POMC)-expressing neurons (figure 1.5). AgRP and NPY are anabolic neuropeptides that stimulate food intake and reduce energy expenditure (54-57), while the catabolic neuropeptide POMC suppresses food intake and increases energy expenditure (58).
The orexigenic neuropeptide NPY, a 36 amino acid peptide, is one of the most abundant neurotransmitters (59, 60). NPY is widely expressed throughout the brain with highest concentration in the ARC (61). It is the most potent endogenous orexigenic signal, stimulates food intake, reduces energy expenditure (55, 56, 62), and centrally administered, NPY promotes positive energy balance resulting in obesity (56).
The orexigenic neurotransmitter AgRP consists of 132-amino acids. It is co- expressed with NPY in a distinct neuronal population of the ARC and functions as a melanocortin receptor 3/4 (MC3R/MC4R) antagonist. The adrenal gland is the only peripheral tissue with detectable AgRP expression (63). AgRP mRNA levels in the ARC are increased upon fasting (64), and reduction of hypothalamic AgRP mRNA results in increased metabolic rate and reduction of body weight without effecting food intake (65). Transgenic mice with ubiquitous overexpression of AgRP are obese (63). Central injection of AgRP increases food intake and is also capable of blocking intracerebroventricular (icv) α-melanocyte stimulating hormone (MSH) stimulated food intake (54, 66, 67).
Introduction
pancreas
adipose tissue
liver brain
energy balance 3V
NPY/
AgRP POMC
second order neuron
energy expenditure food
intake
plasma glucose adiposity signals
(insulin, leptin) nutrient-related signals hypothalamus
PVN
ARC
- +
MC4R
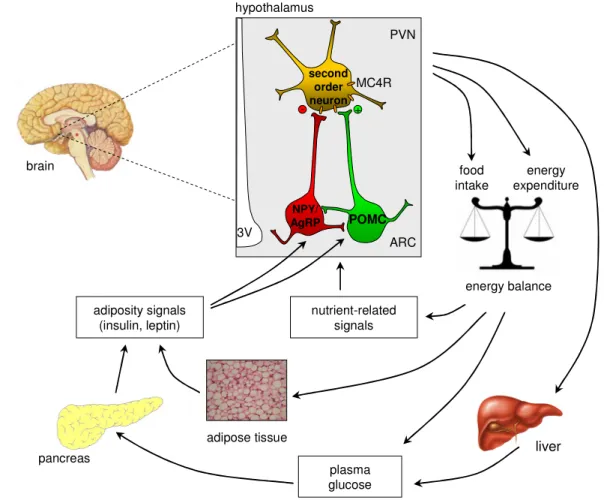
Figure 1.5: Central regulation of energy homeostasis.
The ARC contains both NPY/AgRP and POMC neurons, which are located close to the BBB, where they have preferential access to peripheral humoral signals such as the pancreas-derived hormone insulin and the adipocyte-secreted hormone leptin as well as nutritional signals such as glucose and free fatty acids. Both neuronal populations exert potent effects on energy balance mediated by their characteristic neuropeptides, which allow modulation of second order neurons. POMC neurons project predominantly to second order neurons in the PVN of the hypothalamus, where the POMC cleavage product α-MSH acts on MC4R to suppress food intake. AgRP serves as an inverse agonist for the MC4 receptor, thus counteracting the function of α-MSH. Abbreviations: α-MSH, α-melanocyte- stimulating hormone; AgRP, agouti-related peptide; ARC, arcuate nucleus; MC4R, melanocortin receptor 4; NPY, neuropeptide Y; POMC, pro-opiomelanocortin; PVN, paraventricular nucleus.
[Adapted from Schwartz MW, Porte D (68)]
Introduction
While neonatal ablation of AgRP/NPY neurons has negligible impact on feeding, selective ablation of AgRP/NPY neurons in adult mice results in acute reduction of food intake (69, 70).
The anorexigenic 32 kDa prohormone, POMC, is expressed in the pituitary gland, skin and hypothalamus (71-73). In a tissue-specific manner it is processed by prohormone convertases (PC) to different bioactive products including adreno- corticotropin (ACTH), β-endorphin and α-, β-, and γ-MSH (74, 75). The energy status of the body is reflected by POMC mRNA levels, as POMC gene expression is reduced in negative energy balance and increased in positive energy balance (64, 76, 77). The brain expresses two types of MCR, MC3R and MC4R (78, 79). Both receptor types are highly expressed in regions of the brain established to be important in the control of food intake and body weight (79, 80). MC4R knockout- mice develop a maturity-onset obesity syndrome associated with increased food intake, hyperinsulinemia, hyperglycemia, and an increase in linear growth (81).
Whereas ACTH is the predominant POMC product secreted by corticotroph cells in the pituitary, the principal identified agonist to MCRs expressed in the brain is α-MSH (82). Icv injection of α-MSH reduces food intake and increases energy expenditure (58), and mice lacking the POMC-derived peptides are obese (83).
Both, AgRP/NPY and POMC neurons express insulin and leptin receptors and are targeted by the respective hormones (84, 85), and large body of evidence has revealed an important role for leptin-activated STAT3 signaling in the CNS and POMC/AgRP neurons specifically in control of energy homeostasis. Neuron-specific disruption of STAT3 results in hyperphagia, obesity, diabetes and infertility (86).
Along this line, mice with disruption of STAT3 specifically in leptin receptor- expressing neurons develop profound obesity (87). Lack of leptin receptor signaling or inactivation of STAT3 specifically in POMC neurons results in obesity and other elements of the metabolic syndrome in rodents (88, 89), indicating a role for STAT3 signaling in POMC/AgRP neurons for maintaining normal energy homeostasis Deletion of STAT3 in AgRP/NPY neurons results in modest weight gain accompanied by mild hyperphagia (90). Interestingly, mice with a constitutive activation of STAT3 signaling specifically in AgRP neurons are lean due to increased locomotor activity (185), assigning AgRP neurons and specifically STAT3 signaling a role in control of locomotor activity. Administration of leptin to the ARC stimulates expression of POMC (85, 91), and inhibits expression of AgRP and NPY (92, 93). Moreover,
Introduction
administration of a MC4R antagonist attenuates the anorexigenic response to leptin (94).
A major target site for leptin signaling is the ARC of the hypothalamus. Aside from the DMH and the VMH, the highest levels of Ob-Rb expression are found in the ARC (32). Both AgRP/NPY and POMC neurons within the ARC express the long form of the leptin receptor (95, 96) and are directly regulated by leptin. While the orexigenic AgRP/NPY-producing neurons are inhibited by leptin (97, 98), the anorexigenic POMC neurons are activated (97, 99). Thus, leptin stimulates the production and secretion of anorexigenic neuropeptides and reciprocally suppresses levels of orexigenic peptides. Consistently, ob/ob and db/db mice exhibit elevated levels of AgRP and NPY mRNA and reduced levels of POMC mRNA (76, 100, 101).
Administration of leptin stimulates expression of POMC (85, 91) and inhibits expression of AgRP and NPY (92, 93). Moreover, administration of a MC4R antagonist attenuates the anorexigenic response of leptin (94). It has been shown that leptin increases the frequency of action potentials in POMC neurons by depolarization through a non-specific cation channel and reduced inhibition by local NPY neurons (99).
Both AgRP/NPY and POMC neurons coexpress the insulin- and the leptin receptor (102, 103). Insulin signals to the ARC of the hypothalamus to inhibit orexigenic AgRP/NPY neurons and to stimulate anorexigenic POMC neurons (5, 102, 104, 105).
Central administration of insulin results in increased POMC and decreased NPY expression, without affecting the expression of AgRP (92) Recently, it was shown that insulin signaling in AgRP neurons is required for insulin’s ability to suppress hepatic glucose production (106).
Besides the ability of the CNS to integrate information about the body energy status derived from hormones like insulin and leptin, the hypothalamus can also respond directly to circulating concentrations of nutrients, in particular of glucose and free fatty acids. Central administration of glucose decreases blood glucose levels (107) and central administration of oleic acid inhibits food intake by inhibiting NPY gene expression (108).
Introduction
Hypothalamus CRH
Pituitary
Adrenal Gland ACTH
Kidney Corticosterone Stress
Metabolic effects
5.6. The hypothalamic-pituitary-adrenal axis
The Hypothalamic-Pituitary-Adrenal (HPA) axis is complex system of direct influences and feedback interactions among the PVN of the hypothalamus, the anterior lobe of the pituitary gland and the adrenal glands. It is a major part of the neuroendocrine system that controls reactions to stress, and regulates multiple body processes including the immune system, energy storage and expenditure and sexuality. Corticotrophin-releasing hormone (CRH) synthesized and released by the PVN is the principal regulator of anterior pituitary corticotroph ACTH secretion (109).
Interleukin-2, interferons, and the gp130 cytokine family participate in ACTH regulation and mediate the immuno-neuroendocrine interface. Pituitary corticotroph POMC expression is regulated by ;CRH as well as the gp130 receptor cytokine family (110, 111). Gp130 cytokines activate the HPA axis even in the absence of CRH (112- 114). ACTH stimulates adrenal glucocorticoid release that in turn acts as a negative feedback on CRH and ACTH production.
Figure 1.6: The HPA-axis
During inflammation and stressors that induce systemic cytokine production, CRH production by the PVN of the hypothalamus leads to POMC expression and ACTH release in the pituitary gland. ACTH stimulates adrenal corticosterone production, leading to a negative feedback cycle [red arrows = negative regulation, green arrows = positive regulation]. Abbreviations: CRH; corticotrophin releasing hormone, ACTH; adrenocorticotropin.
Introduction
5.7. Gp130 and cytokine signaling
5.7.1. Cytokines
Pleiotropy and redundancy in biological activities are characteristic features of most cytokines (115, 116). As soluble mediators acting at low concentrations (nano- to pico-molar) they play an important role in the communication between cells. Unlike hormones, cytokines are not stored in glands, but are rapidly synthesized and secreted by different cells predominantly after stimulation. They exert their biological functions through specific cell surface receptors on their target cells. Cytokines have been classified on the basis of molecular cloning and structural analysis (117, 118) Furthermore, molecular and structural analysis of the related receptors accounted for the classification of different cytokine families (119).
5.7.2. The interleukin-6-type cytokine family
Originally, IL-6 was identified as a B cell differentiation factor, inducing B cell maturation to antibody forming plasma cells (120). However, cloning of IL-6 revealed that IL-6 is a typical multifunctional cytokine that affects not only immune response but also the hematopoietic, endocrine, hepatic and even the neural system (116, 121-124). IL-6 is closely related to a group of other cytokines, such as interleukin-11 (IL-11), oncostatin M (OSM), leukaemia inhibitory factor (LIF), cardiotrophin (CT)-1 and ciliary neurotrophic factor (CNTF), all of them exhibit a similar helical structure characterized by four antiparallel α-helices (119).
The so called “IL-6-type cytokines” reveal not only a redundancy in biological activities but furthermore, all members of this family signal via receptors with common structural features, comprising the class I cytokine receptor family (125- 130).
5.7.3. Class I cytokine receptors and gP130
The receptors involved in IL-6-type cytokine signaling are type I membrane proteins (extracellular N-terminus, one transmembrane domain), with the exception of the
Introduction
type-III-like domains of which the N-terminal domain contains a set of four conserved cysteine residues and the C-terminal domain a WSXWS (tryptophan-serine-X- tryptophan-serine) motif (119).
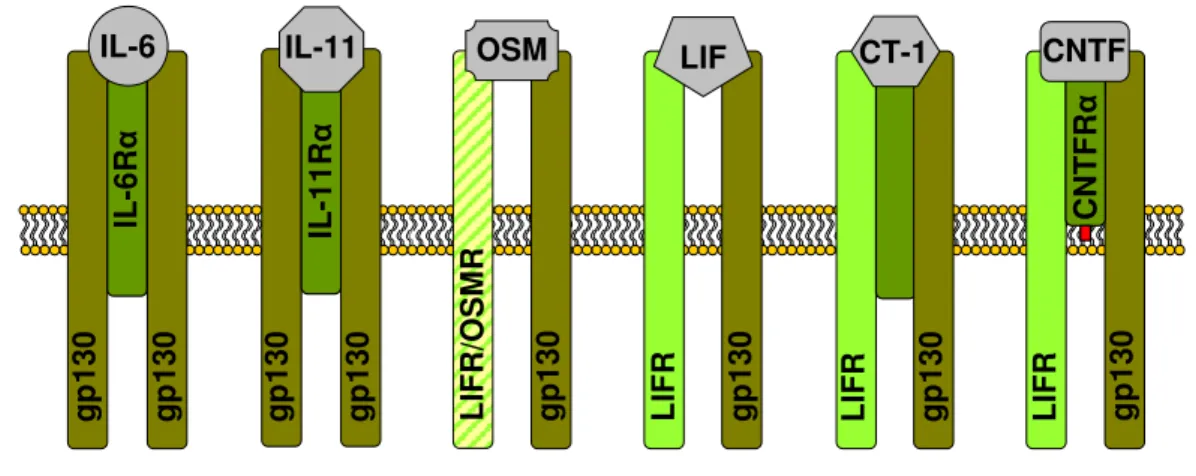
Molecular cloning of the IL-6 receptor (IL-6R) revealed that the IL-6R complex consists of two components. First, an IL-6 binding molecule termed IL-6Rα, a relatively short cytoplasmatic region containing only 82 amino acids, and second the signal transducing 130-kDa membrane gp130 which has no IL-6-binding capacity by itself but plays a critical role in the formation of high-affinity IL-6-binding sites (131, 132). Other receptors for IL-11, OSM, LIF, CT-1 and CNTF were molecularly cloned and revealed a structure similar to the IL-6Rα (figure 1.2) (119, 133).
The functional redundancy of the IL-6 family of cytokines can be explained by the molecular biology of the cytokine receptor system. All class-I-receptor complexes share gp130 as a common signal transducer, but each cytokine requires a private ligand-specific receptor. IL-6, IL-11, and CNTF first bind specifically to their α receptor subunits (IL-6Rα, IL-11Rα, and CNTFRα, respectively) before the signaling receptor subunits are engaged. Also, an α-subunit for CT-1 has been postulated, but since it has not been cloned yet, its existence is uncertain (134). The complexes between IL-6 and IL-6Rα, and between IL-11 and IL-11Rα signal through gp130 homodimers; the complex of CNTF and CNTFRα signals through a heterodimer of gp130 and the LIFR, another signal-transducing receptor subunit. The cytokines LIF and OSM do not require binding to non-signaling α receptors; they engage the signaling receptor subunits directly. LIF uses a heterodimer of gp130 and LIFR to transduce signals. Human OSM has the exceptional capability to recruit two different receptor complexes it forms both, LIFR/gp130 and OSM-specific receptor component (OSMR)/gp130 heterodimers (135) (figure 1.2).
Introduction
gp130 IL-6Rα gp130
IL-6
LIFR gp130
LIF
LIFR gp130CNTFRα
CNTF
LIFR/OSMR gp130
OSM
gp130 IL-11Rα gp130
IL-11
gp130 LIFR gp130
CT-1
Figure 1.2: Class I cytokine receptors.
Schematic models of the receptors for IL-6, IL-11, OSM, LIF, CT-1 and CNTF. IL-6 and IL-11 first bind specifically to their α-receptor subunits, IL-6Rα and IL-11Rα, only the complex of cytokine and α- receptor efficiently recruits gp130 for homodimerization. OSM utilizes two different heterodimers, either LIF/gp130 or OSM/gp130. LIF binds to the LIFR, which then becomes heterodimerized with gp130. The LIFR/gp130 heterodimer is further utilized for CT-1 binding and signaling. Like IL-6 and IL- 11, CNTF first binds to its α-receptor subunit, CNTFRα, which is structural closely related to the extracellular region of IL-6R and is anchored to the membrane via a glycosyl-phosphatidyl-inositol linkage. Abbreviations: CNTF, ciliary neurotrophic factor; CT-1, corticotrophin-1; gp130, glycoprotein 130; IL-6, interleukin-6; IL-11, interleukin-11; LIF, leukaemia inhibitory factor; OSM, oncostatin M; R, receptor.
5.7.4. Cytokine signaling
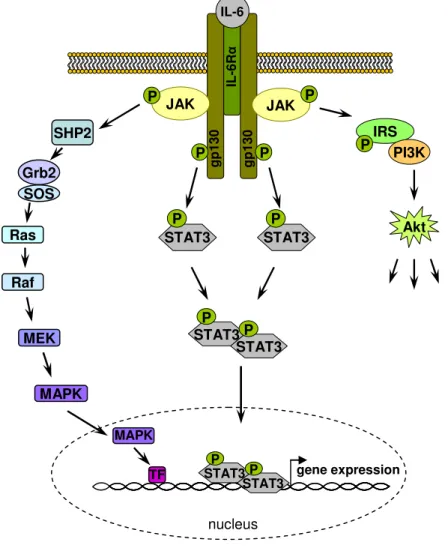
IL-6 type cytokines utilize tyrosine kinases of the JAK family and transcription factors of the STAT family as major mediators of signal transduction. Additionally, the MAPK cascade or a signaling cascade involving PI3K/AKT can be activated by IL-6 type cytokines (135, 136).
The first event in IL-6-type cytokine signaling is the ligand-induced homo-or hetero- dimerization of signal-transducing receptor subunits resulting in activation of the associated JAKs, which phosphorylate themselves and the receptor. These phosphorylation sites serve as docking sites for the SH2 domain containing STATs, such as STAT3, and for SH2-containing proteins and adaptors that link the receptor to MAPK or PI3K/AKT.
Receptor-bound STATs, phosphorylated by JAKs, dimerize and translocate into the
Introduction
nucleus
gp130 IL-6Rα gp130
IL-6
P JAK
JAK P
P P
STAT3 P
STAT3 P
STAT3 P
STAT3 P SHP2
gene expression Grb2
SOS Ras
Raf
MEK
MAPK
MAPK
STAT3 P
STAT3 TF P
IRS PI3K
Akt P
In the event of the MAPK pathway, the activated receptor binds to the Grb2-SOS complex via its docking protein SHP2. The SOS protein then activates Ras, which in turn phosphorylates a series of MAP kinases (Raf, MEK, MAPK). MAPK enters the nucleus and subsequently phosphorylates and activates transcription factors.
Figure 1.3: Cytokine signaling.
The figure illustrates the principles of cytokine signaling exemplified with IL-6. IL-6 binding to IL-6Rα leads to activation of JAK and subsequently to JAK-mediated phosphorylation of intracellular tyrosine residues of the receptor, resulting in the activation of different downstream signaling pathways.
Phosphorylation and activation of STAT 3 molecules lead to a dimerization of STAT3 molecules. The dimers translocate to the nucleus and activate target genes. Additionally, phosphorylated JAK leads to the activation of the MAPK cascade and can also trigger the PI3K signaling pathway. Abbreviations:
AKT, protein kinase B; gp130, glycoprotein 130; Grb2, growth factor receptor-bound protein 2; IL-6, interleukin-6; MAPK, mitogen-activated protein kinase; MEK, MAPK/Erk kinase; PI3K, phosphatidyl inositol 3 kinase; R, receptor; Raf, proto-oncogene serine/threonine protein kinase; Ras, small GTPase; SOS, son of sevenless; SHP2, SH2-containing phosphatase 2; TF, transcription factor.
Introduction
5.8. CNTF
In 1979, CNTF, a 24 kDa protein, was first identified and partially purified as a factor which promoted survival of chick ciliary ganglion neurons (137). Subsequently, it was shown that CNTF is also present in large amounts in sciatic nerves of adult rats and rabbits, which led to its final purification and cloning (138, 139). Further studies revealed that CNTF is expressed in glial cells within the central and peripheral nervous systems. It stimulates gene expression, cell survival or differentiation in a variety of neuronal cell types such as sensory, sympathetic, ciliary and motor neurons. In addition, non-neuronal cells, such as oligodendrocytes, microglial cells, liver cells, and skeletal muscle cells, respond to exogenously administered CNTF, both in vitro and in vivo (140).
CNTF mediates its effects by binding to the CNTF-receptor-α (CNTFRα) (141). As described above, ligand binding leads to heterodimerization of gp130 and the LIFR, activating the JAK/STAT signaling pathway (128). Interestingly, the IL-6R is able to serve as an α-receptor for CNTF (142), both, CNTF and IL-6 possess a specific combination of three binding epitopes, which leads to different ligand-receptor interactions (143). CNTFRα expression is most abundant in the CNS; however, it is expressed in numerous peripheral tissues including skeletal muscle (128, 141).
CNTF was first considered as an antiobesogenic pharmaceutical, when amyotrophic lateral sclerosis (ALS) patients were treated with recombinant human CNTF (rhCNTF), in attempt to slow disease progression. The endpoint of the study, the slope of decline of isometric muscle strength in treated versus placebo patients, showed no statistically significant difference between rHCNTF and placebo-treated patients, remarkably, the side effects of rhCNTF included anorexia and weight loss (144). Since this study, numerous rodent studies have further substantiated the antiobesogenic properties of CNTF and its second-generation analog, Axokine (Axokine) (145-150).
In peripheral tissues such as skeletal muscle, CNTF upregulates AMPK activation, thereby increasing fatty acid oxidation (151). Furthermore, CNTF acts to decrease steatosis in the liver and lipid build up in skeletal muscle (147, 152). The promotion of fatty acid oxidation and lowered lipid accumulation in liver and skeletal muscle
Introduction
5.8.1. CNTF and the CNS
In situ hybridization with cRNA probes for murine Ob-Rb and CNTFRα, revealed that both receptors are co-localized in the arcuate nucleus and the paraventricular nuclei, hypothalamic regions involved in the regulation of energy balance (148, 153). CNTF treatment of ob/ob mice was found to reduce adiposity, hyperphagia, and hyperinsulinemia associated with leptin deficiency. Unlike leptin, CNTF also reduced obesity-related phenotypes in db/db mice, and in mice with diet-induced obesity, which are partially resistant to the actions of leptin (148). Furthermore, recombinant CNTF was able to reverse the obese phenotype in leptin resistant rodent models and to prevent rebound weight gain after the end of treatment (150). Pharmacological experiments indicated that CNTF, similar to leptin is capable of suppressing NPY mRNA levels, and NPY application counteracts the weight reducing effects of CNTF (154). However, CNTF and leptin initiate differential patterns of gene expression in the ARC and CNTF possesses inflammatory properties distinct from leptin (155, 156), indicating diverging mechanisms of action and potentially differential target sites of both hormones.
5.8.2. Axokine
Axokine (CNTFAx15), a second-generation neurotrophic factor that is related to CNTF, was developed by Regeneron Pharmaceuticals for the potential treatment of obesity and associated complications such as diabetes mellitus type 2. Axokine is the designation for recombinant human CNTF with the following modifications:
substitutions of alanine for cystein at position 17 and arginine for glutamine at position 63, and deletion of the 15 C-terminal amino acids. Axokine is four to five times more potent than the CNTF parent molecule as measured by in vitro neuronal survival assays and in vivo studies and has improved stability properties over CNTF (157-160).
Introduction
5.9. Objectives
Obesity and type 2 diabetes mellitus are intimately connected diseases and their incidences are steadily increasing worldwide. Therefore, there is an urgent need for the development of therapeutically approaches to treat the obesity epidemic. CNTF exerts anorectic effects by overcoming leptin resistance via activation of hypothalamic neurons. However, the exact site of CNTF action in the hypothalamus has not been identified yet. Using Cre-loxP-mediated recombination in vivo, the common gp130 signal-transducing subunit, which is required for functional CNTF signaling, was ablated selectively in POMC-expressing neurons (gp130∆POMC mice
)
. Characterization of gp130∆POMC mice elucidated the physiological role of gp130 signaling in POMC neurons, particularly on the regulation of energy homeostasis and neuropeptide expression. Additionally, the effect of exogenous CNTF on food intake and body weight was analyzed by central CNTF administration..
Material and Methods
6. Material and Methods
6.1. Chemicals
Table 1: Chemicals
Chemicals Supplier
Acrylamide (Rotiphorese Gel 30®) Roth, Karlsruhe, Germany
Actrapid (Insulin) Novo Nordisk, Bagsværd, Denmark
Agarose Invitrogen, Karlsruhe, Germany
Aprotinin Sigma-Aldrich, Seelze, Germany
APS Sigma-Aldrich, Seelze, Germany
Avertin (2,2,2-tribromoethanol) Sigma-Aldrich, Seelze, Germany
Benzamidin Sigma-Aldrich, Seelze, Germany
Bromphenol Blue Merck, Darmstadt, Germany
CNTF R&D Systems,
DEPC Applichem, Darmstadt, Germany
Dimethylsulfoxide (DMSO) Merck, Darmstadt, Germany
Dithiothreitol DTT Applichem, Darmstadt, Germany
Enhanced Chemiluminscence (ECL) Kit Perbio Science, Bonn, Germany
Ethanol Applichem, Darmstadt, Germany
Ethidium Bromide Sigma-Aldrich, Seelze, Germany
Ethylendiamine tetraacetate (EDTA) Applichem, Darmstadt, Germany Forene® (Isoflurane) Abbott, Wiesbaden, Germany
Glucose, 20% DeltaSelect, Pfullingen, Germany
Glycerine Merck, Darmstadt, Germany
Glycin Applichem, Darmstadt, Germany
Hepes Applichem, Darmstadt, Germany
Isopropanol Roth, Karlsruhe, Germany
Leptin Sigma-Aldrich, Seelze, Germany
LPS Sigma-Aldrich, Seelze, Germany
Methanol Roth, Karlsruhe, Germany
NaF Applichem, Darmstadt, Germany
Paraformaldehyde (PFA) Applichem, Darmstadt, Germany Phenylmethylsulfonylfluoride (PMSF) Sigma-Aldrich, Seelze, Germany Phosphate buffered NaCl (PBS) Gibco BRL, Eggenstein, Germany
Material and Methods
Proteinase K Roche, Mannheim, Germany
Sodium Azide Merck, Darmstadt, Germany
Sodium Chloride, 0,9% DeltaSelect, Pfullingen, Germany Sodium Dodecyl Sulfate (SDS) Applichem, Darmstadt, Germany
Sodium fluoride Merck, Darmstadt, Germany
Sodium orthovanadate Sigma-Aldrich, Seelze, Germany Sucrose
Trishydroxymethylaminomethane (Tris) Applichem, Darmstadt, Germany
Triton X-100 Applichem, Darmstadt, Germany
Tween 20 Applichem, Darmstadt, Germany
Western Blocking Reagent Roche, Karlsruhe, Germany β-Mercaptoethanol (β-ME) Applichem, Darmstadt, Germany
Material and Methods
6.2. Animals
All animal procedures were conducted in compliance with protocols approved by local government authorities (Bezirksregierung Köln) and were in accordance with National Institutes of Health guidelines. Mice were housed in groups of 3-5 at 22- 24°C in a 12 : 12 h light/dark cycle with lights on at 6 a.m. Animals were either fed regular chow food (Teklad Global Rodent # T.2018.R12; Harlan, Germany) containing 53.5% of carbohydrates, 18.5% of protein, and 5.5% of fat (12% of calories from fat) or a high fat containing diet (HFD) (# C1057; Altromin, Germany) containing 32.7%, 20% and 35.5% of carbohydrates, protein and fat (59.36% of calories from fat), respectively. Water was available ad libitum and food was only withdrawn if required for an experiment. Body weight was measured once a week.
Genomic DNA was isolated from tail tips, genotyping was performed by PCR. At the end of the study period, the animals were killed in isoflurane anaesthesia.
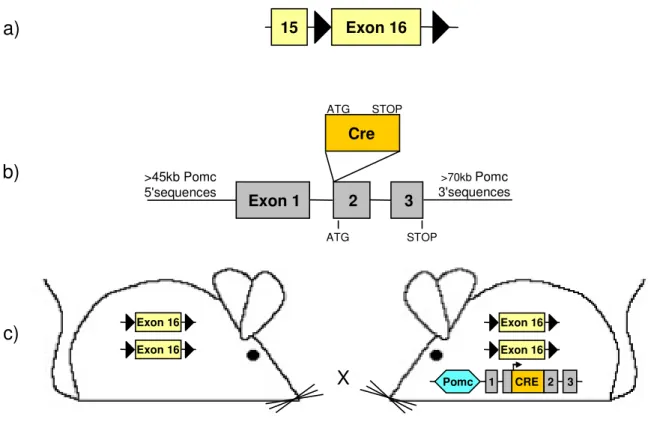
6.2.1. Generation of PomcCre-gp130lox/lox mice
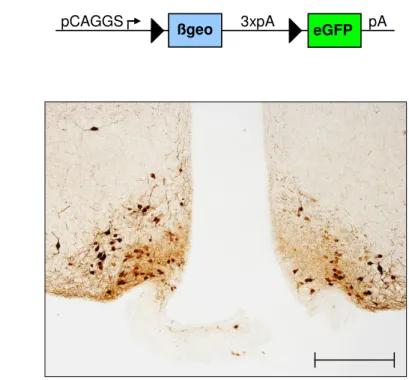
PomcCre mice (88) were mated with gp130lox/lox mice (161), and a breeding colony was maintained by mating gp130lox/lox with PomcCre-gp130lox/lox mice. Gp130lox mice had been backcrossed for at least 5 generations on a C57BL/6 background, and PomcCre mice (initially established on a FVB background) had been backcrossed for two generations on a C57BL/6 before intercrossing them with gp130lox mice. Only animals from the same mixed background strain generation were compared to each other. PomcCre mice were genotyped by PCR as previously described (88), gp130lox mice were genotyped by PCR with primers flanking the first loxP site (5gp130, 3gp130). Germline deletion was excluded using a third primer, binding ~300 bp downstream the second loxP site. For visualization of Cre-mediated recombination, mice were crossed with either the indicator strain RosaArte1 (LacZ reporter) (162) or the Z/EG reporter strain (163).
6.2.2. Restraint stress and LPS treatment
Mice were adapted to gentle handling for approximately 8 weeks prior to the experiment. To determine basal serum corticosterone and IL-6 levels, blood was drawn from the tail vein during the first 3 hours (h) of the light phase. The following
Material and Methods
day, mice were subjected to 1h of restraint stress at the same time of the light phase.
Restraint stress was achieved by enclosing the animals in a plastic tube with a diameter of 3 cm and openings at both ends for tail and nose. The length of the tube was adjusted to the size of the animal to ensure complete immobilization. At the end of the experiment, blood samples were again drawn from the tail vein.
Seven days later the animals were injected intraperitoneal (ip.) with 0.9%NaCl during the first 3 h of the light phase, blood was collected from the tail vein 1 h after injection. After five days of recovery, each mouse received an ip. injection of 300µg LPS (L 2630 Sigma, Germany), 1 h after injection blood samples were taken. Two days after LPS injection the animals were sacrificed in isoflurane anaesthesia.
6.2.3. Glucose and insulin tolerance tests
Glucose tolerance tests were performed with 16h fasted animals. After determination of fasted blood glucose levels, each animal received an ip. injection of 20%Glucose (10ml/kg). Blood Glucose levels were detected after 15, 30, 60 and 120 minutes (min).
Insulin tolerance tests were performed with mice fed ad libitum. After determination of basal blood glucose levels, each animal obtained an ip. injection of insulin, 0,75U/kg (Actrapid®). Additional blood glucose values were collected 15, 30 and 60 min after insulin injection.
6.2.4. Indirect calorimetry and food intake
All measurements were performed with a Comprehensive Laboratory Animal Monitoring System (CLAMS, Oxymax Windows 3.0.3; Columbus Instruments, OH, USA). Mice were placed at room temperature (22°-24°C) in 3.0-liter chambers of the CLAMS open circuit calorimetry. Settling time was set at 150 seconds (sec) and measuring time at 60 sec with room air as reference. Food and water were ad libitum provided in the appropriate devices. Mice were allowed to acclimatize in the chambers for 24 h. Parameters of indirect calorimetry were measured for at least the following 72 h. Food intake was measured continuously in the CLAMS during the
Material and Methods
6.2.5. Icv cannula implantation
12 week old mice were anesthetized by ip. injection of Avertin® (240mg/kg) and placed in a stereotactic device. A sterile osmotic pump connector cannula (Bilany Consultants GmbH, Germany) was implanted into the lateral brain ventricle (0.2 mm posterior and 1.0 mm lateral relative to bregma and 2.3 mm below the surface of the skull). The support plate of the catheter was attached to the skull with superglue. The catheter was prefilled with sodium chloride (NaCl) and connected to a sealed micro- renathane catheter (MRE-025; Braintree Scientific, Inc., MA, USA).
6.2.6. Icv injections
After 5 days of recovery, the sealed micro-renathane catheter was removed. Over 1 min, 5µl NaCl was injected, to avoid a backflow, the catheter was sealed with hot clamps. The following day, 4µl recombinant Rat CNTF, 0.25 mg/ml (557-NT/CF, R&D Systems) were injected followed by 1µl of NaCl to assure complete drug absorption to the lateral ventricle. Injections were performed in isoflurane anaesthesia 1h before the onset of the dark cycle.
Food intake and body weight were measured 4h and 24 h (female mice) and 6h/24h (male mice) after the injection. Correct position of the icv cannula was verified in each animal by injection of methyl blue after sacrificing the mice. Only data from animals successfully injected with NaCl and CNTF was analyzed
6.2.7. Axokine treatment
Axokine was purchased from Regeneron Pharmaceuticals, Terrytown, NY. Placebo was freshly prepared every 3-4 days containing 10mM sodium phosphate, 0, 05%
Tween®80, 3% PEG 3350, and 20% sucrose in ddH2O.
After weaning, mice were fed with high fat containing diet. At the age of 10 weeks, only mice with sufficient weight gain were accustomed to daily subcutaneous (sc.) injection 1 hour before onset of the dark period with placebo for 5 days. The body weight of all groups at the beginning of the experiment averaged out between 33 and 34 g. Subsequent treatment with either Placebo or Axokine (0.1µg/kg/day) for 7 days was followed by 16 days of continuous monitoring.
Material and Methods
6.2.8. Molecular biology
Standard methods of molecular biology were performed according to Sambrook and Russell, unless stated otherwise.
6.2.9. Isolation of genomic DNA
Mouse tail biopsies were incubated 1 hour (h) in lysis buffer (100 mM Tris-HCl (pH 8.5), 5 mM EDTA, 0.2% (w/v) SDS, 0.2 M NaCl and 500 mg/ml proteinase K) in a thermomixer (Eppendorf, Hamburg, Germany) at 56°C. DNA was then precipitated from the solution by adding an equivalent of isopropanol. After centrifugation, the DNA pellet was dried at 60°C for 10 min and resuspended in doubly distilled water (ddH2O).
6.2.10. Polymerase chain reaction (PCR)
The PCR method was used to genotype mice for the presence of floxed alleles or transgenes with customized primers listed in table 3. Reactions were performed in a Thermocycler iCycler PCR machine (Bio-Rad, München, Germany) or in a Peltier Thermal Cycler PTC-200 (MJ Research, Waltham, USA). All amplifications were performed in a total reaction volume of 25µl, containing a minimum of 50ng template DNA, 25pmol of each primer, 25µM dNTP Mix, 10 x RedTaq reaction buffer and 1 unit of RedTaq DNA Polymerase. PomcCre PCR program started with 5 min denaturation at 95°C, followed by 35 cycles consisting of denaturation at 94°C for 60 sec, annealing at 55°C for 30 sec and elongation at 72°C for 90 sec and a final elongation step at 72°C for 7 min. gp130-deletion/gp130-flox PCR program started with 4 min denaturation at 94°C, followed by 35 cycles consisting of denaturation at 94°C for 30 sec, annealing 54°C for 30 sec and elongation at 72°C for 45 sec and a final elongation step at 72°C for 7 min.
Material and Methods
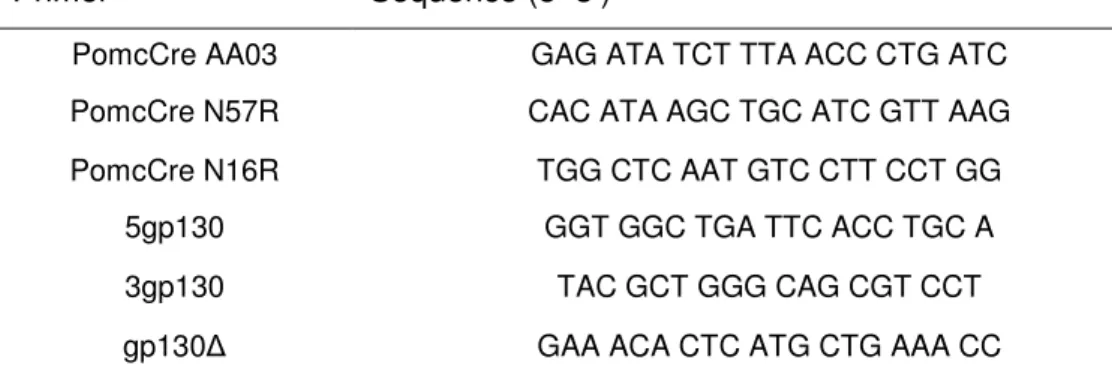
Table 2: Oligonucleotides for genotyping
Primer Sequence (5’-3’)
PomcCre AA03 GAG ATA TCT TTA ACC CTG ATC
PomcCre N57R CAC ATA AGC TGC ATC GTT AAG
PomcCre N16R TGG CTC AAT GTC CTT CCT GG
5gp130 GGT GGC TGA TTC ACC TGC A
3gp130 TAC GCT GGG CAG CGT CCT
gp130∆ GAA ACA CTC ATG CTG AAA CC
All primers were purchased from Eurogentec, Cologne, Germany. PCR-amplified DNA fragments were applied to 1% - 3% (w/v) agarose gels (1 x TAE, 0.5mg/ml ethidium bromide) and electrophoresed at 120V.
6.2.11. Hypothalamic neuropeptide expression
Neuropeptide mRNA was analyzed using quantitative real-time (RT)-PCR. RNA was isolated from hypothalamic blocks respectively pituitaries using the Qiagen RNeasy Kit (Qiagen, Germany). The RNA was reversely transcribed with EuroScript Reverse Transcriptase (Eurogentec, Belgium) and amplified using TaqManR Universal PCR- Master Mix, NO AmpErase UNG with TaqManR Assay on demand kits (Applied Biosystems, CA, USA) with the exception of the detection of POMC mRNA.
Customized primers were used with POMC sense 5’-
GACACGTGGAAGATGCCGAG-3’; anti-sense, 5’-CAGCGAGAGGTCGAGTTTGC- 3’; probe sequence, 5’-FAM-CAACCTGCTGGCTTGCATCCGG-TAMRA-3’. Relative expression of neuropeptide mRNA was determined using standard curves based on hypothalamic copy (c) DNA and samples were adjusted for total RNA content by TATA-box binding protein (TBP) RNA quantitative PCR. Calculations were performed by a comparative method (2-ddCT). Quantitative PCR was performed on an ABI- PRISM 7700 Sequence Detector (Applied Biosystems, Germany). Assays were linear over 4 orders of magnitude.
Material and Methods
6.3. Analytical procedures
6.3.1. ELISA and RIA
Blood glucose levels were determined from whole venous blood using an automatic glucose monitor (GlucoMen® GlycÓ; A. Menarini Diagnostics, Italy). Insulin, leptin and Il-6 levels in serum were measured by ELISA using mouse standards according to manufacturer’s guidelines (Mouse Leptin ELISA, Mouse/Rat Insulin ELISA;
CrystalChem, IL, USA / BD OptEIATMMouse Il-6 ELISA Kit; BD Biosciences, Pharmingen CA). Corticosterone serum levels were determined by RIA using mouse standards according to manufacturer’s guidelines (ImmuChemTMDouble Antibody Corticosterone 125I RIA Kit; INC Biomedicals, Inc., CA, USA).
6.3.2. Protein extraction
Snap-frozen tissues were thawed and homogenized in lysis buffer (50mM HEPES (pH 7.4), 1% Triton X-100, 0.1M Sodiumfluoride, 10mM EDTA, 50mM Sodiumchloride, 10mM Sodiumorthovanadate, 0,1% SDS, 10µg/ml Aprotinin, 2mM Benzamidine, 2mM PMSF) using a polytron homogenizer (IKA Werke, Staufen, Germany). Particulate matter was removed by centrifugation for 1h at 4°C. The supernatant was transferred to a fresh vial and protein concentrations were determined using a Bradford assay. Protein extracts were diluted to 1mg/ml with lysis buffer and 4 x SDS sample buffer (125mM Tris-HCl (pH 6.8), 5% SDS, 43.5%
glycerine, 100mM DTT, and 0.02% bromophenol blue), incubated at 95°C over 5min and stored at -80°C.
6.3.3. Western blot analysis
Frozen protein extracts were thawed at 95°C for 5min, then separated on 8-10%
(v/v) SDS polyacrylamide gels and blotted onto PVDF membranes (Bio-Rad, München, Germany). Membranes were then incubated with 1% blocking reagent (Roche, Mannheim, Germany) for 1h at RT or over night at 4°C. Subsequently,