Activation of Stat3 Signaling in AgRP Neurons Promotes Locomotor Activity
Inaugural-Dissertation zur
Erlangung des Doktorgrades
der Mathematisch-Naturwissenschaftlichen Fakultät der Universität zu Köln
vorgelegt von Andrea Mesaros aus Bergisch Gladbach
Köln 2007
Berichterstatter: Prof. Dr. Jens Brüning
Prof. Dr. Thomas Langer
Tag der mündlichen Prüfung: 17.04.2008
Index of Contents Figure Index...IV Table Index ...VI Abbrevations...VII
1 Introduction... 1
1.1 Obesity ... 1
1.2 Energy homeostasis ... 2
1.3 Leptin ... 3
1.3.1 Mechanisms of leptin receptor signaling... 5
1.4 Insulin ... 8
1.4.1 Mechanisms of insulin receptor signaling ... 9
1.5 Central regulation of energy homeostasis... 9
1.5.1 The hypothalamus... 9
1.5.2 The arcuate nucleus of the hypothalamus... 11
1.5.2.1 Regulation of neurons located in the arcuate nucleus... 13
1.5.3 Central regulation of energy homeostasis by leptin in vivo ... 16
1.6 Objectives ... 18
2 Materials and Methods... 19
2.1 Chemicals and biological material... 19
2.2 Molecular biology... 21
2.2.1 Competent cells and isolation of plasmid DNA ... 21
2.2.2 Isolation of genomic DNA from mouse tissue ... 21
2.2.3 Agarose gel electrophoresis and DNA gel extraction... 22
2.2.4 Construction of a vector for in situ hybridization probe synthesis ... 22
2.2.5 Quantification of DNA and RNA ... 23
2.2.6 Polymerase chain reaction (PCR) ... 23
2.2.7 RT-PCR ... 24
2.2.8 Analysis of RNA expression ... 25
2.3 Biochemistry... 26
2.3.1 Electromobility-Shift Assay (EMSA)... 26
2.3.2 Enzyme-linked Immunosorbent Assay (ELISA)... 26
2.3.3 Staining of hypothalamic sections ... 27
2.3.3.1 Immunohistochemistry ... 27
2.3.3.2 Combined in situ hybridization and immunohistochemistry... 28
2.3.4 Histomorphology ... 30
Index of Contents
2.4 Mouse experiments ... 31
2.4.1 Animal care... 31
2.4.2 Mice ... 31
2.4.3 Intracerebroventricular BrdU injection... 32
2.4.4 Body composition... 33
2.4.5 Collection of blood samples and determination of blood glucose levels ... 33
2.4.6 Food intake, indirect calorimetry and physical activity... 33
2.4.7 Insulin tolerance test ... 34
2.4.8 Glucose tolerance test ... 34
2.5 Statistical methods ... 34
3 Results... 35
3.1 Generation of AgRP neuron specific Stat3-C mice ... 35
3.2 Leanness in Stat3-C
AgRPmice ... 41
3.3 Improved glucose metabolism in Stat3-C
AgRPmice ... 47
3.4 Stat3 activation in AgRP neurons does not alter food intake but results in increased energy expenditure... 50
3.5 Unaltered AgRP expression in Stat3-C
AgRPmice ... 54
3.6 Stat3-C
AgRPmice exhibit increased locomotor activity ... 57
3.7. Expression of the Stat3-C transgene selectively in AgRP neurons of ob/ob mice ameliorates the obese phenotype ... 64
4 Discussion... 71
4.1 Leptin in obesity ... 71
4.2 Central leptin signaling... 71
4.3 Activation of a constitutively active Stat3 protein in AgRP neurons ... 72
4.3.1 Role of Stat3 in the regulation of AgRP expression... 73
4.3.2 Role of Stat3 in AgRP neurons in the regulation of energy homeostasis... 74
4.3.3 Role of Stat3 in AgRP neurons in the regulation of glucose metabolism ... 75
4.3.4 Role of Stat3 in AgRP neurons in the regulation of locomotor activity... 76
4.4 Perspectives ... 78
5 Summary... 79
6 Zusammenfassung ... 80
7 References... 81
8 Acknowledgements... 101
Index of Contents
10 Curriculum Vitae ... 103
Figure Index
Figure Index
Figure 1: Prevalence of obesity in the USA ... 2
Figure 2: Leptin receptor signaling... 7
Figure 3: Basic anatomy of the hypothalamus... 10
Figure 4: Regulation of energy homeostasis... 15
Figure 5: AgRP neuron-restricted expression of a constitutively active Stat3 transgene ... 35
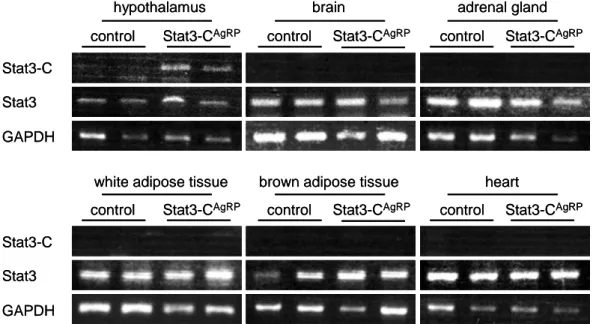
Figure 6: Expression of Stat3-C is restricted to the hypothalamus of Stat3-C
AgRPmice 36 Figure 7: High Stat3 DNA-binding activity in Stat3-C
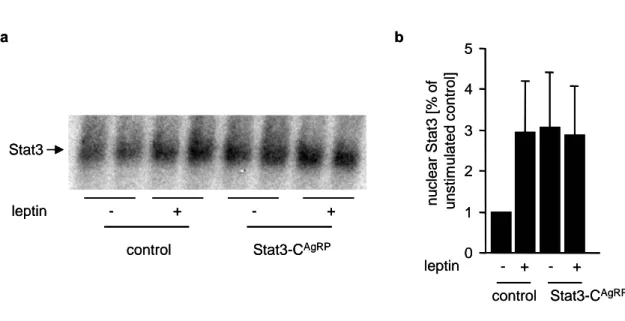
AgRPmice... 37
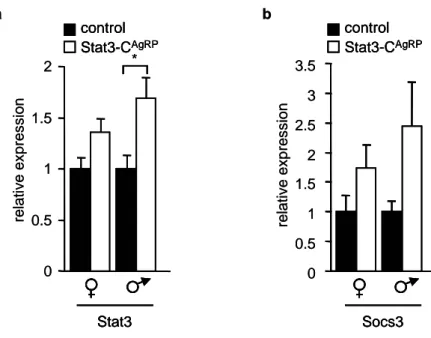
Figure 8: Enhanced expression of hypothalamic Stat3 and Socs3 in Stat3-C
AgRPmice. 38 Figure 9: Verification of Cre-mediated recombination in AgRPCre mice... 39
Figure 10: Increased nuclear Stat3 expression in AgRP/NPY neurons of Stat3-C
AgRPmice... 40
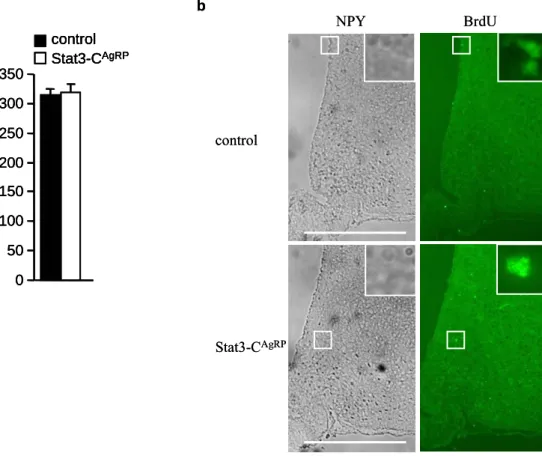
Figure 11: AgRP/NPY neurons of Stat3-C
AgRPmice display normal morphology ... 41
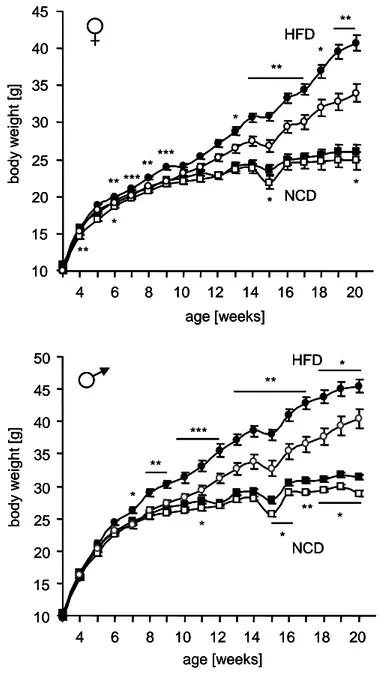
Figure 12: Reduced body weight of Stat3-C
AgRPmice ... 42
Figure 13: Reduced adiposity of Stat3-C
AgRPmice ... 44
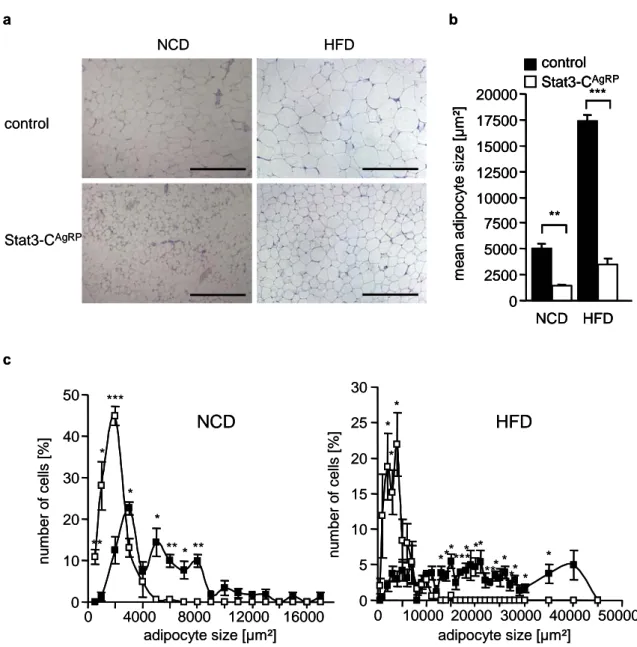
Figure 14: Reduction of adipocyte size in Stat3-C
AgRPmice... 46
Figure 15: Stat3-C
AgRPmice develop reduced adiposity after the postweaning age ... 47
Figure 16: Improved fasted blood glucose in HFD-fed Stat3-C
AgRPmice ... 48
Figure 17: Unaltered insulin sensitivity and improved glucose tolerance in Stat3-C
AgRPmice... 49
Figure 18: Slightly decreased serum insulin concentrations in HFD-fed Stat3-C
AgRPmice... 50
Figure 19: Relative hyperphagia of Stat3-C
AgRPmice... 51
Figure 20: Increased basal metabolic rate in Stat3-C
AgRPmice ... 53
Figure 21: Unaltered respiratory exchange ratio of Stat3-C
AgRPmice ... 54
Figure 22: Unaltered hypothalamic neuropeptide expression of Stat3-C
AgRPmice ... 55
Figure 23: Unaltered UCP expression and thyroid function of Stat3-C
AgRPmice... 56
Figure 24: Increased basal locomotor activity of Stat3-C
AgRPmice ... 58
Figure 25: Increased fasting-induced locomotor activity of Stat3-C
AgRPmice ... 59
Figure 26: Unaltered metabolic rate and activity of Stat3-C
POMCmice... 60
Figure 27: Plasma catecholamine concentrations of Stat3-C
AgRPmice ... 61
Figure Index
Figure 28: Brain monoamine content of Stat3-C
AgRPmice ... 63
Figure 29: Unaltered hypothalamic expression of hypocretin and MCH of Stat3-C
AgRPmice... 64
Figure 30: Reduced body weight of ob/obStat3-C
AgRPmice ... 65
Figure 31: Unaltered adiposity of ob/obStat3-C
AgRPmice ... 66
Figure 32: Slightly improved glucose metabolism of ob/obStat3-C
AgRPmice ... 67
Figure 33: Relative hyperphagia of ob/obStat3-C
AgRPmice... 68
Figure 34: Slightly increased metabolic rate of ob/obStat3-C
AgRPmice ... 69
Figure 35: Slightly increased locomotor activity of Stat3-C
AgRPmice... 70
Table Index
Table Index
Table 1: Chemicals ... 19
Table 2: Enzymes... 21
Table 3: Primers used for amplification of NPY cDNA... 22
Table 4: Primers used for amplification of cDNA fragments... 24
Table 5: Primers used for analysis of POMC mRNA expression... 25
Table 6: Primers used to amplify an T7-promoter-NPY fragment for in vitro transcription ... 28
Table 7: Antibodies used for the staining of hypothalamic sections ... 30
Table 8: Primers used for genotyping of mice... 32
Abbrevations
Abbrevations
A alanine
ACTH adrenocorticotrophin
AgRP agouti-related peptide
Ala alanine
am ante meridiem
ARC arcuate nucleus
Asn asparagine
BAT brown adipose tissue
BMI body mass index
BrdU 5-bromodeoxyuridine
°C temperature in degree celsius
CaCl
2calcium chloride
cDNA complementary DNA
CPu caudate putamen (striatum)
Cre site specific recombinase from phage P1 (causes recombination)
CRH corticotropin-releasing hormone
d deci
Da Dalton
DAPI 4',6-diamidino-2-phenylindole
DIG digoxigenin
DMH dorsomedial hypothalamic nucleus
DMSO dimethylsulfoxide
DNA deoxyribonucleic acid
DNase deoxyribonuclease
dNTP deoxyribonucleotide-triphosphate E. coli Escherichia coli
EDTA ethylendiamine tetraacetate
ELISA enzyme-linked immunosorbent assay EMSA electromobility-shift assay
Erk extracellular signal-regulated kinase
Abbrevations
EtOH ethanol
FCS fetal calf serum
floxed loxP flanked
Flp site-specific recombinase, product of yeast FLP1 gene FrA frontal association cortex
FRT Flp recombination target
fT3 free triiodothyronine
g gram
GAPDH glyceraldehyde 3-phosphate dehydrogenase GFP green fluorescent protein
h hour
HCl hydrochloric acid
HCRT hypocretin
HE hematoxylin/eosin
HEPES 4-(2-hydroxyethyl)-1-piperazineethanesulfonic acid
HFD high fat diet
H
2O
2hydrogen peroxide
HPRT hypoxanthine guanine phosphoribosyl transferase
Ht hypothalamus
ICV intracerebroventricular
IRES internal ribosome entry site IRS insulin receptor substate
Jak Janus kinase
k kilo
KCl potassium chloride
l liter
LacZ gene encoding the enzyme β-galactosidase
LB Luria-Bertani
LHA lateral hypothalamic area
loxP recognition sequence for Cre (locus of x-ing over phage P1)
m meter
m milli
Abbrevations MCH melanin-concentrating hormone
MCR melanocortin receptor
ME median eminence
MgCl
2magnesium chloride
min minute
MOPS 3-(N-morpholino)propanesulfonic acid
mRNA messenger RNA
MSH melanocyte-stimulating hormone n nano
N asparagine
N Normal
NaCl sodium chloride
NaH
2PO
4monosodium phosphate Na
2HPO
4disodium hydrogen phosphate
NCD normal chow diet
Neo
Rneomycine resistance gene
NIH National Institutes of Health
NP-40 Nondiet P-40
NPY neuropeptide Y
ObRb long isoform of the leptin receptor
OD optical density
p pico
PAGE polyacrylamid gel electrophoresis PBS phosphate buffered saline
PCR polymerase chain reaction α-
32P-CTP
32P-labeled cytidine triphosphate
PFA paraformaldehyde
pGK-hyg hygromycin resistance gene driven by the phosphoglycerate kinase promoter
PI3K phosphatidylinositol-3 kinase
pm post meridiem
POMC proopiomelanocortin
PVN paraventricular nucleus
RNA ribonucleic acid
Abbrevations
RNase ribonuclease
SA splice acceptor
SDS sodiumdodecylsulfate
sec second
SEM standard error of the mean
SH Src homology
Shp2 tyrosine phosphatase 2
Socs suppressor of cytokine signaling SSC sodium chloride/sodium acetate buffer Stat signal transducer and activator of transcription Stat3-C constitutively active form of Stat3
TAE Tris-acetate-EDTA
TBS Tris buffered saline
TE Tris-EDTA
Thr threonine
TRH thyrotropin-releasing hormone
Tris trishydroxymethylaminomethan
tRNA transfer RNA
Tyr tyrosine
U unit
UCP uncoupling protein
UV ultraviolet
VMH ventromedial nucleus of the hypothalamus
VO
2volume of consumed oxygen
VTA ventral tegmental area
v/v volume per volume
WAT white adipose tissue
WHO World Health Organisation
w/v weight per volume
µ micro
3’ three prime end of DNA sequences
5’ five prime end of DNA sequences
Introduction
1 Introduction
1.1 Obesity
Obesity is a steadily growing health problem in industrialized societies (Figure 1) representing a major risk factor for numerous diseases, including diabetes mellitus type 2, cardiovascular diseases, sleep apnea, hypertension, stroke and certain forms of cancers (Bray, 2004; Haslam and James, 2005; Hill and Peters, 1998). According to the World Health Organization (WHO), the worldwide number of obese adults doubled in the last ten years to more than 400 million. In addition to the high number of obese people, currently more than one billion adults are overweight. Furthermore, the prevalence of obesity and overweight is predicted to rise dramatically within the next years. Projections of the WHO predict more than 700 million obese adults by 2015.
However, obesity is not exclusively a problem concerning adults, as also childhood obesity rises rapidly with more than 20 million overweight children under five years of age worldwide (WHO).
The presence of overweight and obesity is commonly assessed by the body mass index (BMI), which is defined by the ratio of body weight to height (body weight/height
2) (Mei et al., 2002). While overweight is defined by a BMI of 25 to 29.9 kg/m
2, obesity is defined by a BMI of 30 kg/m
2or greater (WHO). Approximately 20 % of all german adults and even 30 % of all adults in the USA exhibit a BMI of greater than 30 kg/m² (Telefonischer Gesundheitssurvey 2003 (GSTel03), Centers for Disease Control and Prevention) (Seidell, 1997). The likelihood of developing diseases like diabetes mellitus type 2 rises with increasing BMI. Consequently, not only the incidence of obesity but also the incidence of obesity associated diseases rises rapidly.
Thus, the number of people suffering from diabetes mellitus type 2 is predicted to double by 2030 to at least 360 million (WHO). Even mortality is increased in obesity, with a BMI of over 32 associated with a doubled risk of death (Manson et al., 1995).
However, there is evidence that the risk of chronic diseases already increases
progressively from a BMI of 21 (WHO). As a consequence of the high prevalence of
obesity, at least 6 % of total health care costs are associated with overweight and
obesity in several industrialized countries. However, these calculations do not include
all obesity-related issues (WHO).
Introduction Various genetic conditions that feature obesity, such as Prader-Willi syndrome and leptin and melanocortin receptor mutations have been identified. However, the known single gene mutations have been found in only 5 % of all obese individuals.
Therefore, these mutations described in patients with severe obesity cannot explain the epidemic increase of overweight and obesity, but make it possible to relate clinical to experimental findings (Barsh et al., 2000). The huge increase in the prevalence of obesity is rather based on behavioural and environmental changes resulting from technological advances, which are in part amplified by genetic predisposition. Most likely, the combination of an excessive and energy-dense nutrient intake combined with reduced physical activity causes the rapid acceleration of obesity in industrialized societies in the last decades (Hill and Peters, 1998).
20 to 39 40 to 59 60 to 74
1960 to 1962 1971 to 1974 1976 to 1980 1988 to 1994 1999 to 2000
20 to 39 40 to 59 60 to 74
women men
age [years] age [years]
prevalenceof obesity[%] prevalenceof obesity[%]
0 5 10 15 20 25 30 35 40
0 5 10 15 20 25 30 35 40
20 to 39 40 to 59 60 to 74
1960 to 1962 1971 to 1974 1976 to 1980 1988 to 1994 1999 to 2000
20 to 39 40 to 59 60 to 74
women men
age [years] age [years]
prevalenceof obesity[%] prevalenceof obesity[%]
0 5 10 15 20 25 30 35 40
0 5 10 15 20 25 30 35 40
Figure 1: Prevalence of obesity in the USA
Trends in the age-specific prevalence of obesity of women (left panel) and man (right panel) in the USA between the years 1960 and 2000 (Flegal et al., 2002).
1.2 Energy homeostasis
Body weight is determined by the balance between energy intake and energy
expenditure. An imbalance of energy intake over energy expenditure leads to a positive
energy balance resulting in calories stored in form of fat. Obesity results from a long-
Introduction term positive energy balance. Therefore, the research on mechanisms regulating energy homeostasis, i.e. the balance between caloric intake and energy expenditure is imperative to understand the mechanisms of obesity.
Energy homeostasis is achieved by the integration of peripheral metabolic signals by neural circuits and is predominantly regulated by the central nervous system (for review, see (Schwartz and Porte, 2005)). The brain integrates signals from hormones and nutrients and adjusts feeding behaviour and substrate metabolism to regulate energy homeostasis (Figure 4). In times of sufficient fat stores and food availability, the brain receives signals that lead to the inhibition of food intake and endogenous glucose production and to the increase of energy expenditure and mobilization of fat stores. Conversely, signals on food deficiency and low energy stores result in responses that promote energy intake and hepatic glucose production and in contrast inhibit energy expenditure.
Two major hormones secreted from peripheral organs that are crucial for the regulation of energy homeostasis are the adipocyte-derived hormone leptin and the pancreatic β-cell hormone insulin. They regulate energy balance by directly acting on peripheral organs and by signaling the body’s energy stores to the central nervous system.
1.3 Leptin
Adipose tissue was considered as an inert energy depot for a long time.
Nowadays various functions of adipocytes are known, which are controlled by neuronal and hormonal mechanisms (Ailhaud, 2000; Kahn and Flier, 2000). Adipose tissue serves as an energy reservoir for the body. To expand its capacity, the number of cells can increase and individual adipocytes can alter their volumes up to 1000-fold to be filled with triacylglycerol (Fruhbeck et al., 2001). Leptin is a hormone predominantly secreted from white adipose tissue (from greek: leptos = thin) and at low levels produced in gastric epithelium, placenta and testis (Bado et al., 1998; Herrid et al., 2007;
Masuzaki et al., 1997; Zhang et al., 1994). Leptin is the product of the obese (ob) gene
and critically involved in energy homeostasis. The 16 kDa protein was discovered in
1994 by J. Friedman, who found that mutation of the ob gene resulted in profound
Introduction obesity and type 2 diabetes mellitus (Zhang et al., 1994). For the first time a hormone secreted from adipose tissue was identified that informs the brain about body energy stores. Leptin is secreted in proportion to adipocyte size and number and thus signals energy stores from the periphery to the central nervous system to suppress food intake and stimulate energy expenditure (Campfield et al., 1995; Halaas et al., 1995; Schwartz et al., 1996b; Walker et al., 2002). The importance of leptin in the regulation of energy homeostasis is reflected in ob/ob mice, which do not synthesize leptin and in db/db mice, which lack the leptin receptor. Ob/ob and db/db mice show a similar phenotype, both are characterized by hyperphagia and extreme obesity (Li et al., 1998; Licinio et al., 2004). Central and peripheral administration of leptin to ob/ob mice reverses the hyperphagia and obesity (Campfield et al., 1995; Pelleymounter et al., 1995). Similarly, chronic peripheral administration of leptin to wild type rodents results in reduced food intake, loss of body weight and fat mass (Halaas et al., 1995). Shortly after the discovery of leptin, the corresponding defects to ob/ob and db/db mice were also described in patients with forms of severe hyperphagia and obesity (Clement et al., 1998;
Montague et al., 1997). As in rodents, also the obesity in humans caused by mutations resulting in the absence of leptin can be ameliorated with recombinant leptin therapy (Farooqi et al., 1999; Licinio et al., 2004).
In addition to the ability for long-term signaling as a reflection of body energy stores, leptin also responds to acute stimuli. Leptin expression decreases during fasting and is restored by refeeding. However, leptin secretion does not increase significantly after a meal and thereby does not by itself lead to the termination of a meal (Considine et al., 1996b; Maffei et al., 1995). Leptin secretion from adipocytes is stimulated by glucose, insulin and increased adipocyte glucose metabolism (Levy et al., 2000; Mizuno et al., 1996; Saladin et al., 1995; Walker et al., 2005). Conversely, the secretion of leptin is inhibited by some fatty acids (Cammisotto et al., 2003; Shintani et al., 2000) and an increased rate of lipolysis in adipocytes (Coppack et al., 1998; Donahoo et al., 1997).
Circulating leptin is transported to the brain across the blood-brain barrier via a saturable process (Banks et al., 1996). The transport of leptin is regulated by acute stimuli. Starvation reduces and refeeding increases the transport of leptin across the blood-brain barrier (Kastin and Pan, 2000).
Besides its ability to regulate energy metabolism, leptin plays an important role
in the regulation of growth and reproduction, reflected in ob/ob and db/db mice, which
Introduction leptin levels are also correlated with fertility in humans (Mantzoros et al., 1997;
Matkovic et al., 1997; Welt et al., 2004). Furthermore, leptin activates the thyroid axis and the sympathetic nervous system and suppresses the production of adrenal corticosteroids (Bornstein et al., 1997; Harris et al., 2001; Pralong et al., 1998;
Rahmouni et al., 2002). Moreover, leptin regulates glucose homeostasis both directly and secondary to the regulation of body weight. The direct regulation is partly mediated via the central nervous system, and additionally, leptin also directly regulates pancreatic β-cells and insulin-sensitive tissues (Burcelin et al., 1999; Covey et al., 2006; Kulkarni et al., 1997; Liu et al., 1998) .
1.3.1 Mechanisms of leptin receptor signaling
Multiple leptin receptor isoforms are encoded by a single leptin receptor gene
(ObR), each containing an identical ligand binding domain but differing by the
presence or absence of a transmembrane domain or a complete cytosolic domain (Lee
et al., 1996; Tartaglia et al., 1995). The function of the short splice variants which lack
a complete cytosolic domain (LEPR-A, C, D, E and F) remains undistinct. The secreted
isoforms (LEPR-E and proteolytic cleavage products of membrane-bound leptin
receptor forms) of the leptin receptor contain only the extracellular leptin-binding
domain and are thought to bind circulating leptin thus modulating its biological activity
(Ge et al., 2002). LEPR-A is expressed ubiquitously and is the predominant form of the
short isoforms (Lollmann et al., 1997). The long form of the leptin receptor LEPR-B is
also expressed ubiquitously, but at much lower levels than LEPR-A, except for the
hypothalamus, where the LEPR-B isoform represents the predominant form of the
leptin receptor transcripts (Hoggard et al., 1997; Luoh et al., 1997). Of all isoforms,
only LEPR-B (ObRb) contains the complete cytosolic domain required for modulation
of the known intracellular signaling effectors of leptin action. ObRb is a member of the
class I cytokine receptor family and functions as a dimer activating the Janus
kinase/signal transducer and activator of transcription (Jak/Stat) signaling pathway
(Kloek et al., 2002; Tartaglia et al., 1995). Binding of leptin to the long form of the
receptor results in activation of constitutively associated Jak2 leading to the
autophosphorylation of Jak2 on multiple tyrosine residues and phosphorylation of three
tyrosine residues of the receptor, Tyr
985, Tyr
1077and Tyr
1138(Figure 2) (Banks et al.,
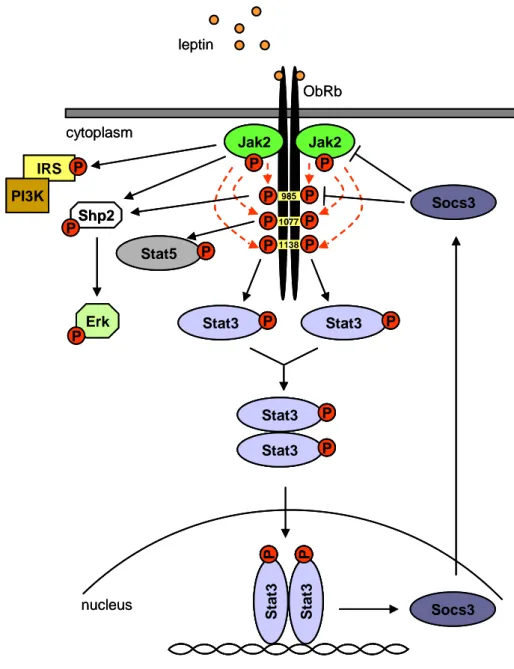
Introduction 2000; Tartaglia, 1997; White et al., 1997). Importantly, ObRb is the only leptin receptor isoform that contains intracellular tyrosine residues. The phosphorylation of each of the three tyrosine residues of the receptor leads to activation of different downstream signaling pathways.
Phosphorylation of Tyr
985results in binding and phosphorylation of the tyrosine phosphatase Shp2 and thereby in activation of the extracellular signal-regulated kinase (Erk) signaling pathway, which was suggested to play a role in energy balance and metabolism (Figure 2) (Bagnol et al., 1999; Bjorbaek et al., 2001; Zhang et al., 2004).
The function of Tyr
1077of the leptin receptor is controversial, but it was shown recently, that phosphorylation of Tyr
1077recruits and activates the signal transducer and activator of transcription (Stat) 5, presumably contributing to the transcriptional response to leptin (Gong et al., 2007). Phosphorylation of Tyr
1138creates a docking site for Stat3, which is activated by tyrosine-phosphorylation upon binding to the receptor (Banks et al., 2000; Vaisse et al., 1996). Phosphorylated Stat3 dimerizes and translocates from the cytoplasm to the nucleus to modulate transcription of multiple target genes via Stat- responsive elements (Lutticken et al., 1994; Stahl and Yancopoulos, 1994). One of the genes activated by Stat3 is the suppressor of cytokine signaling 3 (Socs3) (Endo et al., 1997; Naka et al., 1997; Starr et al., 1997). Expression of Socs3 is induced in hypothalamic regions important for the regulation of feeding by peripheral administration of leptin to ob/ob mice (Bjorbaek et al., 1998). Socs3 plays an important role in leptin signaling by inhibiting leptin signaling in a negative feedback loop by multiple mechanisms. Socs3 can bind directly to Jak2, leading to diminished phosphorylation of downstream molecules by Jak2 (Endo et al., 1997; Naka et al., 1997;
Yasukawa et al., 1999) and to attenuated leptin-induced tyrosine phosphorylation of Jak2 (Bjorbaek et al., 1999). Moreover, Socs3 directly inhibits the leptin receptor itself by binding to Tyr
985and consequently inhibiting the Stat3 signal (Bjorbak et al., 2000).
However, binding of Socs3 to Tyr
985does not diminish the activation of Erk (Dunn et al., 2005). Inhibition of Erk by Stat3 is rather mediated via inhibition of Jak2 (Dunn et al., 2005).
Additionally, binding of leptin to ObRb mediates tyrosine-phosphorylation of
insulin receptor substrate (IRS) proteins and activation of the phosphatidylinositol-3
kinase (PI3K) directly by Jak2, independently of tyrosine phosphorylation sites of the
receptor (Figure 2) (Banks et al., 2000; Niswender et al., 2001).
Introduction
Jak2 P
Jak2 P cytoplasm
ObRb leptin
Stat3 P Stat3 P
Stat3 P Stat3 P
Stat3P Stat3P
nucleus
P P
P P
P P
985 1077
Stat5 P 1138
IRS PI3K
P
Shp2
Erk P
Socs3 Socs3
P
Jak2 P Jak2
P
Jak2 P Jak2
P cytoplasm
ObRb leptin
Stat3 P
Stat3 P Stat3Stat3 PP
Stat3 P Stat3 P Stat3 P Stat3 P Stat3 P Stat3 P
Stat3P Stat3P
Stat3P Stat3P
Stat3PStat3P Stat3PStat3P nucleus
P P
P P
P P
985 1077
Stat5 P 1138
Stat5 P IRS
PI3K P
Shp2
Erk P
Socs3 Socs3
P
Figure 2: Leptin receptor signaling
Binding of leptin to the long form of the leptin receptor leads to activation of Jak2 and subsequently to Jak2-mediated phosphorylation of three different intracellular tyrosine residues of the receptor resulting in different downstream signaling pathways. Phosphorylated Jak2 directly activates the IRS/PI3K and the Shp2/Erk signaling pathway. Furthermore, Jak2-mediated Tyr985 phosphorylation of the receptor contributes to the activation of the Shp2/Erk pathway. Phosphorylation of Tyr1077 leads to activation of Stat5, whereas phosphorylation of Tyr1138 mediates the phosphorylation and thereby activation of Stat3.
Activated Stat3 dimerizes, translocates to the nucleus and activates target genes including Socs3, which in turn inhibits leptin signaling in a negative feedback loop by inhibiting Jak2 and the receptor via Tyr985. ObRb: long form of the leptin receptor; Jak2: janus kinase 2; Stat3: signal transducer and activator of transcription 3; Socs3: suppressor of cytokine signaling 3; Shp2: protein tyrosine phosphatase 2; Erk:
extracellular signal-regulated kinase; IRS: insulin receptor substrate; PI3K: phosphatidylinositol-3 kinase.
Introduction
1.4 Insulin
The peptide-hormone insulin produced by the β-cells of the islets of Langerhans in the pancreas represents a major hormone in the control of energy homeostasis and glucose metabolism. Insulin was discovered in 1921 by Frederick Banting and Charles Best, who were awarded the Nobel Prize in Medicine for their discovery two years later.
Insulin is synthesized as the inactive precursor proinsulin, which is then cleaved to insulin by different peptidases (Docherty and Hutton, 1983). Insulin is predominantly secreted upon rising levels of blood glucose and acts on peripheral tissues, particularly on muscle cells and adipocytes via translocation of the glucose transporter to remove the glucose from the blood and store it in form of glycogen (Birnbaum, 1992; Cushman and Wardzala, 1980; Poitout et al., 2006). In addition to glucose clearance from the blood, insulin increases glycolysis and inhibits gluconeogenesis (for review, see (Pilkis and Granner, 1992)). Insulin stimulates anabolic processes like triacylglycerol storage in adipocytes by augmenting adipocyte glucose uptake and by directly stimulating enzymes involved in fatty acid esterification (Cushman et al., 1984; Sul et al., 2000) and inhibits catabolic processes like glycogenolysis and lipolysis. In addition to the effect of insulin on peripheral tissues, it circulates in proportion to fat mass and crosses the blood-brain barrier to act on the central nervous system as an adiposity signal (Bagdade et al., 1967; Polonsky et al., 1988). Neuronal insulin receptor knockout mice demonstrate diet-sensitive obesity and insulin resistance (Bruning et al., 2000).
Consistently, central administration of insulin results in reduction of body weight
whereas insulin-deficient animals are hyperphagic (Sipols et al., 1995; Strubbe and
Mein, 1977). In contrast, central administration of antibodies against insulin and
diminished insulin receptor expression increase food intake (Obici et al., 2002a; Woods
et al., 1979). Furthermore, the central nervous system is required for insulin’s ability to
suppress hepatic glucose production (Inoue et al., 2006; Konner et al., 2007).
Introduction 1.4.1 Mechanisms of insulin receptor signaling
The heterotetrameric insulin receptor is ubiquitiously expressed and belongs to the family of ligand-activated receptor tyrosine kinases. Binding of insulin leads to autophosphorylation of the receptor on three intracellular tyrosine residues resulting in complete activation of the intrinsic tyrosine activity of the receptor. Receptor autophosphorylation results in recruitment and binding of intracellular proteins through their phosphotyrosine binding domains. Signaling molecules for the insulin receptor include the insulin receptor substrates (IRS) 1 to 4 which are phosphorylated by the receptor upon binding and thereby serve as a docking platform for other proteins, leading to activation of different downstream signaling pathways. Two major pathways activated by the IRS proteins are the Ras/Raf Mitogen activated protein (MAP) kinase and the PI3K pathway (Backer et al., 1992; Howe et al., 1992).
1.5 Central regulation of energy homeostasis
1.5.1 The hypothalamus
During the last decades, the research on the central regulation of energy
homeostasis has focused on the hypothalamus. The hypothalamus is a part of the
diencephalon located in the middle of the base of the brain below the thalamus. It
synthesizes and secretes neurohormones and -peptides, many of them involved in the
control of feeding and energy balance. The hypothalamus is also involved in the
regulation of body temperature, circadian cycles, reproduction and the autonomic
nervous system. Histological analysis of the hypothalamus revealed nuclei as clusters of
neurons whithin the hypothalamus. Lesion and electrical stimulation studies of different
hypothalamic nuclei suggested them to act as satiety or feeding centers. The major
hypothalamic nuclei include the arcuate nucleus (ARC), the paraventricular nucleus
(PVN), the ventromedial nucleus of the hypothalamus (VMH), the dorsomedial
hypothalamic nucleus (DMH) and the lateral hypothalamic area (LHA), which is
vaguely defined (Figure 3) (for review, see (Williams et al., 2000)).
Introduction
LHA LHA
ARC
VMH VMH
PVN
DMH DMH
PVN
ARC
blood-brain barrier
ME
LHA LHA
ARC
VMH VMH
PVN
DMH DMH
PVN
ARC
blood-brain barrier
ME
Figure 3: Basic anatomy of the hypothalamus
Schematic frontal section of the hypothalamus including main regions implicated in energy homeostasis.
PVN, DMH, VMH and ARC surround the third ventricle (black). PVN: paraventricular nucleus; DMH:
dorsomedial hypothalamic nucleus; VMH: ventromedial nucleus of the hypothalamus; ARC: arcuate nucleus; ME: median eminence; LHA: lateral hypothalamic area.
The ARC is located in the mediobasal hypothalamus adjacent to the base of the
third ventricle and lies above the median eminence. The ARC/median eminence area
has a modified blood-brain barrier that allows simplified signaling of circulating
molecules, including insulin and leptin (Broadwell and Brightman, 1976; Faouzi et al.,
2007). The PVN is located at the dorsal end of the third ventricle and represents the
hypothalamic part where numerous neuronal pathways implied in the regulation of
energy balance converge, including the major projections from the ARC. Lesions of the
PVN and the VMH, which is located directly above the ARC, result in severe
hyperphagia and obesity. The DMH is located dorsal of the VMH and was suggested to
integrate information from the LHA and other medial hypothalamic nuclei. The LHA
contains projections from and to the medial hypothalamus and brainstem structures. The
LHA was described as a classical feeding centre, as lesions of the LHA result in
hypophagia (Bernardis et al., 1992).
Introduction 1.5.2 The arcuate nucleus of the hypothalamus
Recent research on energy homeostasis has focused on the ARC of the hypothalamus. The ARC senses and integrates signals received following changes in peripheral energy stores. The integrated signals regulate neuropeptides, which modulate feeding and energy expenditure. Two major neuronal populations situated in the ARC responsible for integrating energy signals from the periphery are the orexigenic agouti- related peptide (AgRP)/neuropeptide Y (NPY) producing neurons and the anorexigenic proopiomelanocortin (POMC) producing neurons. AgRP and NPY are orexigenic neuropeptides that stimulate feeding and reduce energy expenditure, while the anorexigenic neuropeptide POMC suppresses feeding and increases energy expenditure (Larhammar, 1996; McMinn et al., 2000; Rossi et al., 1998). Consistently, mutation of the human AgRP gene (Ala67Thr) is associated with inherited leanness (Marks et al., 2004), whereas mutations causing a deficiency in POMC or its receptor (melanocortin-3 and -4 receptor (MC3R and MC4R)) are the most common reasons of genetic obesity in humans (Farooqi and O'Rahilly, 2005b). The neurotransmitters AgRP and POMC are part of the melanocortin system which promotes negative energy balance. The melanocortin system is inhibited by AgRP and activated by melanocortins derived from POMC (for review, see (Wilson et al., 2006)).
POMC is a 241 amino acid precursor peptide of the melanocyte-stimulating hormones (MSHs) and adrenocorticotrophin (ACTH) as well as β-endorphin (Chretien et al., 1979). Apart from the ARC, POMC is expressed in the pituitary, the nucleus tractus solitarius of the brainstem and in several peripheral tissues (Harris, 1959; Joseph et al., 1983; Lacaze-Masmonteil et al., 1987). The energy status of the body is reflected by levels of POMC expression, as POMC mRNA is markedly reduced in fasted animals and restored after refeeding (Swart et al., 2002). In the hypothalamus, the most potent melanocortin α-MSH binds MC3R and MC4R, which are G-protein coupled receptors that activate the adenylate cyclase (Jegou et al., 2000; Mountjoy et al., 1994).
Intracerebroventricular (ICV) injection of α-MSH reduces food intake and body weight and POMC deficiency is characterized by severe early onset obesity in mice (McMinn et al., 2000; Yaswen et al., 1999).
The orexigenic neurotransmitter AgRP consists of 132 amino acids. It is
coexpressed with NPY in a distinct neuronal population of the ARC and functions as a
MC3R/MC4R antagonist (Ollmann et al., 1997). Aside from the ARC the only
Introduction peripheral tissue with detectable AgRP expression is the adrenal gland (Ollmann et al., 1997). The expression of AgRP mRNA in the ARC is elevated upon fasting (Swart et al., 2002). Transgenic mice with ubiquitous overexpression of AgRP are obese (Ollmann et al., 1997) and ICV injection of AgRP increases food intake and is able to block the reduction of food intake resulting from ICV injection of α-MSH (Rossi et al., 1998). Reduction of hypothalamic AgRP mRNA results in increased metabolic rate and in reduction of body weight without affecting food intake (Makimura et al., 2002).
While neonatal ablation of AgRP/NPY neurons has minimal effects on feeding, selective ablation of AgRP/NPY neurons in adult mice results in acute reduction of food intake (Gropp et al., 2005; Luquet et al., 2005).
The orexigenic neuropeptide NPY is a 36 amino acid peptide and one of the most abundant neurotransmitters (Minth et al., 1984). NPY binds to a family of seven- transmembrane-domain G-protein-coupled receptors, Y1 to Y6 to increase food intake and body weight gain and reduce energy expenditure (Larhammar, 1996). NPY is expressed at high levels in several central nervous system regions, however, the major site for NPY expression is the ARC of the hypothalamus (Morris, 1989). NPY is the most potent endogenous orexigenic signal. Like the expression of AgRP, also the expression of hypothalamic NPY mRNA and the release of NPY increase with fasting and decrease after refeeding, but the decrease after refeeding appears earlier than that of AgRP (Chua et al., 1991; Pages et al., 1993; Swart et al., 2002). Central administration of NPY causes obesity as a result of hyperphagia and decreased energy expenditure (Billington et al., 1991; Stanley et al., 1986). As described above, ablation of AgRP/NPY neurons in adult mice causes immediate starvation and drastic weight loss (Gropp et al., 2005; Luquet et al., 2005).
Both AgRP/NPY and POMC neurons originating in the ARC project primarily
to the PVN, where numerous feeding-related pathways converge. Moreover, they
project to the DMH and VMH and the perifornical part of the LHA, regions known to
be important in the control of energy homeostasis (Bagnol et al., 1999; Williams et al.,
2000). In the PVN, AgRP, NPY and POMC are secreted from the nerve terminals and
bind to their specific receptors, resulting in the regulation of neuropeptides important
for energy homeostasis in the PVN, including corticotropin-releasing hormone (CRH)
and thyrotropin-releasing hormone (TRH), which were shown to exhibit anorexigenic
potential (Fekete et al., 2001; Sainsbury et al., 1997). Moreover, peptides of the
Introduction signaling. Melanin-concentrating hormone (MCH) for example is expressed in in the LHA in neurons that receive synaptic input from AgRP/NPY and POMC neurons originating in the ARC (Elias et al., 1998). MCH acts as an orexigenic neuropeptide, reflected in animals lacking MCH which exhibit reduced food intake and body fat stores (Qu et al., 1996; Shimada et al., 1998). Hypothalamic MCH neurons in turn project to diverse forebrain and hindbrain areas also known to be involved in the regulation of food intake. Another group of neurons in the perifornical part of the LHA receiving synaptic input from AgRP/NPY neurons are the hypocretin expressing neurons, which in turn innervate AgRP/NPY and POMC cells in the ARC (Williams et al., 2000).
Hypocretin acts as an orexigenic peptide to stimulate food intake and concomitantly increases locomotor activity in mice. Accordingly, hypothalamic hypocretin levels are upregulated during fasting (Sakurai et al., 1998).
1.5.2.1 Regulation of neurons located in the arcuate nucleus
A major target site for leptin signaling is the ARC of the hypothalamus. Aside from the DMH and the VMH, the highest levels of ObRb expression are found in the ARC (Elmquist et al., 1998). Both AgRP/NPY and POMC neurons within the ARC express the long form of the leptin receptor (Cheung et al., 1997; Wilson et al., 1999) and are directly regulated by leptin. While the orexigenic AgRP/NPY-producing neurons are inhibited by leptin (Elias et al., 1999; van den Top et al., 2004), the anorexigenic POMC neurons are activated (Cowley et al., 2001; Elias et al., 1999).
Thus, leptin stimulates the production and secretion of anorexigenic neuropeptides and reciprocally suppresses levels of orexigenic peptides. Consistently, ob/ob and db/db mice exhibit elevated levels of AgRP and NPY mRNA and reduced levels of POMC mRNA (Mizuno and Mobbs, 1999; Schwartz et al., 1997; Shutter et al., 1997).
Administration of leptin stimulates expression of POMC (Kitamura et al., 2006;
Schwartz et al., 1996c) and inhibits expression of AgRP and NPY (Fekete et al., 2006;
Morrison et al., 2005). Moreover, administration of a MC4R antagonist attenuates the
anorexigenic response of leptin (Seeley et al., 1997). It has been shown that leptin
increases the frequency of action potentials in POMC neurons by depolarization through
a nonspecific cation channel and reduced inhibition by local NPY neurons (Cowley et
al., 2001).
Introduction Both AgRP/NPY and POMC neurons coexpress the insulin receptor and the leptin receptor (Benoit et al., 2002; Schwartz et al., 1992). Insulin signals to the ARC of the hypothalamus to inhibit orexigenic AgRP/NPY neurons and to stimulate anorexigenic POMC neurons (Benoit et al., 2002; Choudhury et al., 2005; Schwartz et al., 2000; Sipols et al., 1995). Central administration of insulin results in increased POMC and decreased NPY expression, without affecting the expression of AgRP (Fekete et al., 2006). Recently, it was shown that insulin signaling in AgRP neurons is required for insulin’s ability to suppress hepatic glucose production (Konner et al., 2007).
Besides the ability of the central nervous system to integrate information about the body energy status derived from hormones like insulin and leptin, the hypothalamus can also respond directly to circulating concentrations of nutrients, in particular of glucose and free fatty acids. Central administration of glucose decreases blood glucose levels (Lam et al., 2005) and central administration of oleic acid inhibits food intake by inhibiting NPY gene expression (Obici et al., 2002b). It has been shown that molecular disruption of the hypothalamic nutrient-sensing mechanism via overexpression of malonyl-coenzyme A decarboxylase involved in fatty acid metabolism induces obesity (He et al., 2006). Furthermore, inhibition of hypothalamic lipid oxidation and central inhibition of fatty acid synthase inhibit feeding (Benoit et al., 2002; Clegg et al., 2002;
Loftus et al., 2000; Obici et al., 2002b).
Introduction
adiposity signals (insulin, leptin)
energy intake
energy expenditure
white adipose tissue
plasma glucose nutrient-related
signals
pancreas
liver brain
AgRP/NPY
POMC second order
neuron
- +
adiposity signals (insulin, leptin) adiposity signals
(insulin, leptin)
energy intake
energy expenditure energy
intake
energy expenditure
white adipose tissue
plasma glucose plasma glucose nutrient-related
signals nutrient-related
signals
pancreas pancreas
liver brain
AgRP/NPY
POMC second order
neuron
-- +
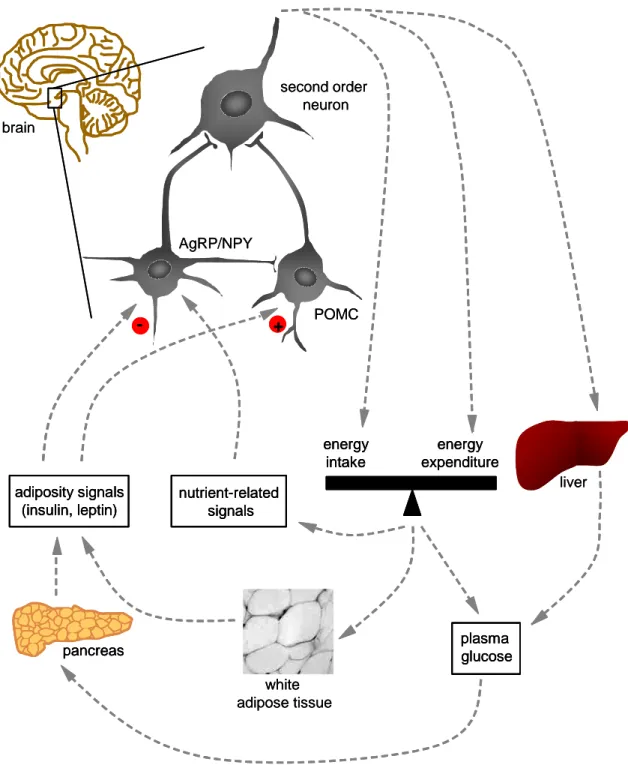
Figure 4: Regulation of energy homeostasis
The brain, in particular AgRP/NPY and POMC neurons located in the ARC of the hypothalamus sense and integrate signals on body energy stores such as insulin secreted from the pancreas and leptin secreted from white adipose tissue and signals on circulating nutrients such as glucose and free fatty acids.
AgRP/NPY and POMC neurons respond via second order neurons, thus regulating hepatic glucose production and energy balance by the regulation of energy intake and energy expenditure (Schwartz and Porte, 2005).
Introduction 1.5.3 Central regulation of energy homeostasis by leptin in vivo
The study of db/db mice, which lack the long form of the leptin receptor in all tissues, and of ob/ob mice, which do not synthesize leptin, reveals the importance of leptin signaling in the regulation of energy homeostasis. The phenotype observed in db/db and ob/ob mice resembles abnormalities seen in starved animals, including decreased body core temperature, hyperphagia accompanied by elevated AgRP and NPY and reduced POMC expression, decreased energy expenditure, locomotor activity and immune function and infertility (Coleman, 1978). Db/db and ob/ob mice develop profound and early-onset obesity weighing three times more than normal mice and exhibiting a fivefold increase in body fat content. Although the leptin receptor is widely expressed in many tissues, the absence of central leptin receptor signaling accounts for most of the defects observed in db/db mice. Accordingly, mice exclusively lacking neuronal leptin receptors show defects similar to db/db mice, which lack peripheral leptin receptors additionally (Cohen et al., 2001). Furthermore, expression of a neuron- specific leptin receptor transgene in db/db mice leads to a complete rescue of obesity, diabetes and infertility along with improved expression of AgRP, NPY and POMC mRNA (de Luca et al., 2005).
Mutation of Tyr
985of the leptin receptor in vivo leads to the absence of inhibitory leptin signals. Leptin activates autoinhibitory signals via Tyr
985of its receptor to attenuate the anti-obesity effects. According to this, mice carrying the Tyr
985mutation exhibit increased leptin sensitivity, reduced adiposity, hypophagia and decreased AgRP and NPY but normal POMC expression. (Bjornholm et al., 2007). On the other hand, deletion of neuronal Shp2 leads to development of early-onset obesity due to alterations of energy metabolism in the absence of hyperphagia in spite of increased NPY expression (Zhang et al., 2004).
The involvement of the IRS/PI3K signaling pathway in ObRb-mediated leptin
signaling is reflected in IRS2 deficient mice, which display increased feeding and
decreased metabolic rate in the presence of increased adiposity and circulating leptin,
suggesting leptin resistance (Burks et al., 2000; Tobe et al., 2001). Leptin-evoked
activation of PI3K regulates the membrane potential of hypothalamic neurons in vivo
(Harvey et al., 2000; Plum et al., 2006; Spanswick et al., 1997). Pharmacological
inhibition of hypothalamic PI3K blocks the anorectic effect of leptin (Niswender et al.,
Introduction 2001). Moreover, PI3K is also involved in the regulation of sympathetic nervous system function by leptin (Rahmouni et al., 2002).
The contribution of Stat3 signaling to leptin action was studied in mice with mutated Tyr
1138of the leptin receptor leading to a selective disruption of the leptin receptor-Stat3 signal. Mice with mutated Tyr
1138are obese, hyperphagic, exhibit reduced energy expenditure including reduced locomotor activity but show no growth impairment or infertility. While hypothalamic NPY expression is not increased as observed in db/db mice, the melanocortin signaling pathway is suppressed indicated by reduced POMC and elevated AgRP mRNA expression (Bates et al., 2003). Consistent with those mice, pan-neuronal Stat3 knockout mice are also obese, hyperphagic with reduced energy expenditure and exhibit elevated expression of AgRP mRNA (Gao et al., 2004). Thus, leptin receptor mediated activation of Stat3 mediates the effect of leptin on melanocortin signaling and thereby on energy homeostasis. On the other hand, leptin- regulated expression of NPY is regulated by signals other than Stat3 (Bates et al., 2003).
The role of leptin signaling in POMC neurons in vivo was investigated in mice with selective deletion of the leptin receptor in POMC neurons. These mice are mildly obese, hyperleptinemic and exhibit reduced expression of POMC mRNA (Balthasar et al., 2004). Mice with deletion of Stat3 selectively in POMC neurons demonstrate that POMC expression is directly activated by Stat3 (Xu et al., 2007).
Several observations indicate that inhibition of AgRP by leptin is independent of Stat3 in vivo, although Stat-responsive elements exist in the 5’ region of AgRP and overexpression of Stat3 caused inhibtion of AgRP in reporter gene assays (Brown et al., 2001; Kitamura et al., 2006). On the other hand, it was shown that leptin requires intact PI3K signaling for inhibition of AgRP expression and that activation of Stat3 by leptin is not required for the regulation of AgRP neurons (Morrison et al., 2005). Most importantly, mice lacking Stat3 in AgRP neurons exhibit normal levels of AgRP mRNA (Kaelin et al., 2006). However, the exact molecular mechanism by which leptin inhibits AgRP expression is still unclear.
Besides the regulation of food intake, leptin also regulates locomotor activity, as
ob/ob mice are hypoactive and leptin treatment normalizes this defect in locomotor
activity (Pelleymounter et al., 1995). One study has implicated leptin action in the ARC
in the regulation of locomotor activity, since selective unilateral restoration of leptin
signaling in the ARC of leptin receptor deficient mice leads to a decrease of food intake
and body weight and also normalizes locomotor activity (Coppari et al., 2005).
Introduction Nevertheless, the exact neuronal population in the ARC responsible for leptin-evoked locomotor activity has not been identified and the molecular mechanisms involved still remain unknown.
1.6 Objectives
The role of leptin signaling and in particular the role of leptin-evoked Stat3
signaling in the regulation of AgRP neurons remains a controversial issue. To address
the role of Stat3 signaling directly in AgRP expressing neurons of the ARC in vivo,
mice expressing a constitutively active version of Stat3 selectively in AgRP neurons
upon Cre-mediated recombination were generated (Stat3-C
AgRPmice). Characterization
of Stat3-C
AgRPmice elucidated the physiological role of Stat3 signaling in AgRP
neurons, particularly on the regulation of energy homeostasis and neuropeptide
expression. Additionally, Stat3-C
AgRPmice were crossed with leptin-deficient ob/ob
mice to further analyze the role of leptin evoked Stat3 signaling in vivo.
Materials and Methods
2 Materials and Methods
2.1 Chemicals and biological material
All chemicals used in this work are listed in table 1 and all enzymes used in this work are listed in table 2. Solutions were prepared with double distilled water. Bacterial media were autoclaved prior to use.
Table 1: Chemicals
Chemicals Supplier
Agarose Peqlab, Erlangen, Germany
Agarose Ultra Pure Invitrogen, Karlsruhe, Germany Ascorbic acid Sigma, Steinheim, Germany 5-bromodeoxyuridine (BrdU) Sigma, Steinheim, Germany Calcium chloride Merck, Darmstadt, Germany
Carbon dioxide (solid) Hans Berrenrat GmbH, Köln, Germany Chloroform Applichem, Darmstadt, Germany Dimethylsulfoxide (DMSO) Sigma, Steinheim, Germany
Formaldehyde Merck, Darmstadt, Germany
Formamide Applichem, Darmstadt, Germany
Denhardt’s Applichem, Darmstadt, Germany
di-sodium hydrogen phosphate Merck, Darmstadt, Germany
dNTPs Amersham, Freiburg, Germany
Ethanol, absolute Roth, Karlsruhe, Germany Ethidium bromide Applichem, Darmstadt, Germany Ethylendiamine tetraacetate (EDTA) Applichem, Darmstadt, Germany Fetal calf serum (FCS) Invitrogen, Karlsruhe, Germany Gene Ruler DNA Ladder Mix Fermentas, St. Leon-Rot, Germany Glucose, 20 % DeltaSelect, Dreieich, Germany
Glycerol Applichem, Darmstadt, Germany
Glycine Sigma, Steinheim, Germany
Hepes Applichem, Darmstadt, Germany
Material and Methods Hydrochloric acid (37 %) KMF Laborchemie, Lohmar, Germany
Hydrogen peroxide Sigma, Steinheim, Germany Isopropanol (2-Propanol) Roth, Karlsruhe, Germany Lithium chloride Applichem, Darmstadt, Germany Luria-Bertani (LB) Agar Sigma, Steinheim, Germany Luria-Bertani (LB) Medium Applichem, Darmstadt, Germany Magnesium chloride Merck, Darmstadt, Germany β-Mercaptoethanol Merck, Darmstadt, Germany Nitrogen (liquid) Linde, Pullach, Germany
NP-40 Applichem, Darmstadt, Germany
α-
32P-CTP Amersham, Freiburg, Germany
Paraformaldehyde (PFA) Sigma, Steinheim, Germany
PBS Gibco, Karlsruhe, Germany
Potassium chloride Merck, Darmstadt, Germany Sodium acetate Merck, Darmstadt, Germany Sodium chloride Applichem, Darmstadt, Germany Sodium cholide solution, 0.9 % Berlin-Chemie, Berlin, Germany Sodium citrate Merck, Darmstadt, Germany Sodium di-hydrogen phosphate Merck, Darmstadt, Germany Sodiumdodecylsulfate (SDS) Applichem, Darmstadt, Germany
Sucrose Sigma, Steinheim, Germany
Trishydroxymethylaminomethan
(Tris) Applichem, Darmstadt, Germany
Triton X-100 Sigma, Steinheim, Germany
Tween Applichem, Darmstadt, Germany
Material and Methods
Table 2: Enzymes
Enzymes Supplier
DdeI New England Biolabs, Schwalbach,
Germany
DNase, RNase-free Promega, Madison, WI, USA EuroScript Reverse Transcriptase Eurogentec, Seraing, Belgium
NcoI Fermentas, St. Leon-Rot, Germany
Proteinase K Roche, Basel, Switzerland REDTaq
®DNA Polymerase Sigma, Steinheim, Germany RNase A, DNase-free Fermentas, St. Leon-Rot, Germany RNase inhibitor Roche, Basel, Switzerland
SacI Fermentas, St. Leon-Rot, Germany
T7 polymerase Roche, Basel, Switzerland
2.2 Molecular biology
Standard methods of molecular biology were performed according to protocols described by J. Sambrook (Sambrook et al., 1989), if not stated otherwise.
2.2.1 Competent cells and isolation of plasmid DNA
Competent Escherichia coli (E. coli) DH5α cells were prepared according to a standard protocol (Inoue et al., 1990) and used in heat shock transformation of plasmid DNA. Isolation of plasmid DNA was performed using an alkaline lysis method (E.Z.N.A.
®Plasmid Miniprep Kit 1, Peqlab, Erlangen, Germany) according to manufacturer’s instructions.
2.2.2 Isolation of genomic DNA from mouse tissue
For isolation of genomic DNA, mouse tail biopsies were incubated in lysis
buffer (10 mM Tris/HCl [pH 8]; 10 mM EDTA; 150 mM NaCl; 0.2 % (w/v) SDS; 400
Material and Methods mg/ml proteinase K) at 55 °C for several hours. DNA was precipitated by adding an equal volume of isopropanol, mixed and pelleted by centrifugation. After washing with 70 % (v/v) EtOH, the pellet was dried at room temperature and resuspended in TE- buffer (10 mM Tris/HCl [pH 8]; 1 mM EDTA).
2.2.3 Agarose gel electrophoresis and DNA gel extraction
Amplified and digested DNA fragments were separated by size using agarose gel electrophoresis (1 to 3 % (w/v) agarose (depending on fragment size); 1 x TAE; 0.5 mg/ml ethidiumbromide; 1 x TAE electrophoresis buffer). To elute DNA fragments, the fragments were excised and the DNA was eluted using the QIAEX II kit (Qiagen, Hilden, Germany) according to manufacturer’s instructions.
Quality of RNA was assessed by electrophoresis on denaturing agarose gels (1.2
% (w/v) agarose; 1 x MOPS; 1 % (v/v) formaldehyde; 1 x MOPS electrophoresis buffer).
2.2.4 Construction of a vector for in situ hybridization probe synthesis
To clone a vector for in situ hybridization probe synthesis, a PCR fragment was amplified in vitro from mouse hypothalamic cDNA using the High Fidelity PCR Master Kit (Roche, Basel, Switzerland) and primers containg NPY specific sequences (listed in table 3). The PCR fragment was cloned into the pGEM
®-T Vector using the pGEM
®-T Vector System (Promega, Madison, WI, USA) according to manufacturer’s instructions.
Finally, the construct was verified by SacI and NcoI endonuclease digestion.
Table 3: Primers used for amplification of NPY cDNA
Name of primer Sequence (5’-3’)
NPY-5’ ATG CTA GGT AAC AAG CGA ATG G
NPY-3’ TCA CCA CAT GGA AGG GTC TTC
Material and Methods 2.2.5 Quantification of DNA and RNA
Concentration of nucleic acids was quantified using a spectrophotometer (NanoDrop ND-1000, NanoDrop Technologies, Wilmington, DE, USA). Absorption of samples was measured at 260 nm, which is the highest absorption wavelength for nucleic acids. An OD
260(optical density) of 1 corresponds to 50 µg/ml for double- stranded DNA and to 40 µg/ml for RNA. To assess purity of nucleic acids, the ratio of absorptions at 260 nm versus 280 nm was calculated, as proteins absorb maximum at 280 nm. An OD
260/OD
280ratio of 2 refers to pure nucleic acids, lower values display protein contaminations.
After eluting DNA from agarose gels using the QIAEX II kit, the concentration was assessed by comparing the intensity of the DNA fragment with the band intensity of a standard marker on an agarose gel, as the glassmilk used in the kit for the elution of DNA interferes with UV absorption.
2.2.6 Polymerase chain reaction (PCR)
The polymerase chain reaction was performed to amplify a cDNA fragment in vitro for in situ hybridization probe synthesis, and to detect targeted alleles or transgenes for genotyping of mice (Saiki et al., 1986; Saiki et al., 1985).
To amplify cDNA fragments, the High Fidelity PCR Master Kit (Roche, Basel, Switzerland) containing a polymerase with proofreading activity was used according to manufacturer’s guidlines with 500 ng template cDNA and 25 pmol of each primer (listed in table 4). After an initial denaturation step at 94 °C for 2 min, 13 cycles of denaturation at 94 °C for 15 sec, annealing at 54 °C for 30 sec and elongation at 72 °C for 1 min were followed by another 17 cycles of denaturation at 94 °C for 20 sec, annealing at 54 °C for 30 sec and elongation at 72 °C for 1.5 min. The PCR was finished with a final extension step at 72 °C for 10 min.
Genotyping of mice was performed with 500 ng DNA isolated from tail biopsies
in a total volume of 25 µl containing 25 pmol of each primer (listed in table 8), 25 µmol
dNTPS, 2 to 6 % (v/v) DMSO, 0.625 to 1.2 U REDTaq
®DNA Polymerase and 1 x
REDTaq
®PCR Reaction Buffer (Sigma, Steinheim, Germany). Again, the different
Material and Methods PCRs started with an initial denaturation step at 95 °C for 5 min, followed by 35 to 40 cycles of denaturation at 95 °C for 30 sec, annealing at 54 to 63 °C for 30 to 45 sec and elongation at 72 °C for 30 to 90 sec. The elongation was finished with a final extension step at 72 °C for 10 min.
All PCR reactions were carried out either in an iCycler Thermocycler (Bio-Rad, Hercules, CA, USA) or in a PTC-200 Peltier Thermal Cycler (MJ Research, Waltham, MA, USA).
2.2.7 RT-PCR
Different mouse tissues were dissected and homogenized using an Ultra Turrax homogenizer (IKA, Staufen, Germany). RNA isolation was performed using the RNeasy system (Qiagen, Hilden, Germany) according to the manufacturer’s instructions.
Total RNA was treated with RNase-free DNase and 200 ng RNA were reverse transcribed with EuroScript Reverse Transcriptase according to manufacturer’s guidelines. Fragments of Stat3-C, endogenous Stat3 and GAPDH were amplified using specific primers (listed in table 4).
Table 4: Primers used for amplification of cDNA fragments
amplified cDNA
fragment Name of primer Sequence (5’-3’)
Rosa512 GCC GTT CTG TGA GAC AG Stat3-C
3StatRT AGG ACA TTG GAC TCT TGC AG 5StatRT CAG TCG GGC CTC AGC CC endogenous Stat
3StatRT AGG ACA TTG GAC TCT TGC AG GAPDH-5' ACC ACA GTC CAT GCC ATC AC GAPDH
GAPDH-3' TCC ACC ACC CTG TTG CTG TA
Material and Methods 2.2.8 Analysis of RNA expression
Expression of mRNA was analyzed using quantitative RT-PCR. cDNA was obtained from hypothalamic tissue, white and brown adipose tissue as well as skeletal muscle as described above and amplified using TaqMan
RUniversal PCR-Master Mix, No AmpErase® UNG with TaqMan® Assay on demand kits for AgRP (agouti related protein), HCRT (hypocretin (orexin)), HPRT (hypoxanthine guanine phosphoribosyl transferase 1), MCH (pro-melanin-concentrating hormone), NPY (neuropeptide Y), Socs3 (suppressor of cytokine signaling 3), Stat3 (signal transducer and activator of transcription 3), UCP-1 (uncoupling protein 1), UCP-2 (uncoupling protein 2) and UCP- 3 (uncoupling protein 3) (Applied Biosystems, Foster City, CA, USA) . Analysis of POMC mRNA expression was performed with customized primers listed in table 5.
Standard curves were used based on hypothalamic cDNA, white or brown adipose tissue and skeletal muscle cDNA. Relative expression of samples was adjusted for total RNA content by HPRT RNA quantitative PCR. Calculations were performed by a comparative method (2-ddCT). Quantitative PCR was performed on an ABI-PRISM 7700 Sequence Detector (Applied Biosystems, Foster City, CA, USA). Assays were linear over at least 4 orders of magnitude.
Table 5: Primers used for analysis of POMC mRNA expression
Name of primer Sequence (5’-3’)
POMC sense GAC ACG TGG AAG ATG CCG AG
POMC anti-sense CAG CGA GAG GTC GAG TTT GC
probe sequence FAM-CAA CCT GCT GGC TTG CAT CCG G-TAMRA
Material and Methods
2.3 Biochemistry
2.3.1 Electromobility-Shift Assay (EMSA)
Mice were intraperitoneally injected with either saline or leptin (5 µg/g body weight) (Sigma, Steinheim, Germany) after an over night (16 h) fast and sacrificed after 20 min. Hypothalamic tissue was homogenized in hypotonic solution (10 mM HEPES [pH 7.6]; 10 mM KCl; 2 mM MgCl
2; 0.1 mM EDTA; completed with protease inhibitor cocktail (Roche, Basel, Switzerland)) using an Ultra Turrax homogenizer (IKA, Staufen, Germany) and NP-40 was added to 1 % (v/v) after 10 min incubation on ice. After centrifugation, the nuclear pellet was washed in hypotonic buffer and resuspended in extraction buffer (50 mM HEPES [pH 7.8]; 50 mM KCl; 300 mM NaCl; 0.1 mM EDTA;
10 % (v/v) glycerol). Protein concentration was determined using a photometer (BioPhotometer, Eppendorf, Hamburg, Germany) and the Christian Warburg formula. 4 µg of hypothalamic nuclear extracts were incubated at room temperature for 30 min with 2 µg poly(dI-dC) (Amersham Pharmacia Biotec, Uppsala, Sweden) and 0.5 ng of
32