OF 3D TISSUE MODELS:
A NOVEL MEASUREMENT SETUP FOR NOVEL MEASUREMENT MODES
DISSERTATION ZUR ERLANGUNG DES DOKTORGRADES DER NATURWISSENSCHAFTEN (DR. RER. NAT.) DER FAKULTÄT
CHEMIE UND PHARMAZIE DER UNIVERSITÄT REGENSBURG
vorgelegt von Christina Hupf
aus Lam
im Jahr 2017
Diese Doktorarbeit entstand in der Zeit von März 2012 bis Januar 2017 am Institut für Analytische Chemie, Chemo- und Biosensorik der Fakultät Chemie und Pharmazie der Universität Regensburg.
Die Arbeit wurde angeleitet von Prof. Dr. J. Wegener.
Promotionsgesuch eingereicht am: 05.01.2017
Kolloquiumstermin: 17.03.2017
Prüfungsausschuss:
Vorsitzender: Prof. Dr. Müller
Erstgutachter: Prof. Dr. Wegener
Zweitgutachter: Prof. Dr. Bäumner
Drittprüfer: PD Dr. Breunig
Table of Contents
1 Introduction ... 1
1.1 Multicellular Spheroids as 3D Tissue Models ... 2
1.1.1 Three-Dimensional Cell Culture Models... 2
1.1.2 Spheroid Formation Process and Techniques ... 4
1.1.3 Microenvironment of Spheroids and Multicellular Resistance ... 7
1.1.4 Applications ... 10
1.2 2D Versus 3D Models ... 14
1.3 Analytical Techniques to Study 3D Tissue Models ... 16
2 Objectives ... 23
3 Theoretical Background ... 25
3.1 Electrochemical Impedance Spectroscopy (EIS) ... 25
3.1.1 Physical Background of EIS ... 25
3.1.2 Data Representation ... 27
3.1.3 Data Analysis ... 28
3.1.4 Equivalent Circuit Modeling ... 28
3.2 Electric Properties of Tissue Models... 29
3.3 Electric Cell-Substrate Impedance Sensing (ECIS) ... 33
3.4 Confocal Laser Scanning Microscopy and its Limitations for Spheroid Imaging... 34
4 Materials and Methods ... 39
4.1 Cell Culture Techniques ... 39
4.1.1 Cell Lines ... 39
4.1.2 General Culture Conditions ... 40
4.1.3 Subculturing ... 40
4.1.4 Cryopreservation ... 42
4.1.5 Formation of 3D Tissue Models ... 43
4.1.6 Growth Studies ... 44
4.1.7 Induction of Cardiac or Neuronal Differentiation in P19 Cells . 44 4.1.8 Cell Viability Assay for Spheroids ... 45
4.1.9 Preparation of Hypo- and Hyper-Osmotic Buffers ... 47
4.2 Microscopy ... 48
4.2.1 Microscopes ... 48
4.2.2 Live/Dead Staining with CalceinAM and Ethidium Homodimer ... 50
4.2.3 DAPI Staining of Spheroids ... 51
4.2.4 Microscopic Investigation of the Spheroid Response to Hypo- and Hyper-Osmotic Buffers ... 51
4.3 Impedance Analysis ... 53
4.3.1 Experimental Setup and Instrumentation ... 53
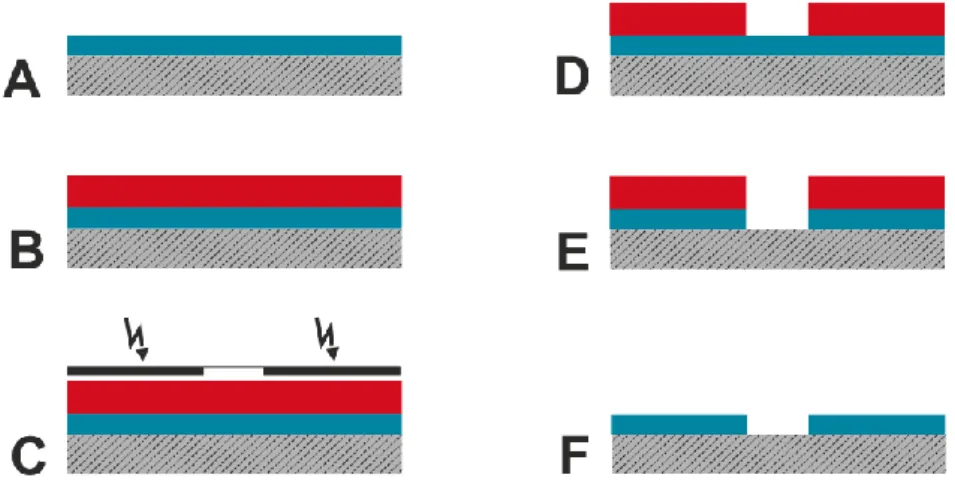
4.3.2 Generation of the Flow Channel Electrode Layout Using Photolithography ... 56
4.3.3 Different Modes of Impedance Measurements ... 57
4.3.4 Flow Channel Handling and Experimental Procedure of an EIS Measurement with Spheroids ... 59
4.3.5 Model Studies with MCF-7 Spheroids ... 60
4.3.5.1 Spheroid Size and Repositioning ... 60
4.3.5.2 Cross-Linked Spheroids ... 61
4.3.5.3 Permeabilized Spheroids ... 62
4.3.5.4 Spheroids Under Osmotic Pressure ... 62
4.3.5.5 Spheroid Response to Cytochalasin D ... 62
4.3.5.6 Spheroid Response to Hyperthermia ... 63
4.3.5.7 Phototoxicity of CaAM on Monolayer Cells and Spheroids ... 63
4.3.5.8 Phototoxicity of Carbon Dots on Monolayer Cells and Spheroids ... 64
4.3.5.9 Testing of Carbon Dot Cytotoxicity on Spheroids ... 65
4.3.6 Measurement Protocol for P19 Embryonic Bodies ... 65
4.3.7 Model Studies with Cor.At® Cardiospheres ... 66
4.3.7.1 Cardiospheres Under Calcium-Free Conditions ... 66
4.3.7.2 Cardiosphere Response to 1-Heptanol ... 67
4.3.7.3 Cardiosphere Response to Isoprenaline ... 67
5 Setup Development and Characterization of MCS in Flow Channels ... 69
5.1 Flow Channel-Based Measurement Setup ... 69
5.1.1 Evolution of the Flow Channel Design ... 69
5.1.2 Materials for the Electrode Layout ... 73
5.1.3 Determination of the Flow Behavior ... 74
5.2 Impedimetric Characterization of the Flow Channel ... 75
5.2.1 Measurement Principle ... 75
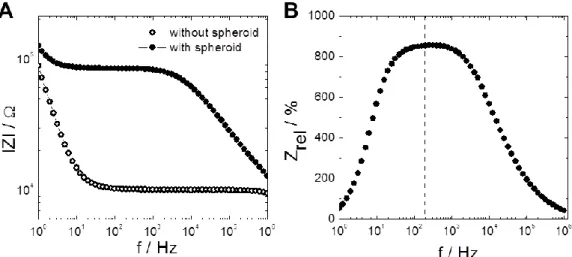
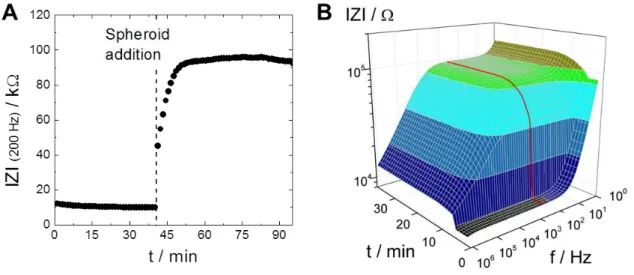
5.2.2 Frequency-Dependent Impedance of the Flow Channel ... 76
5.2.3 Simulated Spectra ... 78
5.2.4 Parasitic Impedance Contribution ... 80
5.3 Influence of Spheroid Size and Repositioning on the Impedance ... 82
5.3.1 Impedance Variations for Spheroids of the Same Batch ... 82
5.3.2 Impedance Variations for Different Spheroid Sizes ... 84
5.3.3 Influence of Repositioning on Spheroid Impedance ... 86
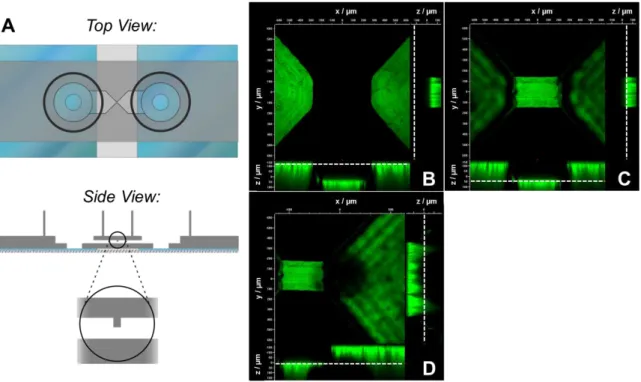
5.4 Visualization of Spheroids in the Channel Using Microscopy ... 88
5.5 Discussion ... 91
5.5.1 Characterization of the New EIS-Based Device ... 91
5.5.2 Influence of Spheroid Size and Repositioning on Impedance . 94 5.5.3 Visualization of Spheroids in the Flow Channel ... 98
6 Impedimetric Model Studies with Tumor Spheroids ... 99
6.1 Growth Behavior of Breast Cancer Spheroids ... 100
6.2 Impedimetric Analysis of Cross-Linked Spheroids ... 101
6.3 Impedimetric Analysis of Permeabilized Spheroids ... 108
6.4 Study of Spheroids Under Osmotic Pressure ... 114
6.5 Investigation of the Spheroid Response to Cytochalasin D ... 119
6.6 Evaluation of the Spheroid Response to Hyperthermia ... 124
6.7 Investigating the Phototoxic Response of Spheroids ... 127
6.7.1 Influence of CalceinAM ... 128
6.7.2 Carbon Dots as Photosensitizers ... 134
6.7.2.1 Cytotoxicity of C-Dots in Spheroids ... 134
6.7.2.2 Phototoxicity of C-dots in MCF-7 Cells in 2D Culture ... 136
6.7.2.3 Phototoxicity of C-dots in MCF-7 Cells in 3D Culture ... 138
6.8 Discussion ... 141
6.8.1 Characterization of MCF-7 Spheroids ... 141
6.8.2 Impact of Spheroid Fixation ... 143
6.8.3 Impact of Spheroid Permeabilization ... 145
6.8.4 Effect of Osmotic Pressure on Spheroids ... 148
6.8.5 Influence of Cytochalasin D on Spheroids ... 151
6.8.6 Spheroid Response to Hyperthermia ... 153
6.8.7 Potential Phototoxicity of CaAM in Spheroids ... 156
6.8.8 Potential Phototoxicity of C-dots in Spheroids ... 158
6.8.9 Results Overview ... 160
7 Impedimetric Model Studies on Cardiospheres... 163
7.1 Characterization of Cor.At® Cardiospheres ... 164
7.2 Impedimetric Analysis of Cardiospheres in Absence of Extracellular Calcium ... 168
7.3 Impedimetric Investigation of the Spheroid Response to the Gap Junction Blocker 1-Heptanol ... 172
7.4 Measurement of the Spheroid Response to the Beta-Adrenergic Agonist Isoprenaline ... 175
7.5 Discussion ... 178
7.5.1 Characterization of Cor.At® Cardiospheres ... 178
7.5.2 Impact of Extracellular Ca2+ Deprivation on Cardiospheres .. 179
7.5.3 Impact of 1-Heptanol on Cardiospheres... 181
7.5.4 Impact of Isoprenaline on Cardiospheres ... 182
8 Impedimetric Model Studies of Embryonic Bodies ... 185
8.1 Characterization of Embryonic Bodies from P19 Cells With and Without Differentiation Factors ... 186
8.2 Impedimetric Analysis of Undifferentiated and Differentiation- Induced Embryonic Bodies ... 192
8.2.1 EIS Study with Embryonic Bodies Grown in Non-Adhesive Petri Dishes ... 192
8.2.2 EIS Study of Embryonic Bodies Grown in Hanging Drops .... 195
8.2.3 EIS Analysis of Embryonic Bodies Grown in the 96-Well Plate ... 197
8.3 Discussion ... 201
8.3.1 Characterization of Embryonic Bodies ... 201
8.3.2 Impedimetric Analysis of Embryonic Bodies Grown in Non- Adhesive Petri Dishes and Hanging Drops ... 204
8.3.3 Impedimetric Analysis of Embryonic Bodies Grown in the 96-Well Plate ... 205
9 Summary ... 207
10 Zusammenfassung ... 209
11 Outlook ... 211
12 References... 213
13 Appendix ... 231
A1 Abbreviations and Symbols ... 231
A2 Supplementary Figures and Tables ... 237
A3 Materials and Instrumentation ... 243
A4 Software ... 246
The understanding of the development, function and pathology of tissues and organs is a fundamental human effort. Initially, there have been two model systems mimicking in vivo human tissues - the in vivo animal model system and the in vitro two-dimensional cell culture. While cell monolayers exhibit a comparatively low complexity and less similarity with real tissue, animal models are highly complex. To date animal testing is extensively applied in biomedical research (e.g. stem cell research, genome research, preclinical drug testing).
Statistics of the German Federal Ministry of Food and Agriculture show that the total number of animals used for scientific purposes was constantly increasing with ~ 1.8 Mio in the year 2000 to ~ 3.1 Mio in 2012. Only since 2013 the number is slightly decreasing (appendix A2, Fig. S1). In this context, it seems mandatory to pursue the reduction, refinement and replacement of animal testings (the so called “3R”). Reduction and replacement can be achieved with cell culture based testings. Beside 2D cell culture another more recent approach is the application of in vitro 3D tissue models. With their intermediate complexity they bridge the gap between traditional cell culture and animal models. In this chapter 3D tissue models are introduced, giving first a brief overview of the different types of 3D models. As this thesis is focused on multicellular spheroids, their structure, formation and application in research are highlighted in subsequent paragraphs.
Then, 3D culture is compared to 2D cell culture with regard to their application in biomedical research. Finally, common analytical techniques are presented that are used to monitor the response of cells within multicellular spheroids. In this context, special emphasis is placed on devices based on electrochemical impedance spectroscopy (EIS) that have been developed in the last years.
1.1 Multicellular Spheroids as 3D Tissue Models
1.1.1 Three-Dimensional Cell Culture Models
Three-dimensional cell culture models with their intermediate complexity became an emerging cell-based model system in recent years. For this reason, 3D models using different structural concepts have been developed over time. There are for example microcarrier cultures, spherical monolayered cysts, artificial skin, organotypic explant cultures or multicellular spheroids (Pampaloni et al., 2007).
These models are introduced in brief below.
The microcarrier culture is a technique where anchorage-dependent cells adhere and grow upon the surface of small spherical particles in suspension (Van Wezel, 1967). The microcarriers can be porous or non-porous in nature, made from biocompatible materials like cross-linked dextran, collagen, gelatin, polystyrene, cellulose or glass (Kadouri, 1994). Different cell lines are described to grow on microcarriers for different applications. For example epithelial cells were cultured this way to study epithelial functions (Jakob et al., 2016) or infection (Carterson et al., 2005). Also human mesenchymal stem cells with the ability to differentiate into osteoblasts, adipocytes and chondrocytes have been cultured on microcarriers (Petry et al., 2016). Due to their multipotency they are considered as an important tool in regenerative medicine. Since high amounts of these cells are needed for clinical use the microcarrier-based stirred tank bioreactor process turned out to be an appropriate propagation technique.
The so-called cysts are spherical monolayers of polarized cells enclosing a central lumen. In organisms they are present in different kinds of tissue. In the mammary gland they are found as acini, in the lung as alveoli or in the thyroid as follicles (O'Brien et al., 2002). Epithelial cells that can form a self-enclosed monolayer are Madin-Darby Canine Kidney (MDCK) cells when embedded in a collagen matrix. The cells in the monolayer show three types of membrane surfaces. These are the apical surface next to the lumen, the lateral surface between neighboring cells and the basal membrane that adheres to the extracellular matrix (Rehder et al., 2006). Cysts are appropriate models to study the factors leading to cyst formation and expansion (Buchholz et al., 2011;
Buchholz et al., 2013; Yuajit et al., 2013) and the establishment of apico-basal
polarity in epithelial cells as well as the tight junction integrity (Rehder et al., 2006).
A more complex epithelial structure is the artificial skin used for example as graft especially for burn treatments. Here, primary fibroblasts are cultured in a petri- dish before they are seeded onto a biodegradable fibre mesh. After a few weeks in culture, keratinocytes are seeded above the new dermal tissue in order to form an epidermal layer (Horch et al., 2005). The approach to generate a skin substitute by combining these two cell types and extracellular matrix components is very promising and might become a good alternative to autografts (Chua et al., 2016). Furthermore, artificial skin is used as alternative to animal testings for the assessment of skin irritations, corrosiveness, phototoxicity and genotoxicity of a variety of reagents e.g. in the cosmetic industry (Brohem et al., 2011). Other applications are the use as photoaging model, in drug penetration studies or for the skin cancer and skin disorder research (Brohem et al., 2011)
Organotypic explant cultures offer the highest complexity among the examples in this chapter. They use dissected organ slices which are typically cultured on porous membranes at the liquid-air interface (Stoppini et al., 1991), on multielectrode array structures (Berdichevsky et al., 2009), or as minced tissue embedded in 3D collagen gels (Toda et al., 2002). Since they preserve the tissue architecture of the original organ they are valuable 3D models for pharmacodynamic profiling of human tumors (Vaira et al., 2010), for the investigation of fetal testis development (Livera et al., 2006) or the study of brain physiology and neuronal activity (Holopainen, 2005; Berdichevsky et al., 2009).
Another 3D model with intermediate complexity is represented by multicellular spheroids. These are spherical cell aggregates formed by a few hundred to several thousand cells resulting in spheroid diameters of a few hundred micrometers. The intercellular spaces are filled with extracellular matrix.
Spheroids can be prepared from many different types of cell lines using a variety of formation techniques (for detailed information see chapter 1.1.2). It is also possible to generate co-culture spheroids from two different cell lines that model the cellular heterogeneity of tumors very well. The most important application of spheroids is their use in therapeutically oriented biomedical studies and (high- throughput) drug screening (for detailed information see chapter 1.1.4). Since this
thesis is focusing on the work with multicellular spheroids they are introduced in detail in the following chapters.
There is a variety of scientific problems and questions in the biomedical field that promoted the development of different three-dimensional cell cultures with different levels of complexity. Following the special demands in the respective research fields they were created as cellular aggregates, cellular multilayers or spherical monolayers and have proven to be valuable tools. Especially multicellular spheroids show a high diversity regarding the high number of cell lines that can be used and the formation techniques that have emerged for numerous applications.
1.1.2 Spheroid Formation Process and Techniques
The first researchers who reported about the formation of cellular aggregates in suspension were Holtfreter (1944) and Moscona (1952). Since then multicellular spheroids have been generated from several cell lines using different techniques.
All of them are based on the common principle to prevent cell attachment to the culture substrate. In this way, the cell-cell interaction is promoted and three- dimensional aggregates are formed.
The mechanism of spheroid formation can be regarded as a three-step process (Lin et al., 2006). In the first phase suspended cells, typically several hundred / thousand cells form a loose aggregate. This process is promoted by the secretion of long-chain extracellular matrix (ECM) fibers like collagen or fibronectin and a high expression of integrins leading to subsequent integrin-ECM adhesion and consequently to the attachment of neighboring dispersed single cells (Robinson et al., 2004). This phase is followed by a delay period where no morphological changes are observed (Lin et al., 2006). During this delay period the cells express and accumulate E-cadherin. Finally, the compaction of the cell aggregate to a spheroid with strong cell-cell adhesions is proceeded by homophilic interaction of the previously produced E-cadherins between adjacent cells (Ivascu and Kubbies, 2007). In this process the cells on the surface of the aggregate undergo a specific differentiation to smooth, tightly packed polarized
cells that act like a physical barrier very similar to epithelial cells (O'Brien et al., 2002).
In order to generate spheroids several techniques have been developed. In the following, a brief overview of the most common formation techniques is given.
In the liquid overlay culture spheroids are formed by seeding cells on a non- adhesive surface. This can be prepared by coating petri dishes or 96-well plates with agarose or hydrophobic polymers like poly(2-hydroxyethyl methacrylate) (poly-HEMA) (Lin and Chang, 2008). Meanwhile, petri dishes and microplates with non-adhesive coating are also commercially available (ultra-low attachment plates). While spheroid formation on non-adhesive petri dishes produces generally spheroids with a broad size distribution and irregular shape, the formation in coated 96-well plates yields spheroids with a defined cell number in a reproducible size with the formation of one spheroid per well. In order to enhance cell aggregation, centrifugation (Ivascu and Kubbies, 2006; Laurent et al., 2013) or orbital shaking (Frankel et al., 2000; Ong et al., 2010) after cell seeding can be applied. The liquid overlay technique is often used by researchers because it is cheap, simple to perform without the requirement of sophisticated equipment and with the option for scale up (Lin and Chang, 2008;
Nguyen et al., 2016).
The hanging drop technique generates spheroids in a microgravity environment.
For this purpose, the cell suspension is seeded in drops of 15 – 40 µL upon the inner side of the lid of a petri dish. Then, the lid is inverted and placed back on the petri dish that is generally filled with buffer to prevent evaporation of water from the hanging drops. The surface tension holds the hanging drops in place and the microgravity causes concentration and aggregation of the cells at the liquid-air interface. This technique provides a cost-efficient, simple and reproducible generation of spheroids. The medium exchange however, is complicated (Nguyen et al., 2016) and microscopic observation is difficult using inverted microscopes. Nevertheless, this technique has been improved over the last years in order to overcome some of the above mentioned drawbacks. To be applicable to high-throughput screening hanging drop arrays were developed where up to 384 uniform spheroids can be formed in parallel, cultured for long time and applied to drug testing using liquid handling robots and plate readers
(Tung et al., 2011). Multi-well arrays suitable for the hanging drop approach are also commercially available (InSphero AG, 3D Biomatrix). Furthermore, the hanging drop formation has been combined with fluorescence-activated cell sorting and microfluidic devices enabling perfused culture and easy drug application providing a promising technology for body-on-a-chip research (Frey et al., 2014; Birchler et al., 2016).
Spheroid formation can be performed also in 3D microwells with a defined size.
These are fabricated from non-adhesive inert materials like agarose, polyacryl- amide gels (Achilli et al., 2012) or poly(dimethylsiloxane) (PDMS) (No et al., 2012), which are polymerized in a mold. A more complex preparation is the fabrication of micromolds in combination with microchannels prepared from poly(methyl methacrylate) (PMMA) using a programmable micromilling system and bonding by press heating (Fukuda and Nakazawa, 2011). After cell seeding spheroids are formed with a diameter that depends on the dimensions of the microwell, thereby guaranteeing defined spheroid size and geometry (Karp et al., 2007). The fabrication of the micromolds however, requires specialized facilities (Lin and Chang, 2008).
Porous scaffolds provide a three-dimensional ECM-mimicking environment and structural support for tissue engineering especially with achorage-dependent cells that require attachment for optimal viability and function (Athanasiou et al., 2013).
The fabrication of such scaffolds can be realized with a variety of possible materials. In order to resemble the natural ECM as much as possible, one should choose biocompatible and biodegradable naturally derived matrix materials like collagen, fibronectin, Matrigel (extract from Engelbreth-Holm-Swarm mouse sarcoma, rich in ECM proteins), gelatin, alginate or chitosan (Rijal and Li, 2016).
There are also synthetic materials like polycaprolactone (PCL), poly(lactic-co- glycolic acid (PLGA), poly(ethylene glycol) (PEG) and others that have proven to be applicable (Rijal and Li, 2016). Scaffolds can be adapted to the needs of different cell lines by regulating solubility, stiffness, porosity and size during chemical and physical processing (Athanasiou et al., 2013). However, scaffolds from some materials are reported to alter the phenotype of cells (Levy-Mishali et al., 2009) and to produce toxic degradation byproducts with the potential for scaffold-based immunogenicity (Anderson, 2001).
Rotary bioreactors are the method of choice to prepare spheroids in large
quantities (Lin and Chang, 2008). Typically, spinners flasks (Korniski et al., 1999;
Wartenberg et al., 2001) or roller bottles (Song et al., 2004) with surface treatment are used for spheroid production (Bilodeau and Mantovani, 2006). This way, spheroids can be formed easily by continuous moving fluid with dynamic control of culture conditions and the option for long-term cultivation. The spheroid size can be influenced by the cell seeding density, the medium composition and the spinning rate as well as the culture time. On the other hand expensive specialized equipment is needed, the generated spheroids show a hetero- geneous size distribution (Lin and Chang, 2008) and the technique is very labor- intensive (Nguyen et al., 2016).
All in all, many spheroid formation techniques have been developed to date. The selection of a method is dependent on different criteria that determine the applicability for a certain field of research. For some applications it is important to generate a high number of spheroids, others prefer a uniform size. Other factors are the production efficiency and convenience as well as the possible damage or influence on the spheroid physiology. Of course also the laboratories’ conditions and available financial resources have to be considered for the choice of a spheroid formation technique (Lin and Chang, 2008).
1.1.3 Microenvironment of Spheroids and Multicellular Resistance
Multicellular spheroids are avascular tissue models. For large spheroids with diameters above a certain threshold microenvironmental changes occur due to inexistant vascularity (Sutherland, 1988). As a result, gradients of important metabolites like oxygen (Mueller-Klieser, 1984), glucose, lactate (Curcio et al., 2007) and other nutrients, hormones and growth factors are observed. While the spheroid lacks these substances due to their insufficient penetration, toxic metabolic wastes accumulate inside the spheroid ultimately leading to the formation of a concentric heterogeneous microenvironment in the spheroid. At the periphery of the spheroid proliferating viable cells are present while in an intermediate zone viable but quiescent cells can be found. The core of such spheroids is composed of necrotic cells (Mueller-Klieser, 1997; Nguyen et al., 2016). The distance from the spheroid surface at which necrosis arises can vary
for different cell lines, seeding densities and growth conditions. It is also assumed that the development of necrosis is related to a combination of several factors like hypoxia, low pH, lack of nutrients and waste accumulation. Some cells, however, are able to adapt to the insufficient supply (O2, nutrients) and reduce their metabolic turnover rates, consequently decreasing the steepness of the gradients (Mueller-Klieser et al., 1986; Sutherland et al., 1986). Very similar microenvironmental characteristics can be found also in in vivo tumors, making the spheroids an appropriate model system to investigate cancer therapy.
A phenomenon, which is also often observed in tumors and spheroids likewise is the multicellular resistance (MCR). It was first described by Durand and Sutherland (1972) who observed that cells in a multicellular spheroid were more resistant to radiation damage than single cells. They linked this to an enhanced repair capability of cells cultured with a high number of intercellular contacts.
Several years of experiments confirm these assumptions. MCR is observed for cancer as well as some normal cells cultured as spheroids with a high degree of cell-cell and cell-extracellular matrix contacts and the typical microenvironment with quiescent and necrotic cells (Desoize and Jardillier, 2000). It has been shown that the resistance to anticancer drugs is induced within 24 h after cell seeding and increased for spheroids with progressive establishment of the typical microenvironment (Olive et al., 1991). However, MCR is reversible when the spheroid is disaggregated. There are two supposed types of MCR mechanisms, the contact resistance due to cell-cell contacts (like in confluent monolayer culture) and the resistance based on the heterogeneous three-dimensional structure. Both are partly related to an altered gene expression that can lead to the inhibition of apoptosis, the efflux of drugs or to a cell cycle arrest.
For instance, 51 integrin is a membrane protein that mediates cell adhesion to the ECM. Integrin-mediated cell-attachment is important for cell survival since loss of attachment provokes apoptosis, a process named anoikis. 51 integrin is reported to suppress apoptotic cell death by activating downstream survival pathways like the Bcl-2 pathway and thereby inhibiting drug-induced apoptosis in confluent cells and spheroids (Zhang et al., 1995; Nista et al., 1997; Aoudjit and Vuori, 2001; Casey et al., 2001; Weaver et al., 2002).
The multidrug resistance protein 1 (MDR1) protects organs from toxic substances
by an energy-dependent efflux. This protein is over-expressed in many types of cancer cells leading to the efflux of chemotherapeutic agents, whereas knockdown of MDR1 in 3D cell cultures increased chemosensitivity (Liang et al., 2016). It is assumed that E-cadherin also contributes to MDR1 related MCR. As a member of the cadherin family it plays an important role in mediating cell-cell anchoring junctions. A study revealed that the knockdown of E-cadherin led to a decrease in the MDR1 protein, suggesting an E-cadherin dependent regulation of MDR1.
Several antitumor agents are targeted on the inhibition of cell growth and division.
The effectiveness of these therapeutic agents is dependent on the rate of cell proliferation. It was found out that cancer cells in tumors show low proliferation rates and thus the effectiveness of cell-cycle dependent antitumor agents was reduced (Croix et al., 1996). This effect was investigated by studying the expression of the protein p27Kip1, which is a known inhibitor of the cyclin- dependent kinases (Cdks). By inhibition of Cdks p27Kip1 regulates the progression from G1 to S phase. Compared with monolayer cells, spheroids showed an upregulated expression of p27Kip1 and an increased number of cells in the G0-G1 phase, whereas the number of cells in S and G2-M phase was decreased. When spheroids and monolayer cells were treated with chemotherapeutic agents the spheroids showed a higher resistance to the drugs than the monolayer cells. However, a down regulation of p27Kip1 in spheroids reduced the intercellular adhesion, increased the cell proliferation and restored the drug-induced cell cycle perturbations (Croix et al., 1996; Xing et al., 2005).
Besides alterations of gene expression another factor that is linked to MCR is the cell kinetic phenomenon of regrowth resistance, as found in cancer patients and spheroids. When spheroids are treated by radio- or chemotherapy the viable proliferating cells on the surface are dying. Subsequently, this damage is compensated by recruiting quiescent cells to return to cell cycle and resume growth (Olive and Durand, 1994; Sham and Durand, 1998; Tan et al., 2015).
Furthermore, the limited drug distribution in in vitro cancer spheroids and in vivo solid tumors plays a role in MCR. These tissues are mostly avascular or distant from blood vessels (in the case of in vivo tumors) and therefore not each cancer cell in the tumor is evenly exposed to the drug (Tannock et al., 2002). Also the
composition and structure of the ECM as well as the microenvironment in the tissue can slow down the diffusion of drugs and lead to gradients. The penetration efficiency is also dependent on the drug itself. Physico-chemical properties like the molecular weight, shape, charge and the drug’s solubility influence the penetration as well as its availability and flux inside the tissue.
Cellular metabolism, binding and enclosure in endosomes can increase the drug concentration in the outer layers of the tissue and prevent further drug pene- tration (Minchinton and Tannock, 2006). Limited penetration is for example reported for doxorubicin and mitoxantrone due to their sequestration in acidic endosomes and their binding to DNA (Lankelma et al., 1999; Desoize and Jardillier, 2000; Cowan and Tannock, 2001; Tannock et al., 2002).
A number of mechanisms and structural characteristics in tissue models can lead to multicellular resistance and only a few have been introduced in brief in this section. However, it can be stated that MCR is a serious problem in cancer therapy which needs more investigations and the development of techniques to overcome MCR. The fact that multicellular spheroids exhibit a high resemblance to in vivo solid tumors including MCR makes them an appropriate 3D model for their investigation.
1.1.4 Applications
Multicellular spheroids are versatile models for different fields of research for example in medicine, basic research and application-oriented approaches.
Tumor spheroids, an often used type of spheroids, are generally applied as tumor tissue models in drug screening, pharmaco-dynamics and related topics like the investigation of multidrug resistance or multicellular resistance which is further specified with examples from literature in the next passages.
Especially the combination of spheroid formation, culture and subsequent drug testing on specialized platforms / devices is very popular among researchers. A current report describes the testing of eight clinically used antitumor agents (capecitabine, 5-fluorouracil, irinotecan, oxaliplatin, cetuximab, panitumumab, bevacizumab, regorafenib) for colon cancer using colon cancer spheroids in comparison to a mouse model (Yoshii et al., 2016). The spheroids were prepared
on a nanoimprinted microplate from red fluorescent HCT116 cells. The drug 5- fluorouracil (5-FU), which is commonly used for chemotherapy with only limited efficiency (de Vos tot Nederveen Cappel et al., 2004), was used as a reference.
The study revealed that regorafenib was the most efficient drug against the tumors in vitro. This observation was also confirmed by the in vivo model treatment. The drug inhibited the tumor growth significantly compared to the untreated control and the 5-FU reference and is therefore recommended for further preclinical and clinical studies.
Another group developed a 384 hanging drop array which is used to form and culture spheroids from different cell lines (kidney fibroblasts, embryonic stem cells and epithelial carcinoma cells) (Tung et al., 2011). After formation, the epithelial carcinoma spheroids were used for drug sensitivity testing in the array applying different concentrations of tirapazamine (TPZ) or 5-FU. This 3D model system was able to show that 5-FU, which inhibits proliferation, was not efficient in reducing the viability of the cancer spheroids. TPZ, on the other hand, is a hypoxia-triggered cytotoxin that causes DNA damage and led to increased reduction of viability in the same kind of spheroids. A combined treatment though, showed an additive effect since the mechanisms of action complemented each other. While 5-FU acted on the proliferating cells in the spheroid periphery, TPZ killed the cells in the hypoxic core of the spheroid.
The work of Zhang et al. (2005) describes the formation of microencapsulated spheroids from MCF-7 breast cancer cells for screening of the anticancer effect of mitomycin C (MC), adriamycin (ADM) and 5-FU with monolayer cultures as control. The results show that MC induces the highest cytotoxicity in spheroids and monolayers, followed by 5-FU and ADM. The authors were also able to demonstrate that all drugs which were applied to monolayer cells and spheroids (using the same concentration and incubation time) induced a higher cytotoxicity in the 2D cell culture. This result is consistent with several other studies where multicellular resistance was observed for spheroids (Desoize and Jardillier, 2000).
Lee et al. (2010) for example, investigated the chemoresistance of MCF-7 spheroids to 5-FU. While MCF-7 monolayer cultures and 6 d old spheroids without necrotic core showed drug induced apoptosis, 9 d old spheroids with a necrotic core exhibited a significantly reduced level of apoptosis. Furthermore,
the protein p53 which acts as tumor suppressor was found in an aggregated, inactivated form in spheroids with a necrotic core. Therefore, the results indicate that chemoresistance can be provoked by the necrosis-linked aggregation of p53.
Beside the assessment of drug efficiency, spheroids can be used also for cyto- toxicity testing after treatment with radiation and / or hyperthermia (Asayesh et al., 2016; Mahdavi et al., 2016) as well as potential toxins like chemical compounds (Lee et al., 2016) or nanoparticles (Lee et al., 2009; Senyavina et al., 2016).
More frequently however, spheroids are used to investigate differentiation as well as cell-cell and cell-ECM interactions in a three-dimensional architecture.
Differentiation was for example studied by Hildebrandt et al. (2010) who monitored the osteogenic differentiation of spheroids from human mesenchymal stem cells. Another cell line, which is very popular among researchers in this field are P19 embryonic carcinoma stem cells which are able to undergo neuronal or cardiac differentiation in the form of embryonic bodies. Several groups were investigating the influence of different induction reagents and experimental parameters on differentiation (Yang et al., 2009; Jasmin et al., 2010) as well as the mechanisms behind this process (Gao et al., 2001; van der Heyden and Defize, 2003).
A prerequisite for differentiation as well as maintenance of tissue architecture and function are cell-cell interactions. Co-culture spheroids from two or more cell lines represent a model system with high complexity which can be used to study heterotypic intercellular cross-talk and its consequences. Using co-cultures, Achilli et al. (2012) investigated the kinetics and extent of self-sorting of a mixture of different cell types. This is a natural process that is known for example during embryogenesis, morphogenesis or cancer metastasis (Duguay et al., 2003). The differential adhesion hypothesis (DAH) tried to explain this phenomenon by assuming that different cell types express different surface adhesion molecules with cohesive or adhesive forces. These lead to the sorting of cells with high cohesion in the core and of cells with low cohesion on the outside (Foty and Steinberg, 2005). The group around Achilli seeded a mixture of human fibroblasts (NHF) and hepatocyte cells (H35) and observed the formation of spheroids with NHF cells in the core and H35 in the shell. They were also able to determine
parameters like the rate and extent of self-sorting as well as the time to reach 50 % sorting.
Furthermore, co-cultures have been used extensively to study the enhancement of liver-specific functions of hepatocyte spheroids (Lin and Chang, 2008). Tissue- specific functional maintenance was increased in co-cultures of hepatocytes in combination with either fibroblasts (Lu et al., 2005), or pancreatic islet cells (Lee et al., 2004), or bone marrow cells (Murakami et al., 2004) or adipose-derived stem cells (No et al., 2012). Spheroids with hepatic function are valuable models for investigations on liver physiology and may serve as sources for human liver transplantation or cell therapy in the future. They have been also incorporated successfully in bioartificial liver devices (Figaro et al., 2015). This is basically a bioreactor containing a high number of functional hepatocyte spheroids providing an extracorporeal liver support device.
In further medical approaches, spheroids can serve as building blocks for organ reconstruction in tissue engineering. Spheroids have been already used for the replication of several complex tissues like liver, cartilage, pancreas, cardiac muscle, pituitary gland, the optic cup or bone tissue (Lin and Chang, 2008;
Fennema et al., 2013). Another approach is the vascularization of tissue (Kelm and Fussenegger, 2004) or bone models (Rouwkema et al., 2006). In this process prevascular structures develop within another tissue (in situ) or together with a tissue model (in vitro). This can be achieved in different ways, for example by the generation of spheroids from a mixture of endothelial cells and tissue- specific cells. Over time a dense network of vessel-like structures develops within the spheroid. This prevascularization enables a better integration in the host by improving oxygen and nutrient distribution and consequently the survival of the implant (Fennema et al., 2013; Laschke and Menger, 2016).
As could be demonstrated, multicellular spheroids have numerous applications in fundamental application-oriented biomedical research. The great suitability of spheroids as in vitro models is based on their three-dimensional architecture with cell-cell and cell-ECM interactions as well as their microenvironment.
Furthermore, the formation of spheroids is, in most cases, easy and inexpensive using standardized formation protocols and commercially available growth substrates.
1.2 2D Versus 3D Models
In the preceding chapters characteristics and applications of three-dimensional models, in particular multicellular spheroids were presented. An alternative to 3D in vitro models is the use of two-dimensional cell cultures. A huge number of studies using standard 2D cell culture have produced important conceptual advances. In 2D the cells of interest are simply cultured on flat polystyrene substrates to generate a well-controllable and homogeneous cell environment.
Medium changes and microscopic analysis can be performed easily and the cell proliferation can be sustained for most cell lines by regular subculturing (Fennema et al., 2013). Cell-based assays using 2D models belong to the key tools in basic research and drug discovery. Although, 2D cell culture was helpful to get an impression of tissue function and mechanistic processes, the 2D approach is not able to reflect in vivo tissue characteristics and substitute 3D cultures (Hirschhaeuser et al., 2010). Cells grown on 2D substrates differ from 3D cultures in morphology, cell-cell and cell-matrix interactions and differentiation (Yamada and Cukierman, 2007). Due to the unnatural microenvironment of 2D cultures phenomena like multicellular resistance is not typical for these cells (Desoize and Jardillier, 2000). This can lead, especially in drug discovery, to wrong test outcomes. In the following, the differences between 2D and 3D cell cultures are illustrated in more detail by giving some examples from literature.
When fibroblasts are cultured in 2D or 3D they differ in morphology and cytoskeletal organization. It is reported that when fibroblasts grow on a flat substrate the cells flatten, form stress fibres and become immotile. In contrast to fibroblasts in 3D culture that elongate, are mobile and show an actin cortex and extended filopodia similar to the in vivo situation (Walpita and Hay, 2002;
Grinnell, 2003). This effect is also observed for primary articular chondrocytes or hepatocytes. When these cells are taken out of the body and cultured on flat substrates they tend to lose their normal phenotype. This effect is, however, reversible by culturing these cells in 3D (von der Mark et al., 1977; Bierwolf et al., 2011).
As an alternative to a whole liver transplantation single hepatocytes can be transplanted. The 2D mature cells, however, lose their differentiation and proliferation capabilities after transplantation. Li et al. (2010) showed that
multipotent mesenchymal stem cells grown in 3D were able to differentiate into hepatocytes which exhibit and maintain more liver-specific functions, like albumin and urea synthesis or the clearance of ammonia and drugs, in comparison to 2D cultured hepatocytes.
Li et al. (2008) characterized the human hepatoma cell line HepG2 in 2D and 3D cell cultures.They reported that spheroids in comparison to monolayer cells showed a higher level of cell-cell adhesion and a greater fraction of cells in G1 phase cell cycle arrest. Spheroids were less apoptotic under regular culture conditions and more resistant to drug-induced apoptosis. Furthermore, protein levels of E-cadherin, cytochrome-c, endostatin and others were increased in spheroids. Their conclusion was that 3D cultures should be preferred over 2D cultures in cancer biology investigations.
Desoize and Jardillier (2000) investigated multicellular resistance (chapter 1.1.2).
The group determined the EC50 values of five anticancer drugs on human lung cells (A549) cultured as monolayer and as spheroid. The EC50 values of spheroids were throughout higher than those of monolayer cells. For spheroid treatment the drug concentration had to be increased, dependent on the drug, by a factor of ~ 10 to ~ 1000. They state that for anticancer drug screening spheroids rather than monolayer cells should be used.
Several studies followed in which the drug response of spheroids and cell monolayers from different cell lines was compared. Horning et al. (2008) reported that MCF-7 cells in 3D culture were more resistant to typical anticancer drugs (doxorubicin, paclitaxel, tamoxifen) than in 2D culture, with a 12- to 23-fold difference in the EC50 values. The group showed that spheroids express two times more collagen than monolayer cells pointing to the ECM as a barrier to drug diffusion. The expression of many genes differed significantly for both model systems. Similar results for MCF-7 cells have been reported by Zhang et al.
(2005) and Lee et al. (2010).
Summed up, when 2D and 3D cell cultures are compared they differ significantly in biological functions like the cell shape, gene expression, growth behavior, morphogenesis and differentiation (Yamada and Cukierman, 2007). As literature demonstrates, 3D cell cultures are the model system which resembles in vivo tissue much better than monolayer cells. Therefore, researchers in the field of
biomedical science prefer 3D tissue models with their intermediate complexity over 2D cell monolayers.
1.3 Analytical Techniques to Study 3D Tissue Models
For 2D cell cultures many well-established analytical techniques are available, ranging from methods for cell staining over cell viability assays to biophysical detection methods such as flow cytometry. These methods have proven also applicability for 3D cell cultures (Tab. 1). Sometimes the protocols have been modified to comply with the requirements of 3D models using increased dye / reagent concentrations or longer incubation times. In some cases the spheroids needed to be dissociated or mechanical sections had to be prepared. Meanwhile, there is an increasing awareness in life science companies to offer optimized protocols and reagents for spheroids in the field of cell viability assays (e.g. the ATP assay CellTiter-Glo® 3D by Promega).
Tab. 1: Overview of techniques for 3D cell culture analysis. Different methods are shown together with their information content and some remarks on preparational steps and references.
Method Specification* Information Content
Remarks on Sample Preparation
References
Microscopy SEM TEM
Visualization of morphology, internal cellular structure
Cross-linking, dehydration, freezing or embedding, mechanical sectioning
Li et al. (2008);
No et al. (2012)
CLSM 2P Mic.
SPIM
Visualization and localization of internal structures
Optical sections, labeling
Wartenberg and Acker (1995);
Thurber and Wittrup (2008);
Lorenzo et al.
(2011) Cell Staining Live/Dead
Lucifer Yellow Ho/Pi
H&E
Immunostaining
Visualization of cell viability and morphology;
localization of proteins
Labeling, Cross-linking, mechanical sectioning
Wartenberg et al. (2001); Lee et al. (2010); No et al. (2012);
Laurent et al.
(2013)
DNA-Analog Labeling
BrdU Assay EdU Assay TUNEL Assay
Cell proliferation, Cell cycle kinetics Detection of DNA fragmentation – a hallmark of late apoptosis
Cryosectioning, cross-linking, permeabilization, labeling
Zhang et al.
(2005); Laurent et al. (2013) Kotov et al.
(2004);
Bartholomä et al. (2005) (Colorimetric)
Cell Viability Assays
MTT LDH Presto ATP Assay
Quantification of cell viability, cell proliferation, cytotoxicity
Labeling Cell lysis
Lee et al.
(2009); Lee et al. (2013); Frey et al. (2014)
Flow Cytometry Cell counting,
sorting and
biomarker detection
Labeling, spheroid dissociation
Khaitan et al.
(2006); Li et al.
(2008);
Weiswald et al.
(2010)
* Abbreviations used in the column Specification are given in the appendix A1.
Although, these methods feature a high information content and good results they are either invasive, need labels or continuous observation, which is very time consuming or not intended (endpoint assays). An alternative to these techniques represents EIS that is non-invasive, label-free and enables continuous monitoring (details about the theoretical background of EIS are given in chapter 3.1). In this context, electric cell-substrate impedance sensing (ECIS) is an established technique for 2D cell culture analysis (chapter 3.3). For 3D cell culture, however, there are only a few devices which were developed for this purpose over the last years.
Most reports on the development and usage of devices for EIS measurements of spheroids have been published by the group around Andrea Robitzki. Their objective was to develop an efficient biomedical screening method based on EIS and 3D cell cultures. In 2001 they published reports on two devices for 3D analysis based on different concepts. One device was constituted by a glass capillary system with four platinum wire electrodes (Thielecke et al., 2001). The capillary (inner diameter: 400 µm) had funnel shaped ends that were bonded to glass tubes. On both sides of these tubes two holes were drilled respectively for the insertion of the electrodes. The capillary was filled with culture medium and
the spheroid was positioned in the center of the capillary using a pump. A sinusoidal current was applied via the two outer electrodes and adjusted to measure a voltage drop of 10 mV across the inner electrodes. Using this setup, they were able to distinguish impedimetrically between control tumor spheroids and spheroids with manipulated genes resulting in decreased growth and increased necrosis. In subsequent reports the same setup was successfully applied for the impedimetric measurement of physiological alterations in spheroids after gene modification and drug application (Bartholomä et al., 2005).
Furthermore, this setup was used for the EIS-based detection of osteogenic differentiation of mesenchymal stem cells (Hildebrandt et al., 2010).
The other device comprised an array with planar circular gold electrodes and iridium microring electrodes (Thielecke et al., 2001). The positioning of spheroids on the planar electrodes was performed using a micromanipulator and a microscope. They also developed a simplified equivalent circuit model and an appropriate transfer function for data fitting. Using a three-electrode arrangement they conducted proof-of-concept experiments investigating the effects of Triton X- 100 and DMSO on tumor spheroids (T47D clone 11 human breast carcinoma cells) covering the electrodes. The results show that in the frequency range between 50 kHz and 500 kHz they were able to measure a spheroid-related decrease in impedance originating from morphology changes after treatment with the reagents. In the conclusion they already describe how an optimized array with cavities around the electrodes and micro-holes for suction-controlled spheroid positioning should be constructed.
This vision was in fact realized a few years later with the development of their microcavity array (MCA) for drug testing (Kloss et al., 2008). This setup includes 15 square microcavities with different widths (200, 300 and 400 µm) for spheroids with different diameters and a depth of 100 µm. Each of the four sides of a cavity holds a rectangular gold electrode. Positioning of spheroids into the cavities was performed using a micropipette or a micromanipulator and was controlled via light microscopy. For all cavity sizes a difference in impedance magnitude was observed for electrodes with or without spheroids. Using this impedance-based setup the group published two reports in 2008. In one report they compared impedance spectra of spheroids from five different cell types as well as zeolith
and glass beads as inorganic spherical models. Furthermore, they determined the effect of various anti-tumor drugs on spheroids (Kloss et al., 2008). In another report they investigated the effect of the apoptosis inducing agent camptothecin (CTT) on human melanoma spheroids and monitored the contractions of cardiomyocyte spheroids by recording of extracellular potentials with the setup (Kloss et al., 2008). Although the MCA chip was in principle applicable to measure impedimetric changes resulting from morphology alterations in spheroids, they had to cope with high signal to noise ratios and a high impedance variance for spheroids of the same size. For this purpose, the MCA chip was optimized by broadened circuit paths, an increased electrode size, a thicker passivation layer and advanced automatic data processing resulting in an increase in chip sensitivity (Krinke et al., 2010). Further optimization was realized by incorporation of a suction hole in the cavity bottom for automated positioning (Jahnke et al., 2013). Applying this improved MCA chip impedance measurements were performed on brain tumor cultures for drug efficacy testing (Eichler et al., 2015).
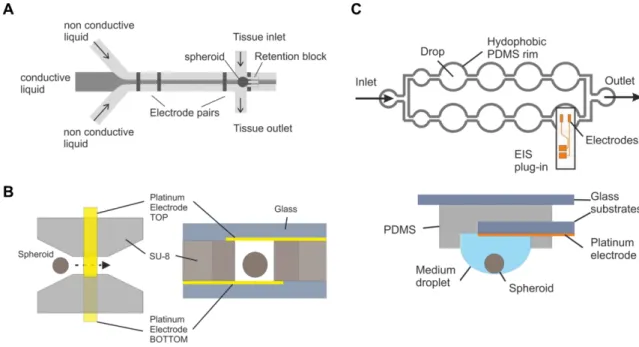
The group around Olivier Frey is also working on the development of smart impedance-based devices for spheroid analysis. His team presented different concepts for devices in the last years. One design comprises a microfluidic chip that enables retention, cultivation and continuous analysis of spheroids (Schumacher et al., 2011). As can be seen in Fig. 1 A the spheroid is loaded from the side and is trapped in the main channel at a PDMS retention block. Two planar platinum electrodes are located close to the trap and two other electrodes are further upstream. For increased EIS resolution hydrodynamic focusing can be applied using three independent inlets upstream in the main channel. A conductive liquid in the middle and two non-conductive liquids on the sides generate a liquid sheet in the form of a vertical plane, which can be scanned precisely across the spheroid. This way, impedance spectra of defined cross- sectional areas of the spheroid can be recorded. They were able to demonstrate that spheroid trapping is reproducibly possible and a significant increase of impedance is measured after spheroid insertion. Results also prove that the sheath flow is adjustable, however, there is still a fraction of conductive liquid going also around the spheroid indicating that the system needs optimizations.
Another concept describes a microchannel prepared from SU-8 sealed with glass at the top and bottom (Bürgel, 2013) (Fig. 1 B). A spheroid is dragged by gravity through the channel with a cross-section of 500 x 500 µm2 and passes an electric field applied by a set of opposing platinum electrodes fixed on the top and bottom. It is stated that the flow-through approach leads to more consistent impedance signals when compared to systems with immobilized spheroids. This device was used to monitor the growth of spheroids and to demonstrate the effect of growth-inhibiting drugs like NaN3 on HCT-116 spheroids and Diclofenac on Hep G2 spheroids.
Fig. 1: Illustration of the impedance-based devices presented in the reports of Schumacher et al.
(2011) (A), Bürgel et al. (2013) (B) and Bürgel et al. (2015) (C). In A a microfluidic chip with a hydrodynamically focussed vertical sheet of conductive liquid is shown. In B the spheroid passes the electric field of two opposing platinum electrodes within a microchannel (left side: top view, right side: side view). The EIS measurement in C is performed with a removable EIS unit comprising a set of coplanar electrodes that is used as plug-in for a hanging drop network enabling spheroid formation and growth (top: top view, bottom: side view of drop nr. Eight with the EIS plug-in).
A third approach uses a hanging drop device with an exchangeable EIS plug-in (Bürgel et al., 2015). As shown in Fig. 1 C the hanging drop network contains eight spheroids in separate drops that are interconnected by microchannels. It is used to combine spheroid formation and microfluidic culturing in one platform.
The EIS plug-in consists of a glass substrate with a set of integrated coplanar
platinum microelectrodes. The plug-in is inserted in a recess between the drop and its PDMS substrate. Using this integrated device the group was able to characterize the beating of human cardiospheres optically and by EIS simultaneously. Furthermore, they observed an amplitude / frequency modulation upon a varied electrical stimulation of the cardiospheres.
Overall, there are few groups working on the development of devices for an impedance-based analysis of multicellular spheroids. The devices which were discussed above are promising, especially the MCA chip seems to be applicable for drug screening after years of device optimization. However, the presented devices show different disadvantages like high parasitic capacitances (Thielecke et al, 2001), high self-impedance of the device and high impedance variances for control spheroids (MCA device). Positioning of spheroids inside the device is sometimes impractical and requires microscopic monitoring (MCA). Most of the devices show a low impedance change upon spheroid addition into the measurement setup leading to a low sensitivity and require an optimization of the device.
2 Objectives
The motivation of this thesis was to develop an impedance-based device to quantify the dielectric properties of multicellular spheroids online in a non- invasive and label-free manner. Handling of the device and positioning of the spheroids should be straightforward. Ideally, the device enables simultaneous microscopic and impedimetric analysis of spheroids.
For this purpose, it was the aim to design and optimize a flow channel including an appropriate electrode layout using transparent electrode and channel material.
Three types of 3D tissue models - tumor spheroids, embryonic bodies and cardiospheres - should be cultured and characterized prior to their application in proof-of-concept studies using the novel flow channel for impedance measurements.
The impedimetric characterization of the flow channel with and without spheroid had to be demonstrated first, in order to optimize handling, experimental procedure and measurement parameters. Subsequently, basic correlations between spheroid size and resulting impedance values as well as reproducibility of impedance values upon measurement of one and the same spheroid should be established.
These preliminary experiments should be followed by model studies addressing the individual nature of the three different tissue models: (i) Investigation of tumor spheroid injury and death upon exposure to different invasive chemicals, hyperthermia and photosensitizers, (ii) changes in beating rate of cardiospheres upon exposure to pharmaceutical model substances, (iii) embryonic body differentiation into neurons or cardiomyocytes.
Finally, these results will provide a comprehensive overview of the performance and applicability of the novel impedimetric channel device in the study of 3D spheroid models.
3 Theoretical Background
3.1 Electrochemical Impedance Spectroscopy (EIS)
Impedance spectroscopy is a useful tool for the investigation of the electric properties of biological systems like cells. An alternating voltage of low amplitude is applied to the system at a given frequency. The resulting current is measured and converted to impedance according to Ohm’s law. Another approach, which is in use likewise is to apply an alternating current and measure the resulting voltage from which the impedance is calculated. EIS uses low amplitude signals, which makes the technique non-invasive to the cells under study. The data acquisition can be performed in real time with high temporal resolution, which makes EIS highly informative for dynamic systems (Lvovich, 2012). Besides bioanalytical applications EIS is also used for the investigation of interfaces, solid materials or electrochemical kinetics (Lasia, 2002). This thesis makes use of EIS to study cells in the form of two-dimensional monolayer cultures and three- dimensional multicellular spheroids.
3.1.1 Physical Background of EIS
Impedance is the complex resistance to alternating current reflecting the ability of an electric system to resist current flow and to store electrical energy. This is the case when an alternating current is applied to a circuit that is composed of resistors, capacitors and inductors.
The electrical impedance Z of a system can be expressed based on Ohm’s law as the ratio of sinusoidal voltage U(t) and current I(t) at time t:
| |
Eq. 3.1
with U0: amplitude of voltage, I0: amplitude of current, IZI: magnitude of impedance, : phase shift between voltage and current and : angular frequency ( ).
Fig. 2: A: Relationship between voltage, current and impedance. A sinusoidal voltage with amplitude U0 induces a sinusoidal current with amplitude I0 and a shift in phase by
B: Illustration of the complex impedance Z as a vector in the Gaussian plane. Z is composed of a real and imaginary part (R, X) reflected in the x- and y-axis. The length of the vector Z represents the magnitude of impedance IZI and the angle between the vector and the real axis reflects the phase angle .
As depicted in Fig. 2 A voltage and current are both sine waves with the same frequency, but the current may be shifted with respect to the voltage by the phase angle .
Alternatively, the impedance can also be expressed as a complex function. Using the complex notations for voltage and current:
Eq. 3.2
Eq. 3.3
with i: imaginary unit ( √ ), and Euler’s relationship:
Eq. 3.4
the complex electrical impedance in Eq. 3.1 translates into:
| | | | Eq. 3.5
So the complex impedance is a combination of the real part, also called resistance R arising from current in-phase with the voltage, and the imaginary part, also termed reactance X arising from 90 ° out-of-phase current:
Eq. 3.6
| | Eq. 3.7
| | Eq. 3.8
An illustration of the complex impedance Z with its real (R) and imaginary (X) part in the Gaussian plane is given in Fig. 2 B.
Using the following expressions the Cartesian coordinates R and X can be converted into the polar coordinates IZI and and vice versa:
| | √ Eq. 3.9
( ) Eq. 3.10
3.1.2 Data Representation
The two types of data presentation that are typically used in literature are the Bode diagram and the complex plane plot. In the Bode diagram the magnitude of impedance IZI and the phase angle are plotted as a function of frequency on double- or semi-logarithmic scales, respectively. Using a logarithmic scale is beneficial when plotting a broad range of frequencies or impedances.
A complex plane plot displays the negative imaginary part (- Im(Z)) of the impedance on the y-axis versus the real part (Re(Z)) on the x-axis. For a system containing resistive and capacitive contributions the complex plane plot typically shows a semicircle providing information on the electrical structure of the system.
A drawback of this presentation is that there is no direct information on the frequency dependence. Often, only an arrow pointing to the direction of increasing sampling frequency is included in the plot.
In this thesis the data is presented using the Bode diagram without the phase angle data.
3.1.3 Data Analysis
In impedance spectroscopy an alternating current is applied to a system under investigation and the resulting voltage is measured over a range of frequencies.
In order to evaluate the obtained data the electrical structure of the system can be described by an equivalent circuit which is composed of serial or parallel connections of ideal (resistor, capacitor, inductor) and non-ideal (Warburg impedance, constant phase element) equivalent circuit elements. Then, the transfer function of the equivalent circuit is determined considering Ohm’s law and Kirchhoff’s circuit laws. Finally, the transfer function is fitted to the recorded data to provide quantitative information about the parameters of the circuit elements and how they change during an experiment.
3.1.4 Equivalent Circuit Modeling
In order to build an equivalent circuit that fits to the electrical behavior of the system under study there are five elements that can be used (Tab.2).
Tab. 2: Overview of the ideal and empirical circuit elements, their respective impedance contribution and phase shift. The symbol of each element is given in brackets after the full term.
Equivalent Circuit Element Impedance Z Phase Shift
Resistor (R) R 0
Capacitor (C)
Inductor (L)
Constant Phase Element (CPE)
A, n (0 < n < 1) Warburg Impedance ()
√
The network can hold ideal elements like resistance, capacitance and inductance. An ideal resistor is frequency-independent but influences the amplitude of the current without causing a phase shift. Capacitor and inductor, on